Article

At a Glance
- The Super Bowl is the largest individual television advertising event of the year; it has become an unparalleled platform for brand building and product launches.
- Next-day insights from Bain Media Lab, a collaboration between Bain & Company and Hive, measured the relative household viewership for each of the Super Bowl commercials as well as the cumulative quantity and quality of sponsorship placements during the game.
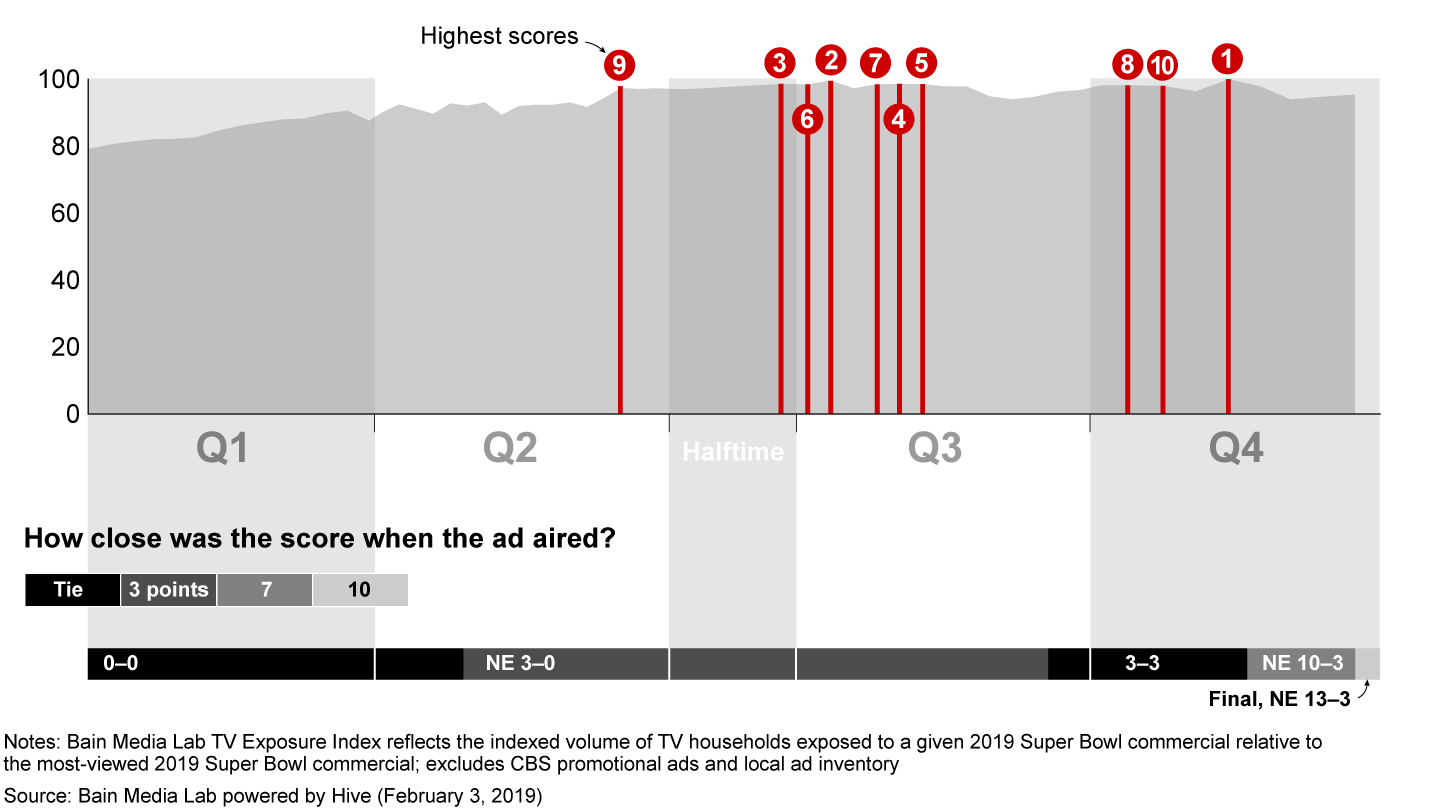
- Commercial viewership on TV peaked during the second half of this year’s Super Bowl, including 9 of the 10 most exposed ads. Viewership remained high throughout the game, however, with half of all commercials within 5 percentage points of the peak audience.
- Thirteen brands achieved more than 15 seconds of sponsorship visibility or earned media through logo and product placements embedded in the telecast; this exposure was led by official sponsors of the NFL and of CBS, which broadcast the game.
With more than 100 million Americans tuned in from homes, bars and viewing parties across the country, the Super Bowl offers unparalleled reach to marketers seeking exposure for their brands.
Objectives of Super Bowl advertising vary. This year, Super Bowl ads drew awareness to new or recently launched brands, products and offers (for example, Disney’s Captain Marvel and Audi’s e-tron GT); they also built brand affinity through new messages (such as Budweiser announcing that its beer is now brewed with 100% renewable electricity from wind power).
Measures of success are equally varied. Surveys and polls have long crowned winners by recall and favorability. In a multiscreen world, the metrics have expanded to include views, tweets, likes and shares. For the C-suite, however, the most meaningful measures are the outcomes that marketers hope these ads influence—namely, website traffic, store visits and ultimately sales. The lack of a definitive linkage between individual TV advertisements and outcomes, however, remains a barrier to a better understanding of the returns on these investments.

Bain Media Lab
Bain has teamed with AI pioneer Hive to develop and launch a co-branded product suite in the TV analytics space—bringing an unprecedented level of insight, measurement, and attribution to the TV advertising space.
The emergence of more advanced TV analytics solutions, however, provides marketers and media companies with an improved ability to link consumers’ TV advertisement and sponsorship exposure to their subsequent actions. Research from Bain Media Lab powered by Hive measured the household viewership for each of yesterday’s Super Bowl commercials as well as the cumulative quantity and quality of sponsorship placements during the game, accelerated by computer vision analysis and artificial intelligence. While business outcomes from this year’s Super Bowl ads will take time to assess, we already know which brands received the most exposure from TV’s biggest forum.
This year’s most-viewed Super Bowl commercials
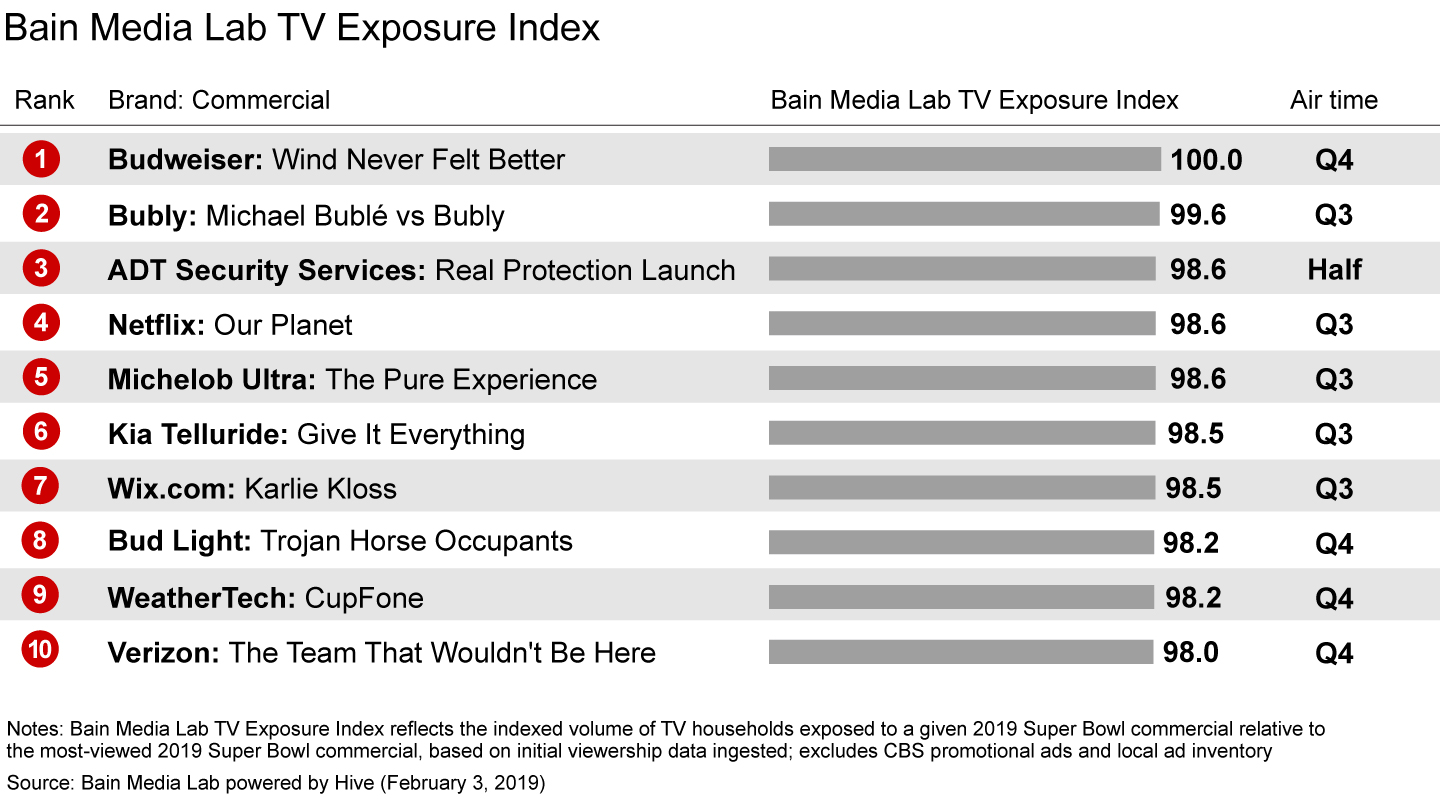
Budweiser’s “Wind Never Felt Better” commercial received the most live TV impressions of all ads during this year’s Super Bowl, followed by PepsiCo’s Bubly commercial featuring Michael Bublé. The remainder of the top 10 were all within 2 percentage points of the largest audience, including ads from ADT, Netflix and Michelob Ultra (see Figure 1).


No bad spots
Typically, the time of a commercial break and even the order in which an ad airs within that break affect the level of viewership an ad receives. This holds true for most NFL games, widely considered the most valuable live content on television. While the reach and ratings of NFL games are among the highest available, viewership levels throughout a regular season game tend to fluctuate. While some patterns are recurrent, such as a dip in viewership at the start of halftime, others are harder to predict ahead of kickoff. Audiences can grow over time, such as when viewers join late after the games they were watching on other networks end or when social media activity draws in more viewers to a competitive thriller. Conversely, viewership can also taper off in the back half of less competitive matchups, especially for early games when another game kicks off.
The Super Bowl tends to be less affected by these patterns, and this year was no exception. Viewership during this year’s game steadily ramped up and stabilized throughout the game. From the start of the second quarter through the end of the game, viewership of any individual commercial was within 10 percentage points of the most-viewed ad, and roughly half of all commercials were within 5 percentage points of the most-viewed ad (see Figure 2).


More than spots and dots
Commercials get most of the fanfare, but the Super Bowl also provides similarly broad exposure for brands through sponsorships and, for those lucky or savvy enough, earned media. While there was no “Fiji water girl” stealing scenes and making headlines such as during last month’s Golden Globes, we saw a rich set of brand logos and product placements integrated into the telecast.
Most of these were very deliberate, reflecting sponsorship deals worth tens or even hundreds of millions of dollars per year. As linear television viewing continues to erode, marketers and media companies alike have leaned into sponsorships and branded content as alternative means to reach audiences on television. The challenge has been how to measure and ascribe value to those placements accurately and efficiently.
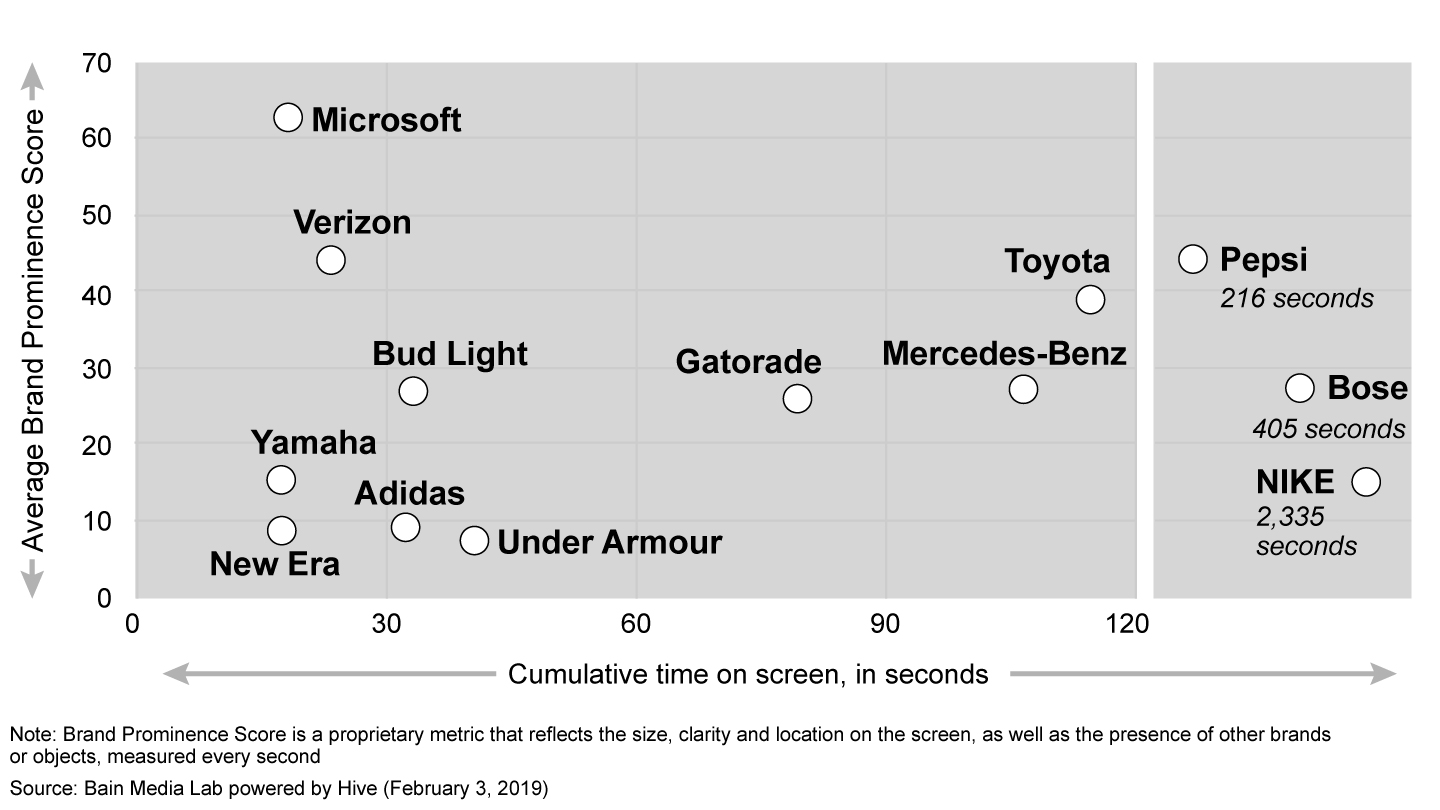
Bain Media Lab measures sponsorships and earned media via Hive’s proprietary content data set, which uses computer vision and artificial intelligence to place more than 1 billion tags of metadata on television content daily, identifying objects, including logos and product placements. To do this accurately, it is important to know not only how long a logo or product appears on screen but also how visible it is to the viewer. To that end, each logo or product placement also receives a Brand Prominence Score, reflecting the size, clarity and location on the screen, as well as the presence of other brands or objects on the screen.
During this year’s Super Bowl, 13 brands achieved more than 15 seconds of cumulative screen time for their logos outside of commercial breaks; 9 brands received cumulative screen time that equaled or exceeded the length of a full 30-second commercial spot. The most and highest-quality logo and product placements were achieved by official sponsors of the NFL and of CBS, which broadcast the game.
NIKE, the NFL’s uniform and on-field apparel supplier, logged almost 40 minutes of cumulative Super Bowl screen time with swooshes visible on uniforms, cleats and other sideline apparel. Bose, the league’s official headset provider, achieved the second most sponsorship visibility, tallying more than six and a half minutes of cumulative screen time from cameras focused on coaches. Rounding out the top five was Pepsi (which sponsored the game’s halftime show), Toyota (which sponsored the halftime report) and Mercedes-Benz (which owns the naming rights to the host stadium). Among the top five, Pepsi achieved the highest average Brand Prominence Score for each second of sponsorship visibility, the result of large digital overlays featured in between plays and during parts of the halftime show (see Figure 3).


This year’s Super Bowl ended after Tom Brady took a knee to run out the clock and clinch the New England Patriots’ sixth Super Bowl championship. Measuring the impact of this year’s Super Bowl advertisements and sponsorships, however, has just kicked off. Rest assured, the marketers who bet big will be tuned in.
Dan Calpin and Andre James are partners with Bain & Company in Los Angeles. Dan leads Bain Media Lab, and Andre leads Bain's Global Media & Entertainment practice. Elizabeth Spaulding is Bain partner in San Francisco, and she leads Bain’s Global Digital practice. Kevin Guo is cofounder and CEO of Hive, a full-stack deep learning company based in San Francisco that focuses on solving visual intelligence challenges.
The authors would like to thank Rishi Roongta, a senior innovation expert with Bain in San Francisco and the founder of Bain Innovation Exchange, for his contributions to the formation of Bain Media Lab.
Note: Published Bain Media Lab research relies solely on third-party data sources and is independent of any data or input from clients of Bain & Company.