Report

This article is Section 3 of Bain’s 2020 Global Private Equity Report.
Investors have poured more than $2 trillion into buyout funds over the past decade for a simple reason: They deliver. Over the past 30 years, US buyouts have generated average net returns of 13.1%, compared with 8.1% for an alternative private-market performance benchmark, based on the Long-Nickels public market equivalent (PME) method and using the S&P 500 as the proxy.
Shorten the time frame, however, and the picture isn’t what most PE investors were expecting. Since 2009, when the global economy limped out of the worst recession in generations, US public equity returns have essentially matched returns from US buyouts at around 15% (see Figure 3.1).
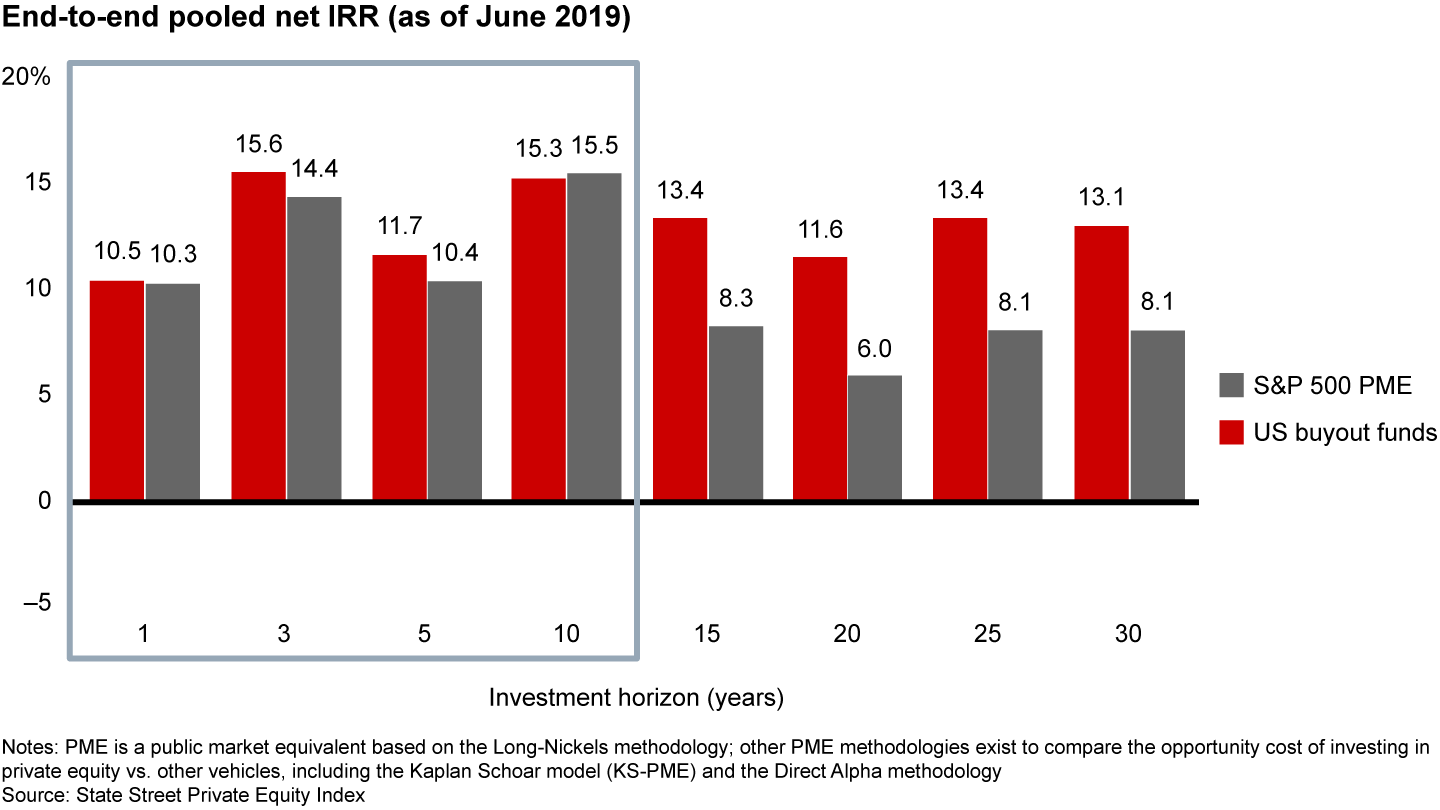
While a 15% average annual return net of fees is impressive even by private equity’s own high standard, parity with public markets is not what PE investors are paying for. The institutions that allocate increasing portions of their portfolios to buyout funds have good reason to expect a premium. They lock up their money for a period of years with the presumption that professional managers will generate alpha through innovative value-creation strategies and leverage. All things being equal, public equities offer more liquidity at less cost.
And that raises a disquieting question for buyout managers: Will the convergence in 10-year returns make it harder to raise the next $2 trillion?
The power of cycles
Working with Professor Josh Lerner of Harvard Business School, as well as State Street Global Markets and State Street Private Equity Index, we analyzed what’s been driving returns in both markets. Our study found little evidence to suggest that competition from the public markets is likely to persist. The first clue: The surge in public valuations following the global financial crisis is neither surprising nor unprecedented. Given the historic sell-off in the wake of the crisis, US stocks were teed up for an equally historic rebound.
Over the ensuing decade, several factors created strong upward momentum. First, US monetary and tax policy couldn’t have been more accommodating, leading to a slow but steady expansion that produced the lowest level of unemployment in half a century. At the same time, US equities benefited from a global flight to quality as bad news in Europe―Brexit, sovereign default scares, the threat of recession in Germany and Southern Europe―drove investors to seek solace in the S&P 500. It’s worth noting that public and private returns have not converged in Europe. There, PE’s historic outperformance continues (see Figure 3.2).
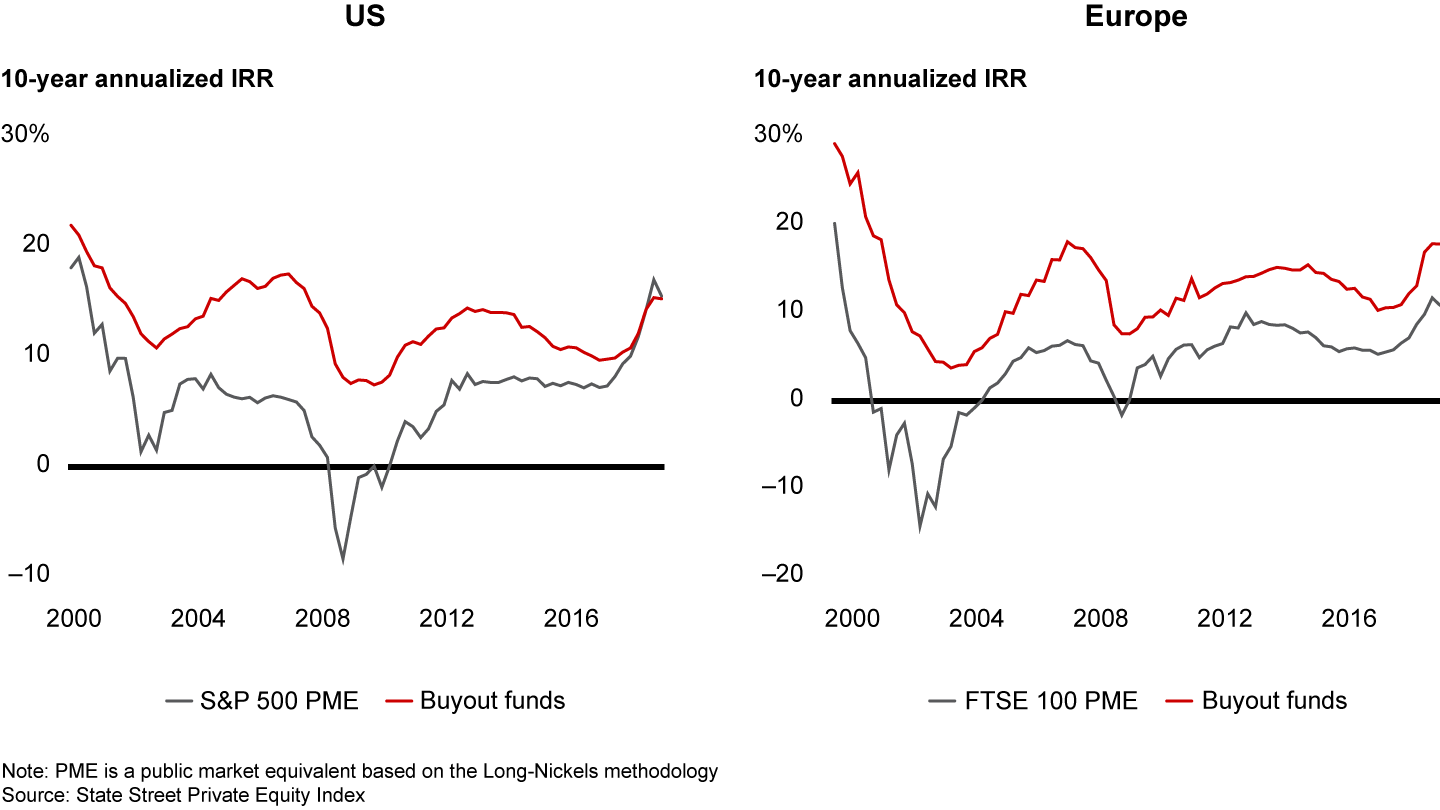
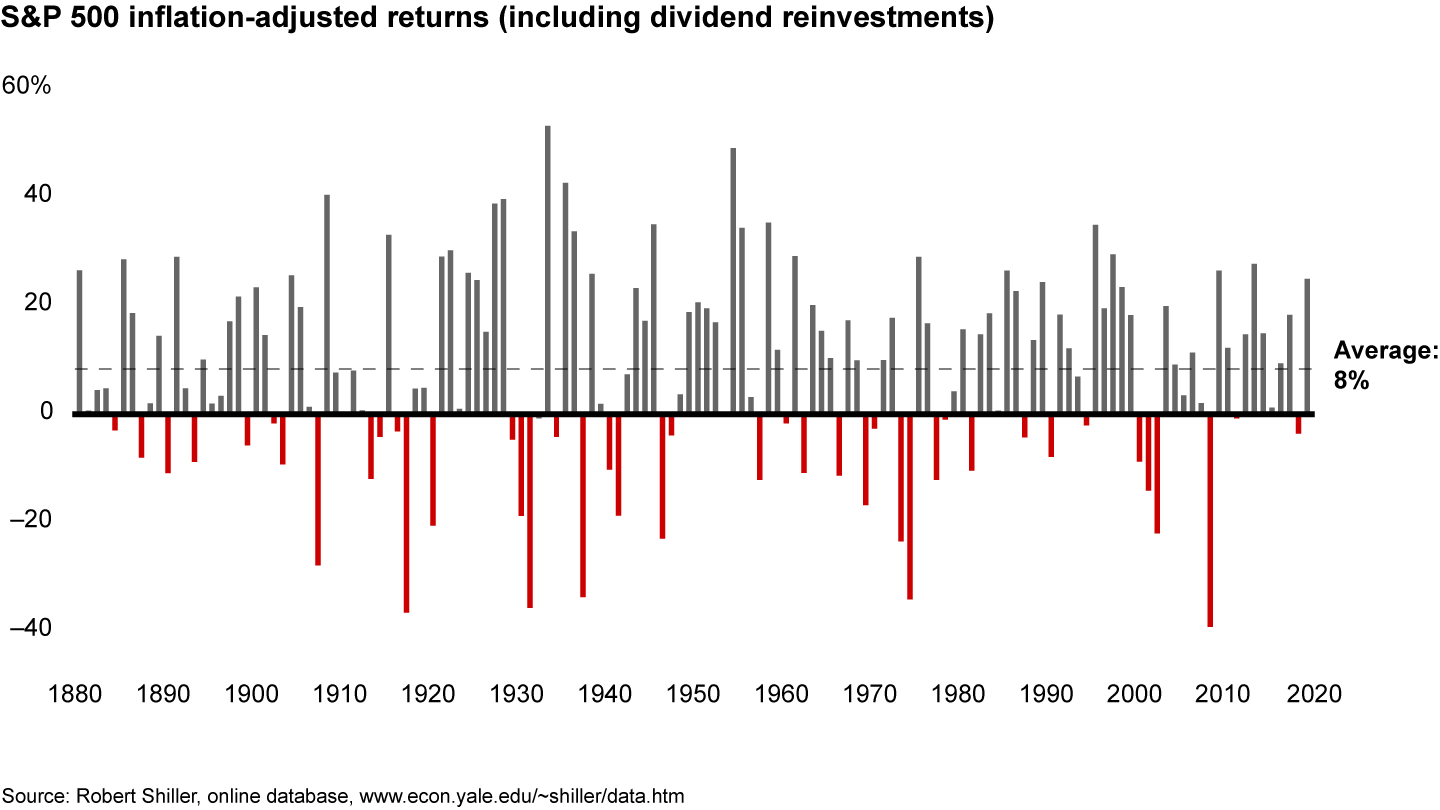
Several periods in US market history have produced similar surges, including the decade ending in March 2000, when accommodating monetary policy and the inflating dot-com bubble drove a 19.4% 10-year return for the S&P 500 PME index. Of course, what came next also followed a pattern. Inevitably, such periods of exuberance in public markets are punctuated by years of lethargy as performance reverts to the mean. In the decade following the dot-com crash (through March 2010), the PME index’s annual return fell to 0.08%, while private equity maintained a 7.5% average. As noted earlier, the PME index has posted an 8.1% annualized return over the past 30 years, which is consistent with the 8% average logged by the S&P 500 over the 140 years for which public market data is available. In about 30% of those years, the public markets generated negative real returns—three times private equity’s down-year rate for its 30-year history (see Figure 3.3).
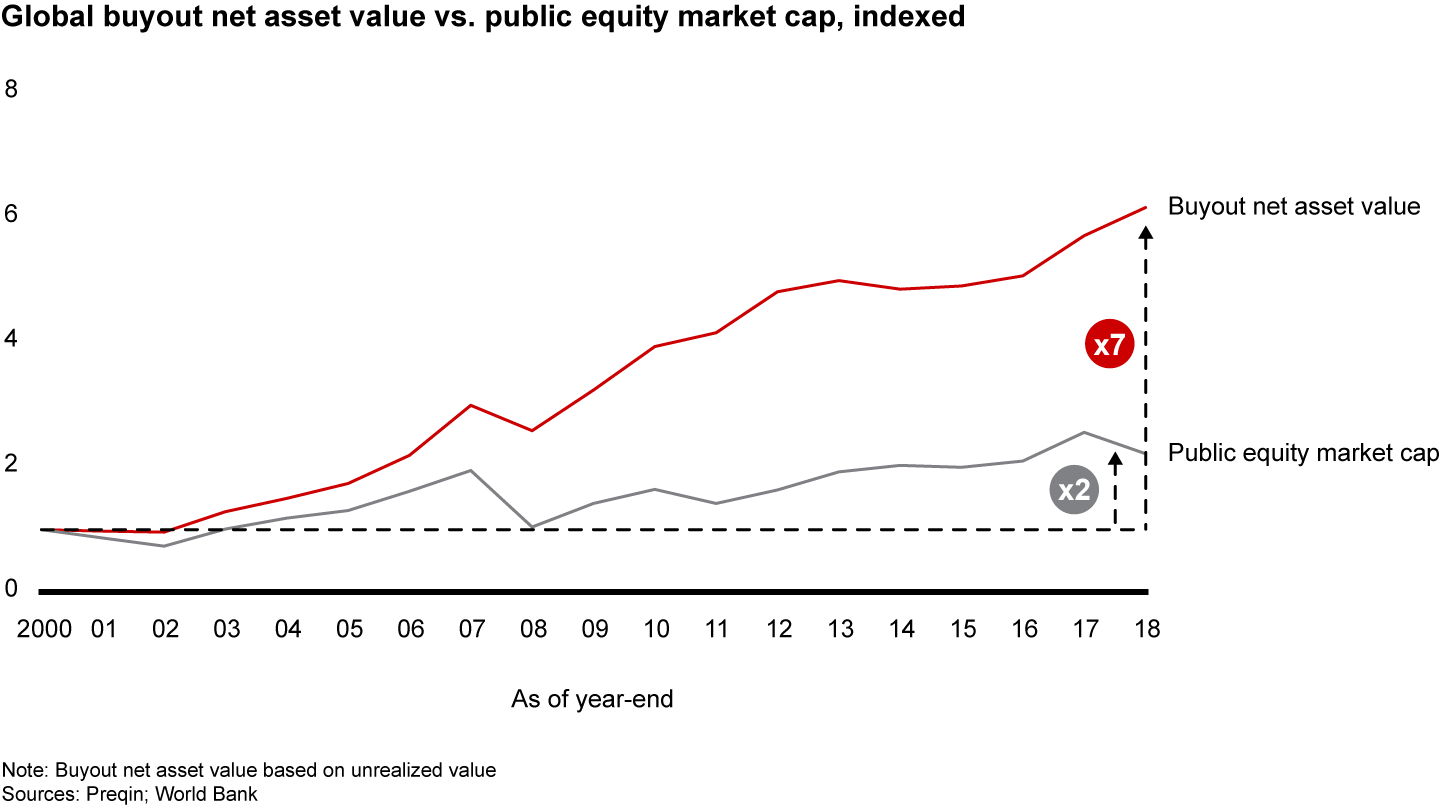
There’s little reason to believe that US equities will somehow break out of this pattern and sustain these double-digit returns over the long term. Indeed, short sellers live for the predictions of a “new normal” that always seem to come at the end of a cycle. Private equity investors recognize this and continue to believe in the consistent, long-term outperformance that buyout funds deliver. They also continue to vote with their wallets. Since 2000, net asset value for global buyouts has grown 3.5 times faster than the public markets (see Figure 3.4). Most PE investors can’t get enough: Around 50% of LPs are heading into 2020 underallocated to private equity.
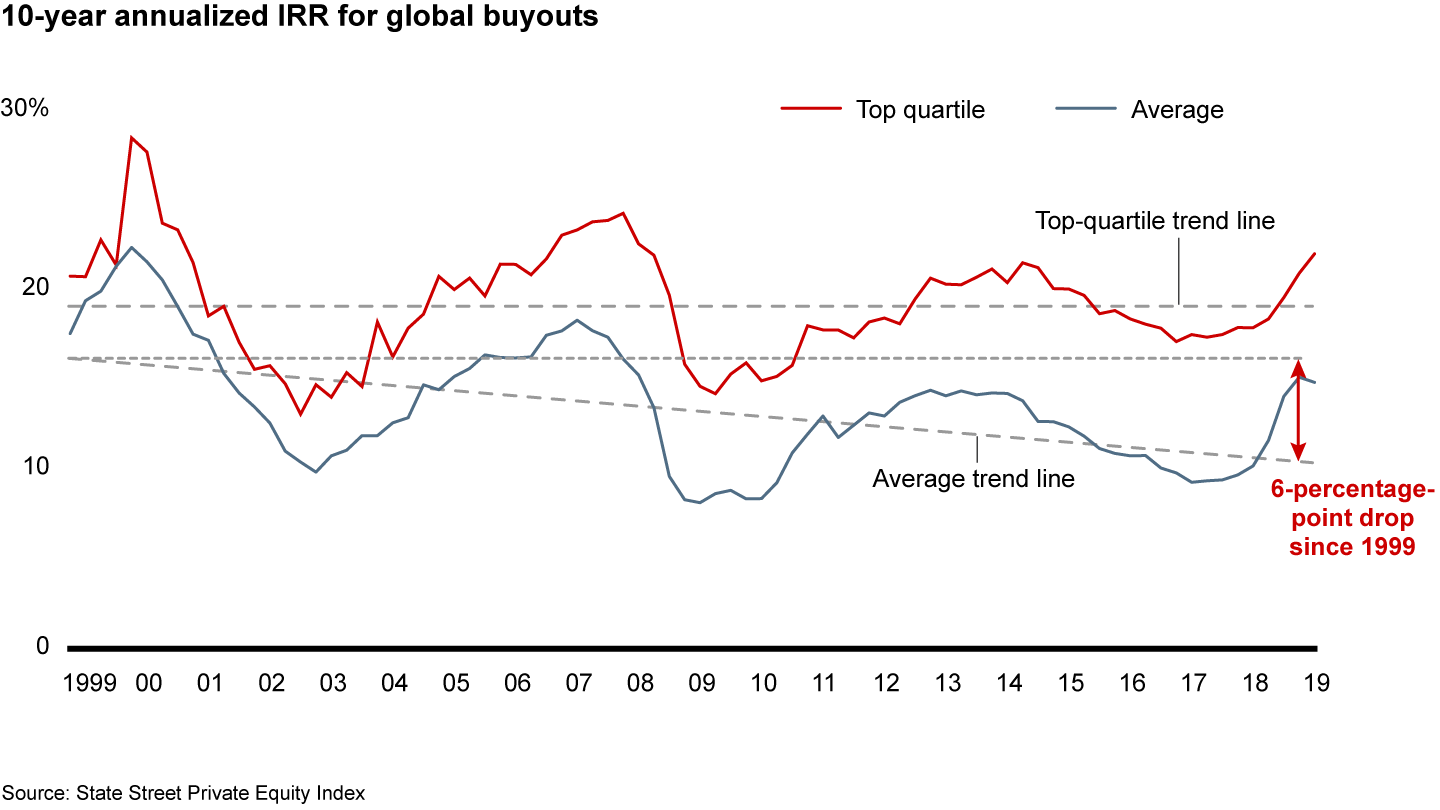
None of this means that the private equity industry should relax, however. While competition from the public markets will surely ease off at some point, the long-term trend in PE returns is more troublesome. As strong as private equity’s performance has been for the past decade, buyout returns have been trending downward over the past 30 years. If you draw a trend line between the 10-year return in 1999 and the 10-year return today, it would show a decline of 6 percentage points over that period (see Figure 3.5). Extend the same slope out another 10 years, and PE returns start to look a lot less compelling.
To a large degree, this is a function of maturity. As private equity’s relative outperformance attracts increasing amounts of capital from investors, competition for a limited number of high-quality assets increases, driving up average purchase price multiples. Buying at premium prices makes it ever more challenging to create value during ownership and exit with an acceptable return. Add in growing pressure from well-heeled corporate buyers, and generating alpha becomes even more daunting.
It’s also clear, however, that an elite group of firms has found a way to buck the trend. While average returns have declined over time, top-quartile returns have essentially held steady. This explains why a large majority of the capital flowing into private equity is targeting these top-tier firms. For those in the bottom quartiles, raising a fund is already becoming more difficult. And with deal multiples at record levels, it’s not going to get any easier in the years ahead to generate the kind of performance investors are looking for.
What are these top-tier funds doing right? We recently studied a pool of 113 private equity firms that each have raised $5 billion or more since 2000. If at least 80% of a firm’s funds ranked in the top two quartiles of industry performance over that period, we defined it as a consistent outperformer (see Figure 3.6). There were 28 of these firms in our sample, and they clearly won on a deal-by-deal basis, as measured by internal rate of return. They had many more deals with an IRR above 15% (32% of their portfolios vs. 18% for the laggards) and far fewer write-offs (5% vs. 8%).
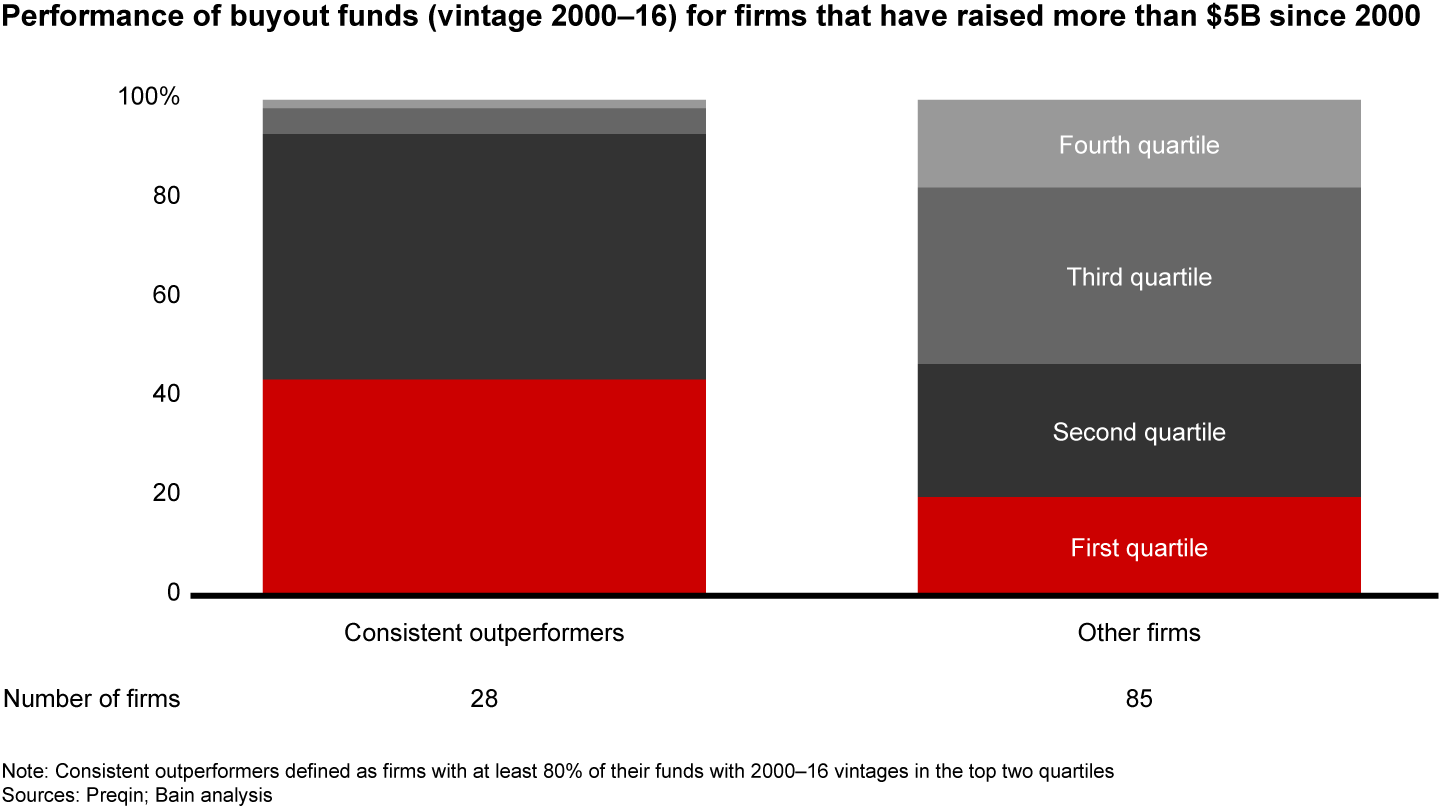
Data can’t really capture how these firms consistently outperform, but a more qualitative and experience-based analysis suggests it boils down to focus: The best firms know what they are good at and wield that as a competitive weapon. In a world of high prices and intense competition, they understand that expertise matters. You have to be much more focused on the sectors you’re investing in, the risks you’re underwriting and your ability to actually get the value once you own the asset.
Funds do this in a variety of ways. Our consistent outperformers fell into four broad categories (see Figure 3.7).
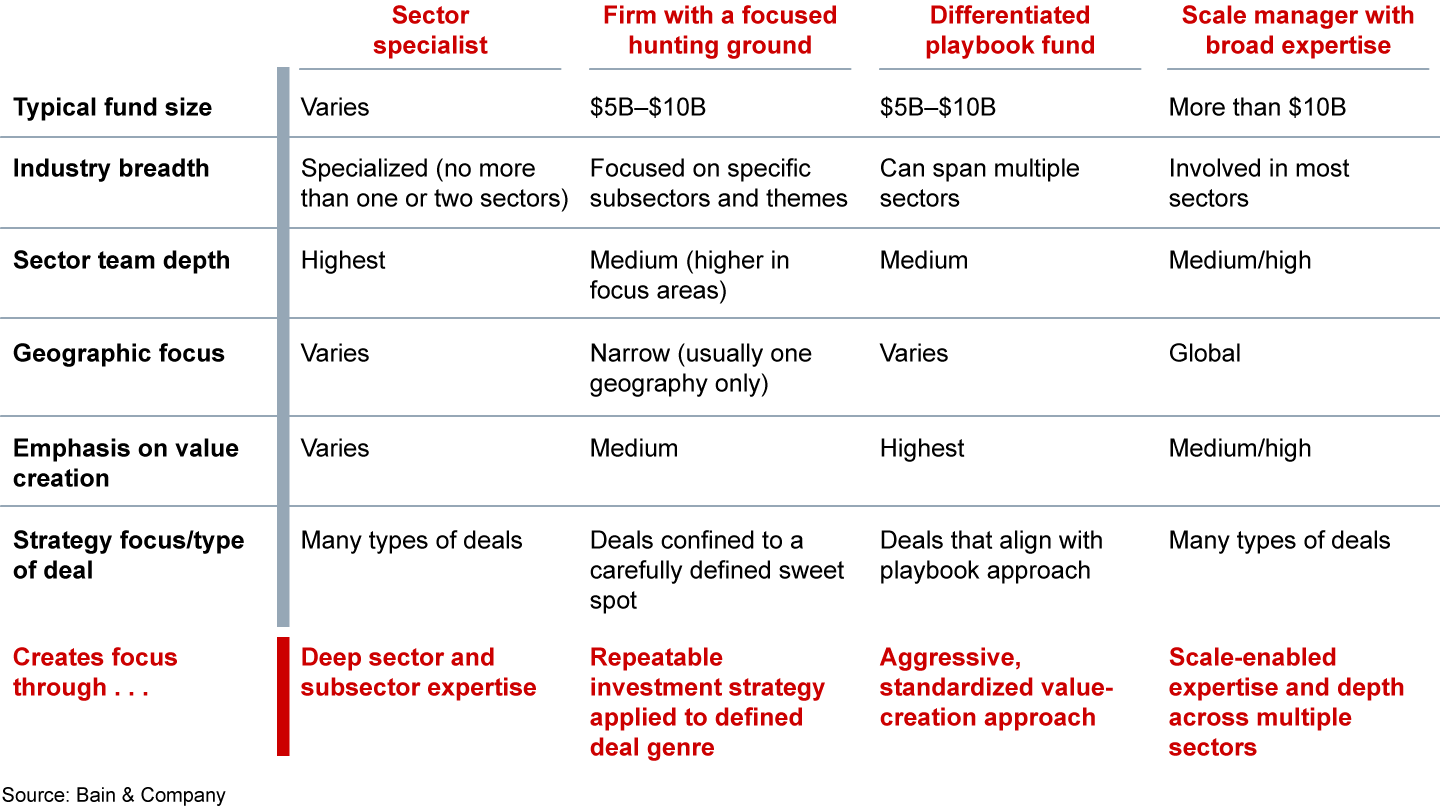
- Sector specialists. These firms make it their business to know more about a given sector than anyone else. They’ve become so smart in that area that they can assess risk and opportunities in ways the competition can’t. (Think Thoma Bravo, Silver Lake and Vista Equity in tech, Charlesbank and L Catterton in consumer.) The institutional knowledge these firms have built provides differentiated insights that win auctions and drive value creation.
Silver Lake, for instance, focuses on technology and technology-enabled businesses. It understands how to manage very large deals and is adept at building platform companies. A strong tech network and a culture of collaboration between its investment and operating teams are differentiators. From 2000 through 2016, 95% of Silver Lake’s funds ranked in the top two quartiles. It has raised $41 billion since 2000, almost all of it for buyout funds.
- Firms with a focused hunting ground. Like sector specialists, these firms target a sweet spot with a repeatable investment approach, but they don’t limit themselves to one sector. Instead, they may have a narrower geographic focus or stick to their core buyout asset class. The key is that they know exactly what kind of risks they are underwriting in any deal and are very comfortable they can manage those risks. They also know what risks they will never underwrite, and they have honed their approach to reduce loss ratios and capitalize on positive bias to volatility and risk. Examples include MBK Partners, Equistone Partners Europe, Veritas Capital and Audax Group, which focuses on buy-and-build strategies.
Based in Seoul, MBK introduces itself as “a leading North Asia private equity firm, owned and operated by Asians.” The firm invests across sectors but is extremely deliberate about the kind of deals it goes after—mostly mature companies that operate in South Korea, Greater China and Japan. MBK has a strong focus on control investments, giving it more influence when working with management to create value. From the firm’s inception in 2005, all of its funds have performed in the top half of the industry, and the $16 billion it has raised (or is about to close) for buyout funds represents 95% of its capital.
- Differentiated playbook funds. These funds know from pattern recognition what kinds of companies they can improve and how. They have a well-defined playbook that works on companies with certain characteristics, and by running it with great precision, they create significant value during ownership. Examples include Clayton, Dubilier & Rice (CD&R) and GTCR.
CD&R focuses on companies with sustainable market-leading positions in industries poised for long-term growth. It looks for differentiated products, services or processes, but also the potential to improve growth and enhance productivity. CD&R does exhaustive up-front diligence, characterized by strong collaboration between its deal and operating teams. The resulting investment thesis usually relies on using operational enhancements to improve margins. CD&R placed 100% of its funds in the top two quartiles from 2000 through 2016, and the $25 billion it has raised for buyouts represents 97% of its total since 2000.
- Scale managers with broad expertise. Scale funds capitalize on their size and breadth. Their point of differentiation is that they can bring massive resources to whatever they invest in and often do the biggest, most complex deals. Firms like Blackstone, KKR, CVC, EQT, Permira and Apax Partners raise tens of billions in capital and operate very large funds. They have teams of people with deep expertise, and they have the staying power to wait out troubled investments that otherwise would go bust.
CVC invests in a cross section of global industrial and service businesses. In Europe and the Americas, it looks for companies with solid market positions, stable cash flows, strong management teams and attractive prospects for organic or acquisition-led growth. CVC uses its scale and incentive structure to attract top dealmaking talent. Between 2000 and 2016, 83% of its funds generated performance in the top two quartiles. The $74 billion in buyout capital it has raised since 2000 accounts for 97% of its total.
Focused firms win—and win consistently—because commitment to a formula sharpens all phases of the value-creation cycle. They source deals better than others based on a keen understanding of what they’re looking for and where to find it. They assess value more precisely in diligence because they are confident in their ability to identify opportunities and manage risk. During ownership, they know what works and what doesn’t, and they have a clear, active strategy for capturing value. They’re more adept at developing the right management team, adding capabilities when necessary, and tapping into the right ecosystem of partners when that makes sense.
Increasing competition for deals is driving specialization, which means that anybody you’re bidding against has an angle. In a carve-out deal, you don’t want to be the rookie in a process dominated by firms that have done 20 similar carve-outs and know precisely how much margin they can capture and how they will do it. Similarly, if you’re doing your first industrial turnaround, you might think twice if you’re bidding against a firm that is an expert at reducing costs quickly and at improving margin sustainably. If you don’t have an angle, you’re going to be the odd firm out. And if you win at a high price, you may come to regret it.
Middling funds can step up their game by developing the kind of differentiated focus that distinguishes the top tier. That process begins with a few key questions:
- Is your sweet spot clear and distinctive?
- Is there a particular sector or geography that you know better than anybody else?
- Can you confidently and repeatedly recognize patterns for value creation and deliver against them?
- Do you have differentiated scale that allows you to overwhelm the competition with more resources and staying power?
The imperative is to develop expertise both internally and by leaning on outside partners and ecosystems if need be. Limited partners will continue to gravitate to the industry’s top performers. The real lesson from this period of convergence is that if you aren’t in that group, your ability to raise funds in the future will likely be compromised.
Explore the report
More from our 2020 Private Equity Report
Private Equity Report
This article is part of our 2020 Global Private Equity Report.


