Report

At a Glance
- Deal value plunged 44% in 2022 to $198 billion; exit value dropped 33% to $132 billion.
- Returns rose to a new high of 15% median net internal rate of return, from 13.9% a year earlier, but a turning point may be ahead.
- Leading investors ride out the storm by identifying recession-proof sectors and top-performing companies.
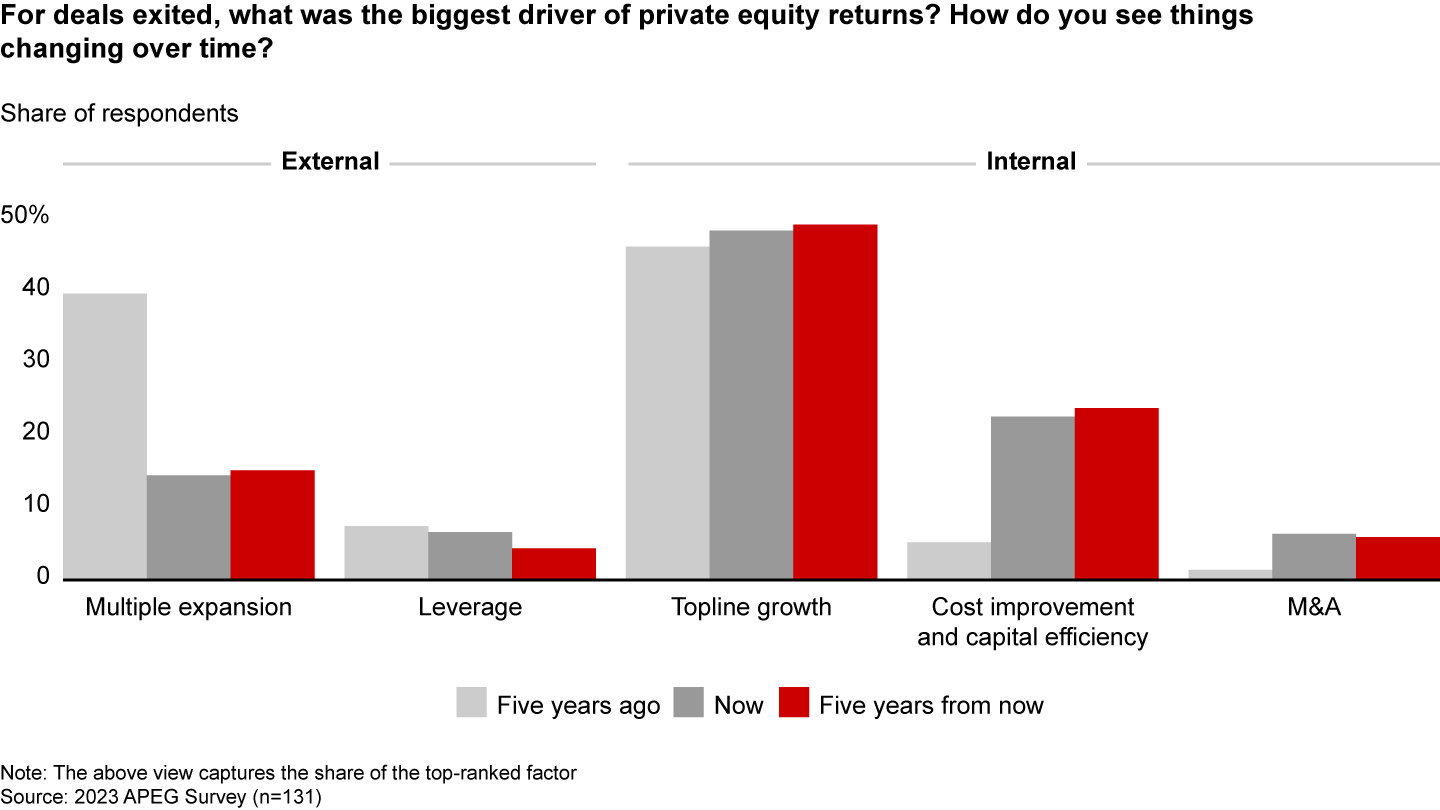
- More than half of general partners in a recent Bain survey expect cost improvement to become one of the biggest factors affecting deal returns in the next five years.
Asia-Pacific private equity funds turned cautious in 2022, ending two years of record dealmaking. By midyear, an economic slowdown collided with mounting global and regional uncertainties to produce a perfect storm for investors. As companies struggled, general partners (GPs) retrenched and Asia-Pacific deal value plummeted 44% to $198 billion (see Figure 1). Exits and fund-raising also fell sharply below 2021 levels.
In golden hindsight, investor exuberance and a superabundance of global capital helped propel Asia-Pacific deal value to an extraordinary high in 2021. That set the stage in 2022 for an equally sharp decline as economic forces battered the market, pushing deal value to the level of 2020.
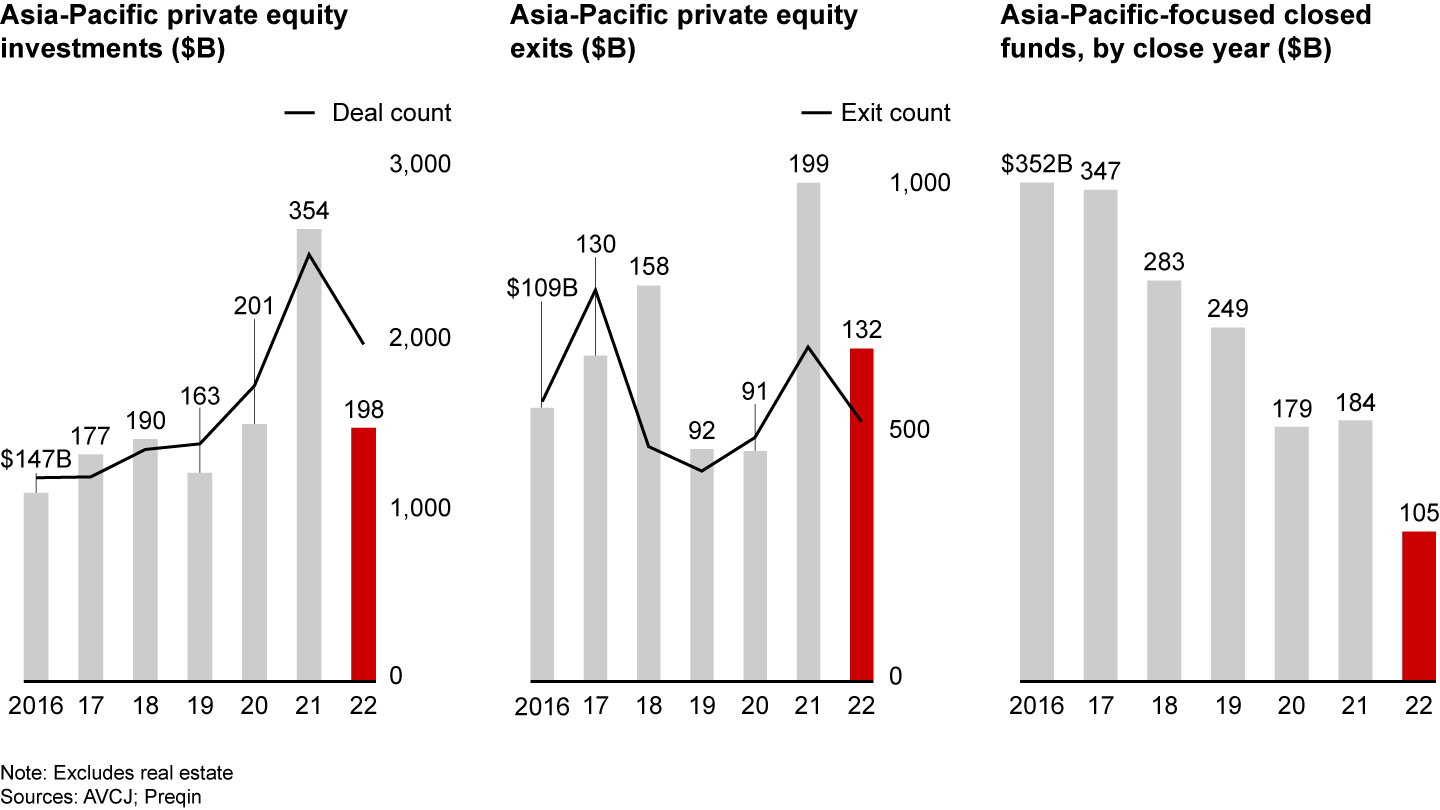
Many conditions contributed to investor gloom, including slower economic growth, declining consumer confidence, falling manufacturing output, high inflation, and heightened geopolitical tensions. Even the relaxation of Covid restrictions across the region failed to reverse the trend. Macroeconomic weakness is now the No. 1 concern keeping the region’s investors awake at night, according to Bain’s 2023 Asia-Pacific Private Equity survey.
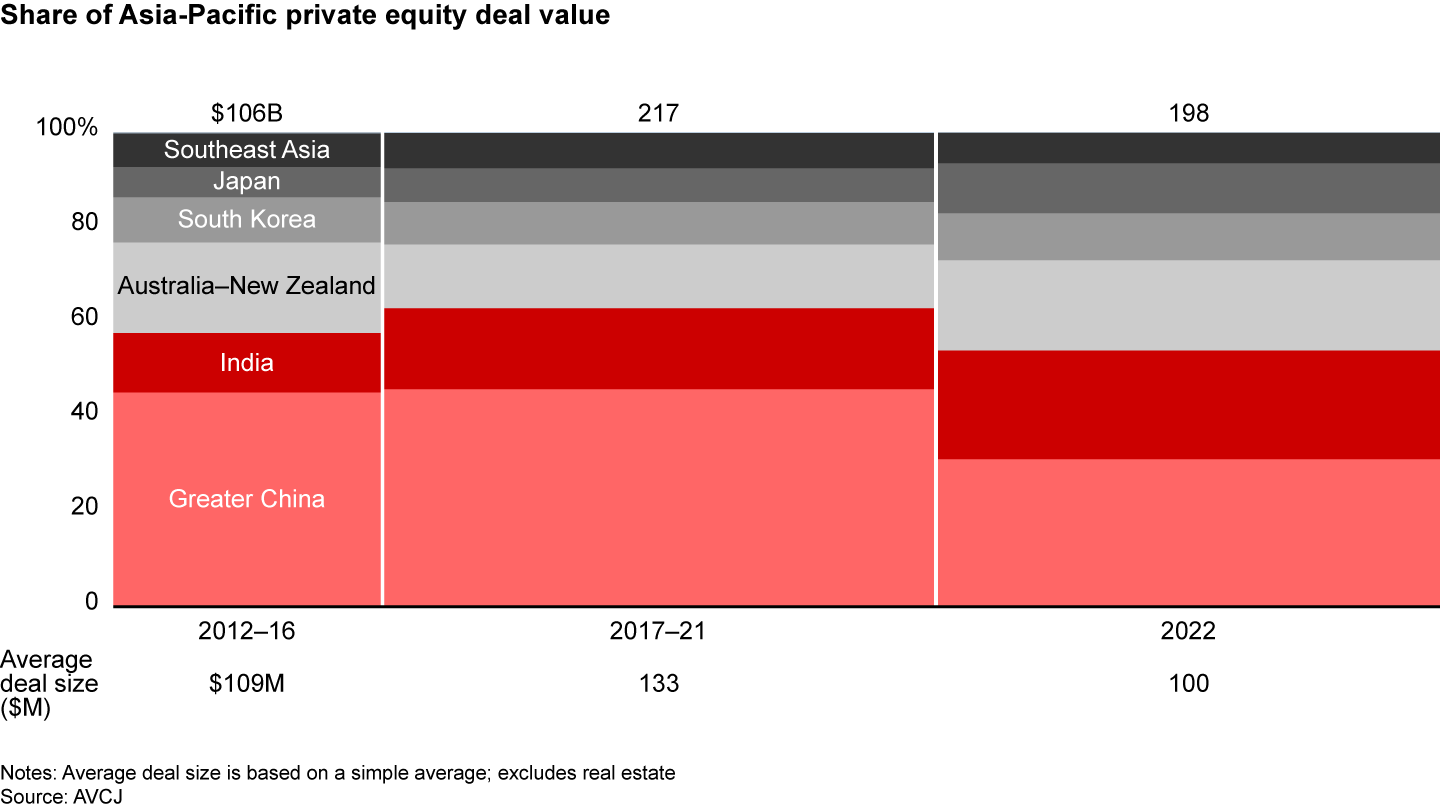
Greater China, the region’s private equity powerhouse, suffered the biggest contraction in deal activity. Covid lockdowns, declining growth, and Sino-US tensions contributed to a 53% drop in Greater China deal value from a year earlier. That fall depressed Greater China’s share of Asia-Pacific deal value to a nine-year low of 31%.
Internet and technology, still the region’s largest investment sector, made up only 33% of Asia-Pacific deal value in 2022, the lowest level since 2017. Inflation, which erodes topline growth and profitability, contributed to the decline in the sector’s share of deal value. Investors turned instead to defensive sectors that offer steady cash flow and lower risk, including advanced manufacturing and energy and natural resources. Investments in critical infrastructure across the region also contributed to the growing number of deals in these sectors.
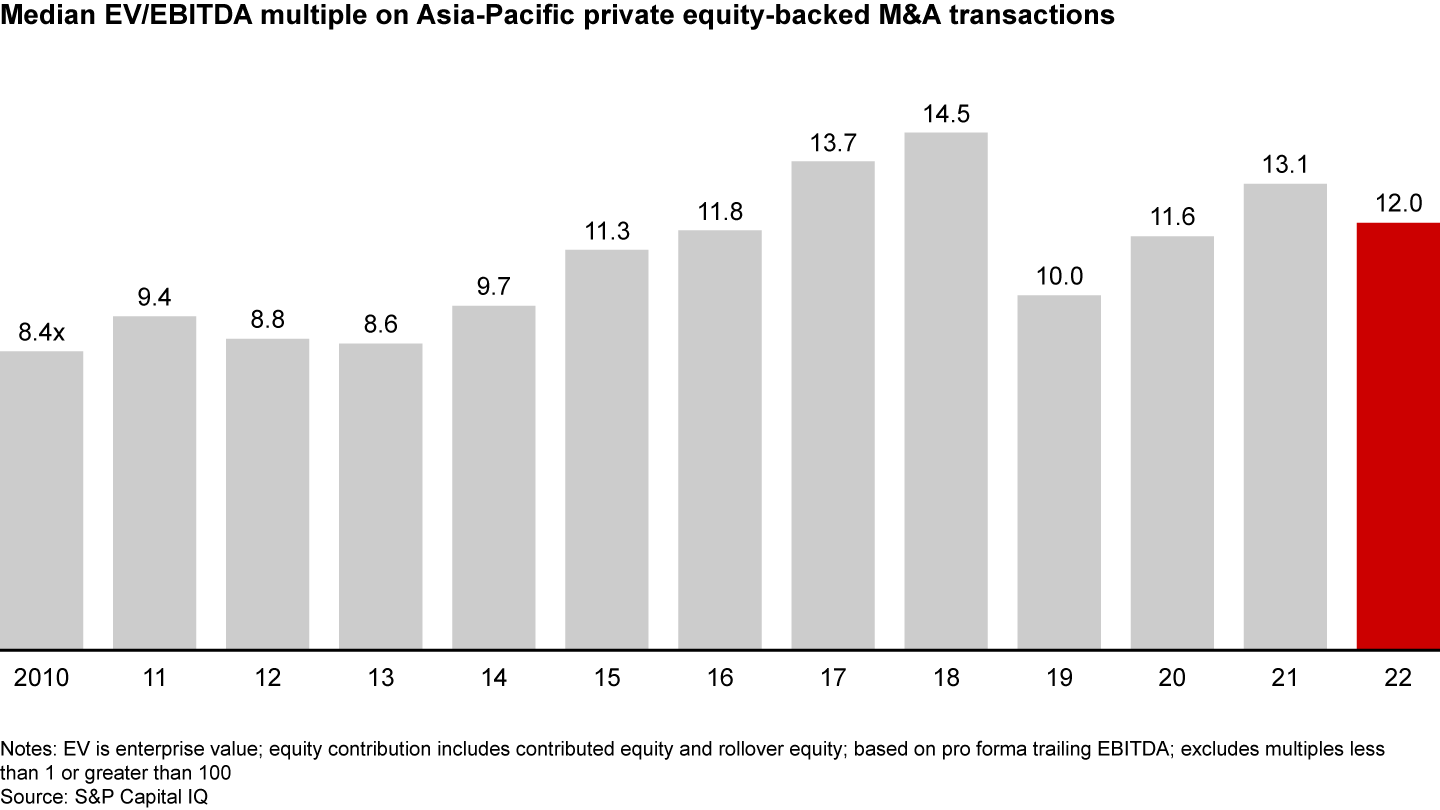
An uncertain business outlook and lower ratings for public companies helped push deal multiples down to 12 times from 13.1 times (median enterprise value to EBITDA) a year earlier. The slowdown in dealmaking and fewer top-priced Internet and tech deals also depressed valuations. However, GPs still don’t view current valuations as attractive, given ongoing market uncertainty. High entry multiples remain a top concern, according to our 2023 survey.
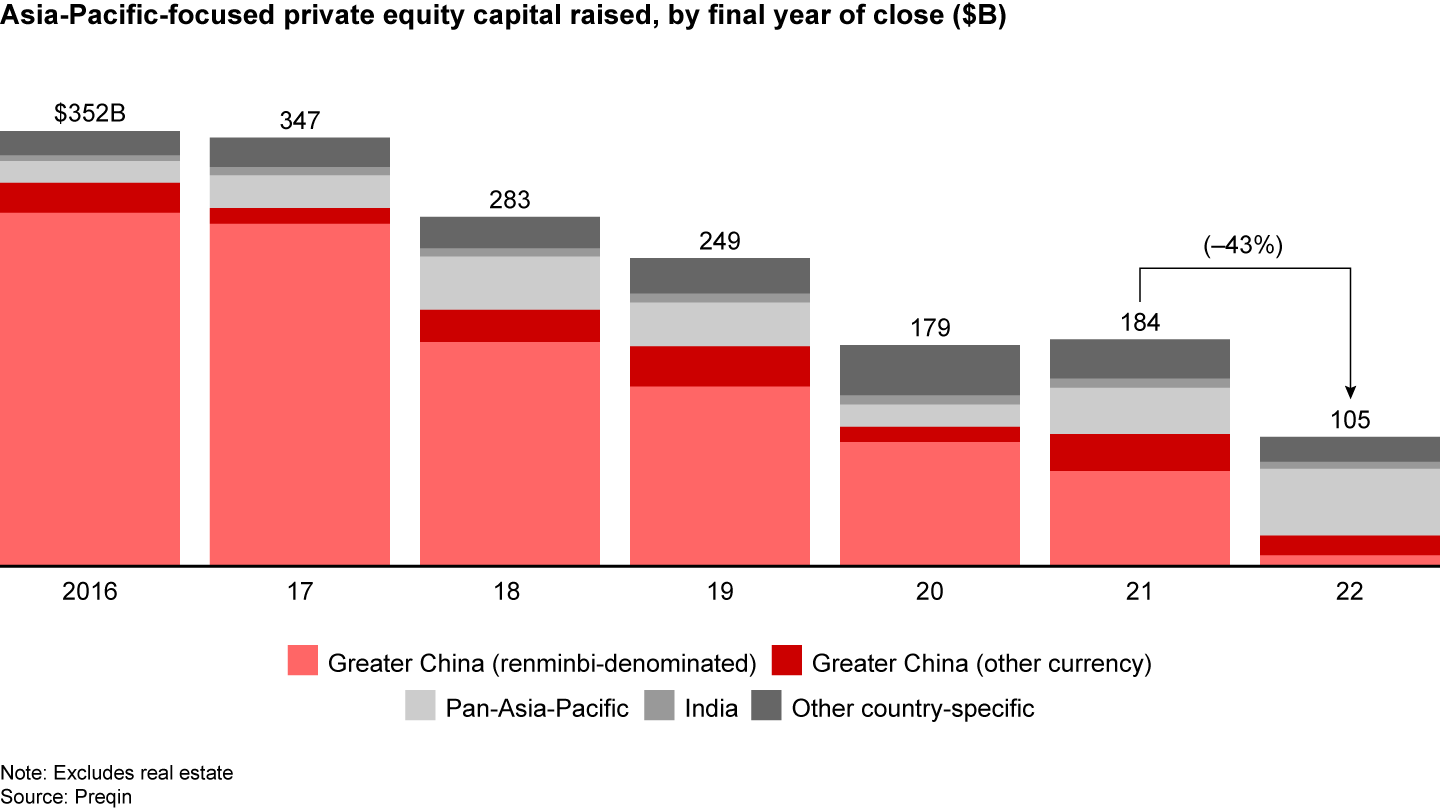
Turbulent market conditions and uncertainty pushed less-competitive investors to the sidelines in 2022. The number of active investors dipped 2%, the first decline since 2015. The top 20 investors accounted for 32% of deal value, up slightly. Fund-raising also suffered. The total capital raised by Asia-Pacific-focused funds fell 43% to $105 billion, and on average, GPs needed more time to close new funds. However, global and regional flagship funds that have strong track records and local operations were less affected.
Despite a stormy and unpredictable investment climate, Asia-Pacific dry powder—the level of unspent private equity capital—rose to a record $676 billion. Returns of Asia-Pacific-focused funds remained strong, and private equity continued to outperform public markets.
The macroeconomic landscape remains unstable, and higher inflation and weaker growth are likely to have a strong impact on investment choices and portfolio performance in the coming year. The best firms are adapting their strategies and employing scenario planning to identify winners in the right sectors. GPs are also taking a more active role in portfolio management. Nearly one in four GPs say cost improvement is the most important contributor to strong returns, up from only 5% five years ago, and is now second only to topline growth.

What happened in 2022?
After a decade of strong growth and surprising resilience through the first two years of the Covid-19 pandemic, Asia-Pacific’s private equity market took a nosedive in 2022. Amid growing macroeconomic gloom, consumer confidence deteriorated and manufacturing slumped. At the same time, governments tightened credit and public debt rose as currencies depreciated, undermining financial stability. Investors, sensing a new era of slower growth, mounting inflation, and greater uncertainty, took time out to recalibrate their strategies, recognizing that what worked well in the past may not be the right approach for 2023 and beyond (see Figure 2).
A couple of developments highlight the sobering economic shift for private equity investors. China’s GDP growth dropped to 3% in 2022, down sharply from an annual rate of about 7% during the last decade, and the largest GDP slowdown in the region. Covid lockdowns contributed to sluggish domestic consumption; China’s Consumer Confidence Index dropped by 28% on average from April to November 2022, compared with the year-earlier average. Both India and Southeast Asia reported robust economic growth, but high inflation. Australia’s Consumer Price Index rose by a record 7.8% in the fourth quarter of 2022. Japan and South Korea struggled with sharp currency depreciation in 2022—20% and 13%, respectively—against the US dollar over the previous year.
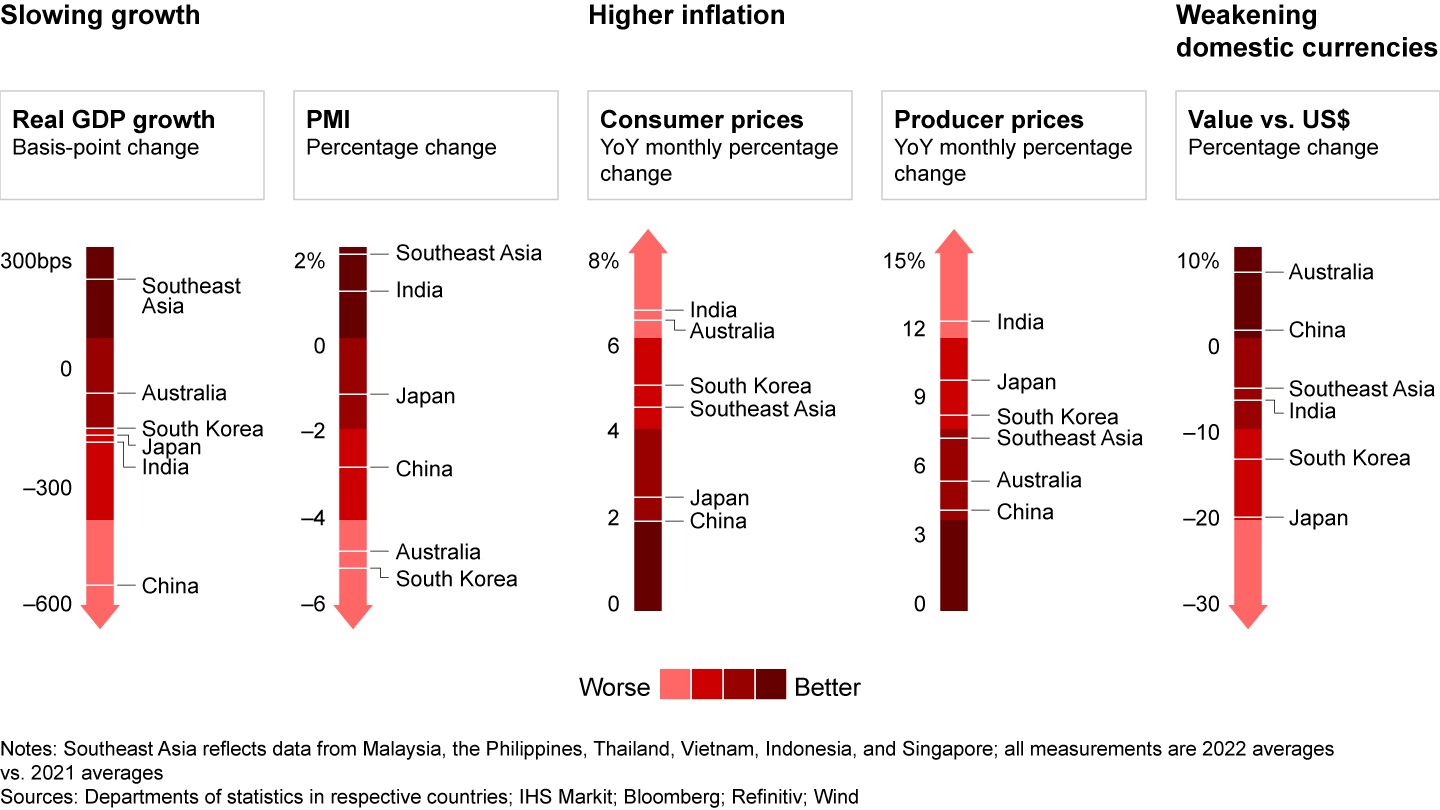
Let’s review for a minute some of the macroeconomic and political factors that contributed most to market turbulence in 2022 and will affect the region’s growth prospects in the coming year.
- Ukraine crisis. Sanctions on Russian exports disrupted the global supply chain, especially in energy. Spiking commodity prices triggered global inflation.
- Tightening credit. The US Federal Reserve Bank increased its benchmark interest rates sharply in the second half of 2022 to battle inflation. Tighter liquidity prompted a global capital outflow to the US, which led to currency depreciation and financial market instability in Asia-Pacific countries. India’s consumer and producer prices in 2022 rose sharply over the previous-year average, and manufacturers passed higher prices to consumers. The central banks of India and South Korea accelerated interest rate increases to address inflation. In Australia, rising interest rates depressed the housing market. Sales of established homes and attached dwellings fell by 18% on average in the first nine months of 2022, compared with the same year-earlier period. Japan’s high debt ratio, combined with a significantly depreciated yen, could trigger financial instability.
- Sino-US decoupling. Worsening geopolitical tensions between China and the US led the US to impose additional trade restrictions on selected sectors, curbing China’s growth and further depressing the sales of companies relying on exports to the US and other Western markets.
- Loosening of Covid-19 restrictions. Lockdowns and other curbs to limit the spread of disease severely interrupted China’s economy and disrupted supply chains and other economic activities throughout the region. Chinese fund managers’ top concerns for the coming year are the short- and long-term impact of Covid policy, Sino-US decoupling, and the effect of those two factors on manufacturing activities and domestic consumption.
- Labor shortage. A record level of job vacancies throughout the Asia-Pacific region curbed economic growth. Covid-19 and the structural shortage of skilled workers exacerbated the deficit. Australia was among the worst hit, with job vacancies on average 122% higher in 2022 than in 2020.
Deals: a dramatic fall
After two years of growth, Asia-Pacific deal value plunged in 2022 to $198 billion, down 44% from a year earlier and 9% below the previous five-year average (see Figure 3). Deals were fewer in number and smaller in size. Depreciating currencies also diminished the average deal size in US dollars.

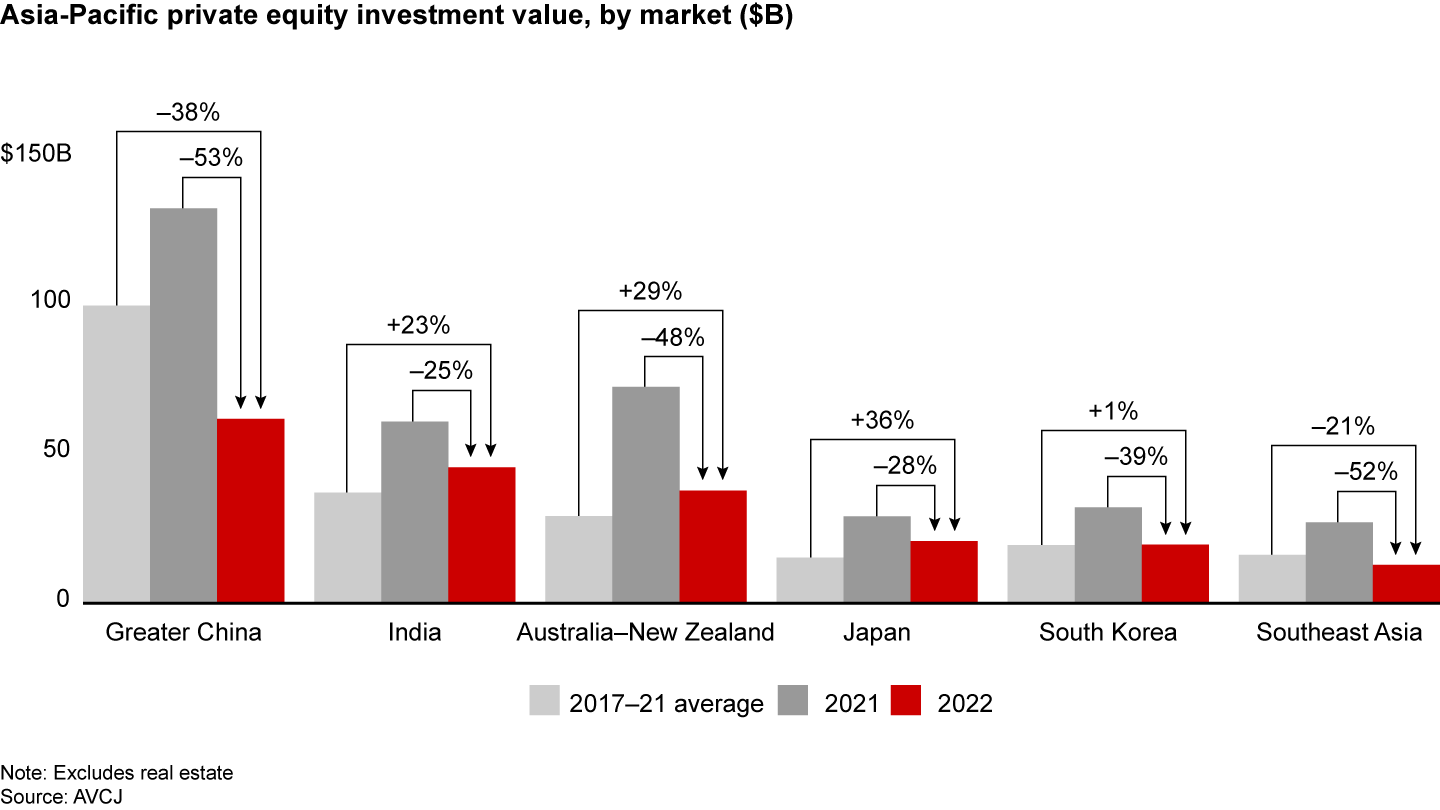
The smaller average size of deals reduced deal value in Australia–New Zealand (–48%), Japan (–28%), Southeast Asia (–52%), and India (–25%). By contrast, a sharp drop in deal volume depressed deal value year-on-year in Greater China (–53%) and South Korea (–39%). In Japan and Korea, exchange-rate fluctuations were responsible for 50% of the reduction in average deal size.
During the first half of the year, deal activity was roughly on par with 2021, but as market uncertainties multiplied, deal value in the second half plunged 66% from the year-earlier period. A deteriorating macroeconomic outlook, higher financing costs, and worsening company performance all reduced GPs’ appetite for risk.
Nearly one-third of the respondents to our 2023 survey said macroeconomic conditions significantly or severely reduced deal activity. In China, that figure rose to 66% of GPs. Looking ahead, the pressure on dealmaking isn’t likely to dissipate soon. More than 50% of fund managers expect the negative trend to continue into 2024.
Deal value fell sharply in every Asia-Pacific market in 2022, with the declines ranging from 25% to 53% (see Figures 4 and 5). Greater China’s share of the region’s total deal value plummeted to 31%, a nine-year low, while India increased its share to 23%. Greater China’s deal value shrank 53%—more than any other Asia-Pacific market—as investors grappled with uncertainties related to the government’s zero-Covid policy, political tensions, and tech regulatory crackdowns. The average deal size in Australia–New Zealand fell 57%.
Growth deals continued to outpace buyouts in 2022, producing 54% of deal value, up from 50% in 2021 (see Figure 6). However, the total value of large growth deals of $200 million or more fell 45% in 2022, compared with the previous year. Deal value for this category of big-ticket transactions had risen nearly every year since 2014.
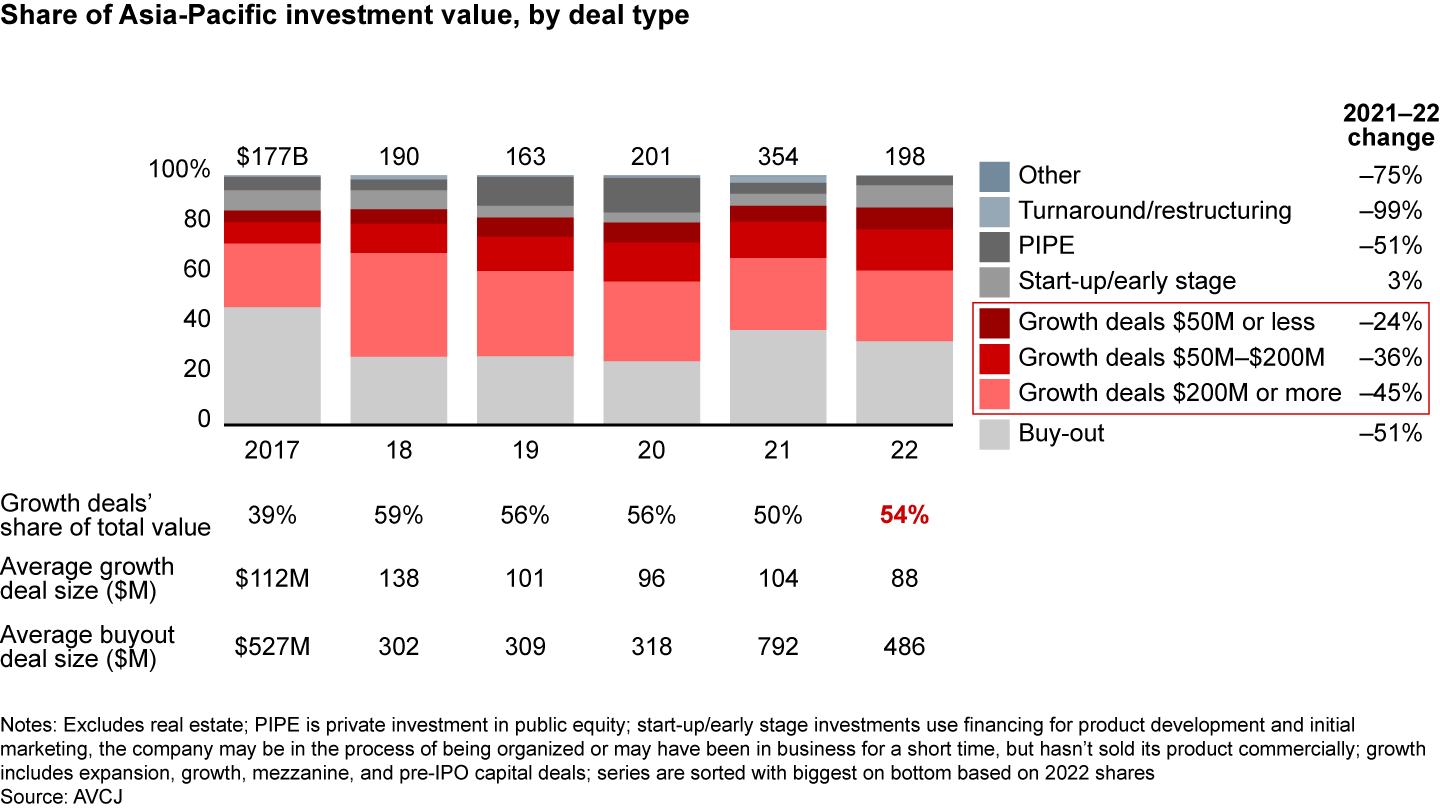
Investors’ shrinking appetite for risk sharply reduced the number of large growth deals in Greater China and India. Together, Greater China and India accounted for a $35 billion decline in total deal value for big-ticket growth deals in 2022.
Another factor that depressed growth deals was the dramatic drop in the value of technology companies on public stock markets, which affected private markets, creating valuation mismatches and complicating or hindering the completion of mid- to late-stage tech deals.
By contrast, start-up and early-stage deal value grew 3% year-on-year.
The average size of buyouts and growth deals declined year-on-year to $486 million and $88 million, respectively (down 39% and 15%). The average size of growth deals dropped to the lowest level since 2015.
In Asia-Pacific countries where growth deals dominate the market, Greater China’s share of growth deals rose to 74% of total China deal value, up from 67% a year earlier, while India’s share decreased to 67% of total India deal value, from 70% in 2021 (see Figure 7). South Korea’s share of growth deals fell to 46% from 53%, and Southeast Asia’s fell to 63% from 68%.

In those countries where buyouts dominate the market, Australia–New Zealand’s share of buyouts fell to 70% of deal value from 90%, as the number of megadeals declined, deal count dropped, and investors sought smaller buyouts. No 2022 deal in Australia–New Zealand was larger than $10 billion, and the average buyout size fell to about $600 million. By contrast, a year earlier, the two countries produced two large deals over $10 billion (Sydney Airport Holdings $22 billion; AusNet Services $13 billion), and the average buyout deal size was $1.9 billion.
Japan’s share of buyouts fell year-on-year to 76% from 85%. The country generated 21 buyouts in 2022, and the average deal size fell to $750 million. By contrast, Japan generated 28 buyouts in 2021, with an average deal size of nearly $900 million. In all markets where buyouts dominate, the rising cost of deal financing was a key factor depressing the number of buyouts, as central banks tightened credit, interest rates rose, and liquidity shrank.
Carve-outs were again an important buyout theme in 2022, especially in Japan and South Korea, where a challenging economic environment prompted conglomerates to focus on their core businesses and sell noncore operations. Some of the largest carve-out deals in 2022 include the sale of Hitachi Transport System to KKR ($6.1 billion), Olympus Corp.’s sale of Evident Corp. to Bain Capital ($3.1 billion), and SK Group’s sale of SKC Plastics to Hahn & Co. ($1.3 billion).
Sector view: Internet and tech out in front
For more than a decade, the Internet and tech sector has attracted the largest share of private equity capital in the Asia-Pacific region. However, its share of deal value dipped in 2022 to 33% from 41% the previous year (see Figure 8). That decline was due primarily to fewer and smaller deals in China and India. Internet and tech deal value for the two large tech-focused markets fell $65 billion, compared with 2021.
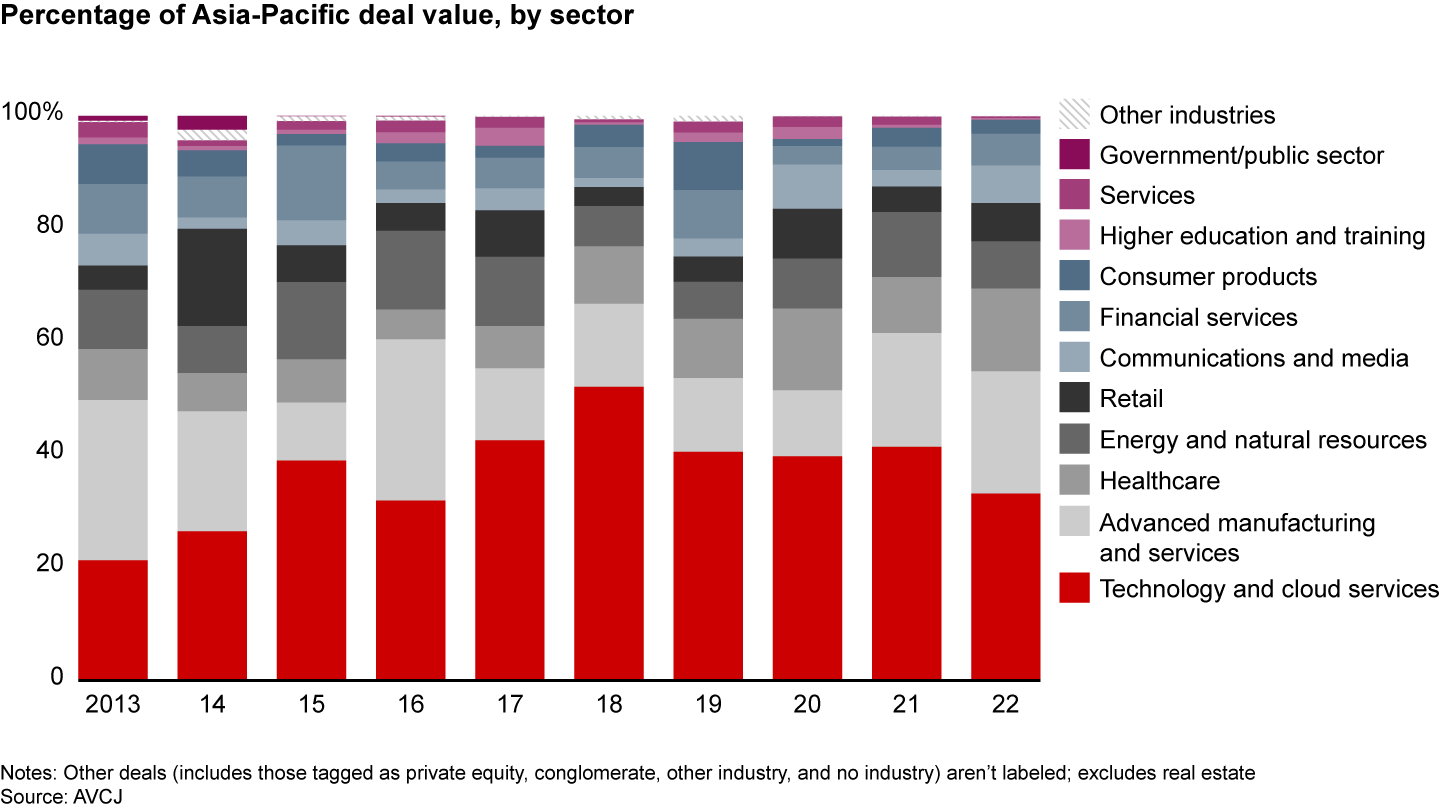
Within the Internet and tech sector, cloud services remained the largest subsector in deal value, but its share decreased to 41%, down from 55% a year earlier. Among cloud services, consumer tech businesses such as e-commerce and online services took the hardest hit, with deal value dropping by 68% and 76%, respectively, from the previous year.
The traditional strongholds for Internet and tech deals—Greater China, India, and Southeast Asia—all experienced sharp declines. Greater China’s Internet and tech deal value fell 62% year-on-year, led by the cloud services (down 88%) and software (59%) subsectors. India’s and Southeast Asia’s dropped by 52% and 49%, respectively.
Advanced manufacturing and energy and resources were the only sectors that had more deals in 2022. That shift reflected investors’ preference for companies with a low-risk profile that generate steady cash flow. At the same time, government demand for private capital investment to develop and upgrade critical infrastructure including utilities, telecommunications, and transportation remains strong, especially in Southeast Asia and India.
Advanced manufacturing’s largest subsector, logistics and transport, represented 32% of deal value, down from 60% a year earlier. The sale of Hitachi Transport System for $6.1 billion was the largest deal. Several megadeals lifted the second-largest subsector, automotive and mobility, to 28% of deal value, more than doubling its relative share. They included the sale of GAC Aion ($2.5 billion) and Sunwoda Electric Vehicle Battery ($1.2 billion).
In the energy and natural resources sector, investments in utilities and renewables made up 60% of deal value, reflecting the rise of environmental, social, and corporate governance (ESG) considerations as an investment priority. The number of utilities and renewables deals rose 47% year-on-year, with an investment in Macquarie Group’s offshore wind unit exceeding $1 billion.
The growing embrace of ESG considerations has boosted interest in renewable energy companies in particular. Half of the GPs we surveyed plan to significantly increase their effort and focus on ESG in the next three to five years, up from 30% three year ago.
Competition eases
Tough market conditions pushed some investors to the sidelines in 2022. The number of active investors in the Asia-Pacific region fell 2% year-on-year, the first drop since 2015 (see Figure 9). The largest decline was in the number of institutional investors, which fell 15%.
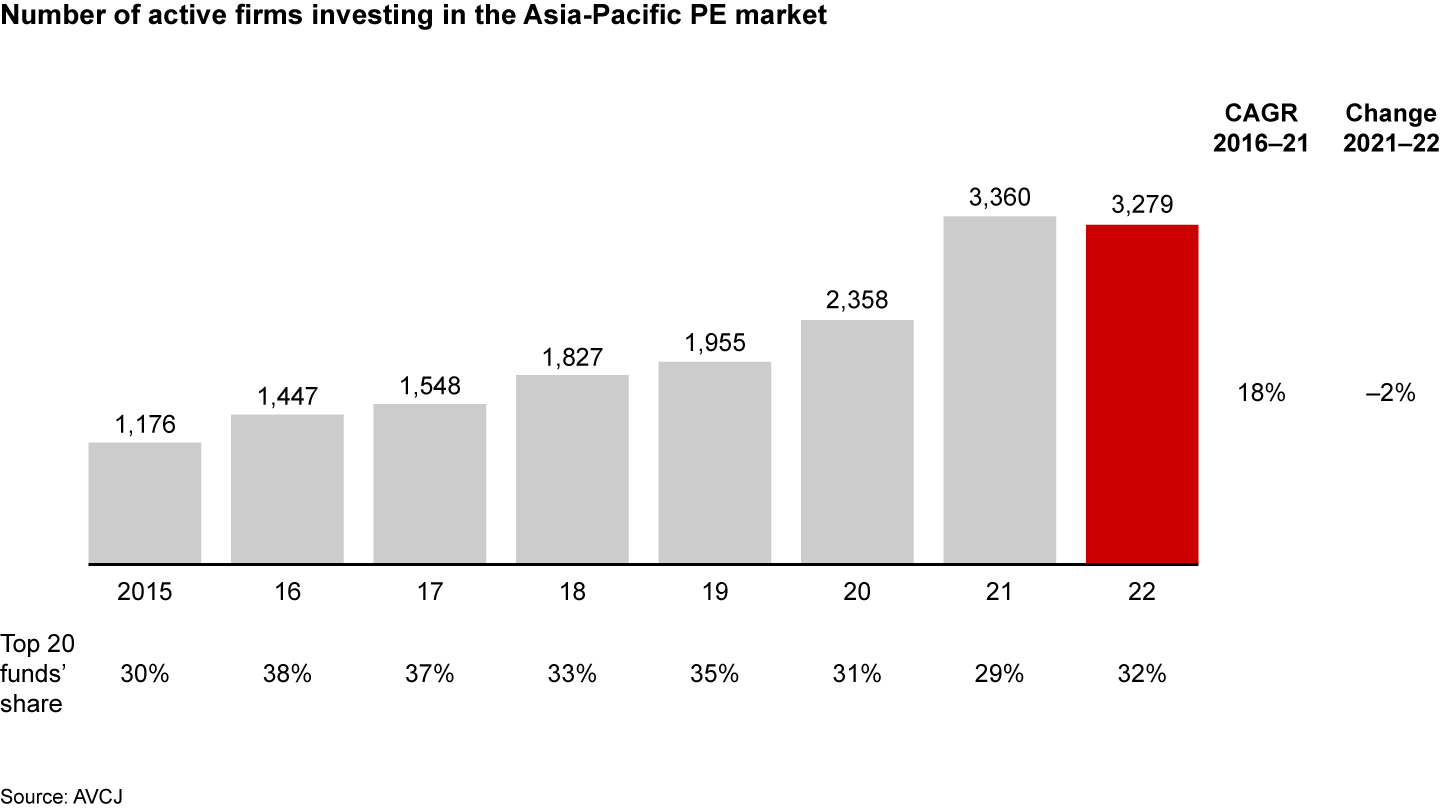
Deal value remained relatively concentrated among top funds. The share of deal value contributed by the region’s top 20 funds increased slightly to 32%. Aided by the merger of two large funds, Baring Private Equity Asia and EQT, global GPs continue to expand their presence in the region, and big funds often have an edge identifying deals and raising capital.
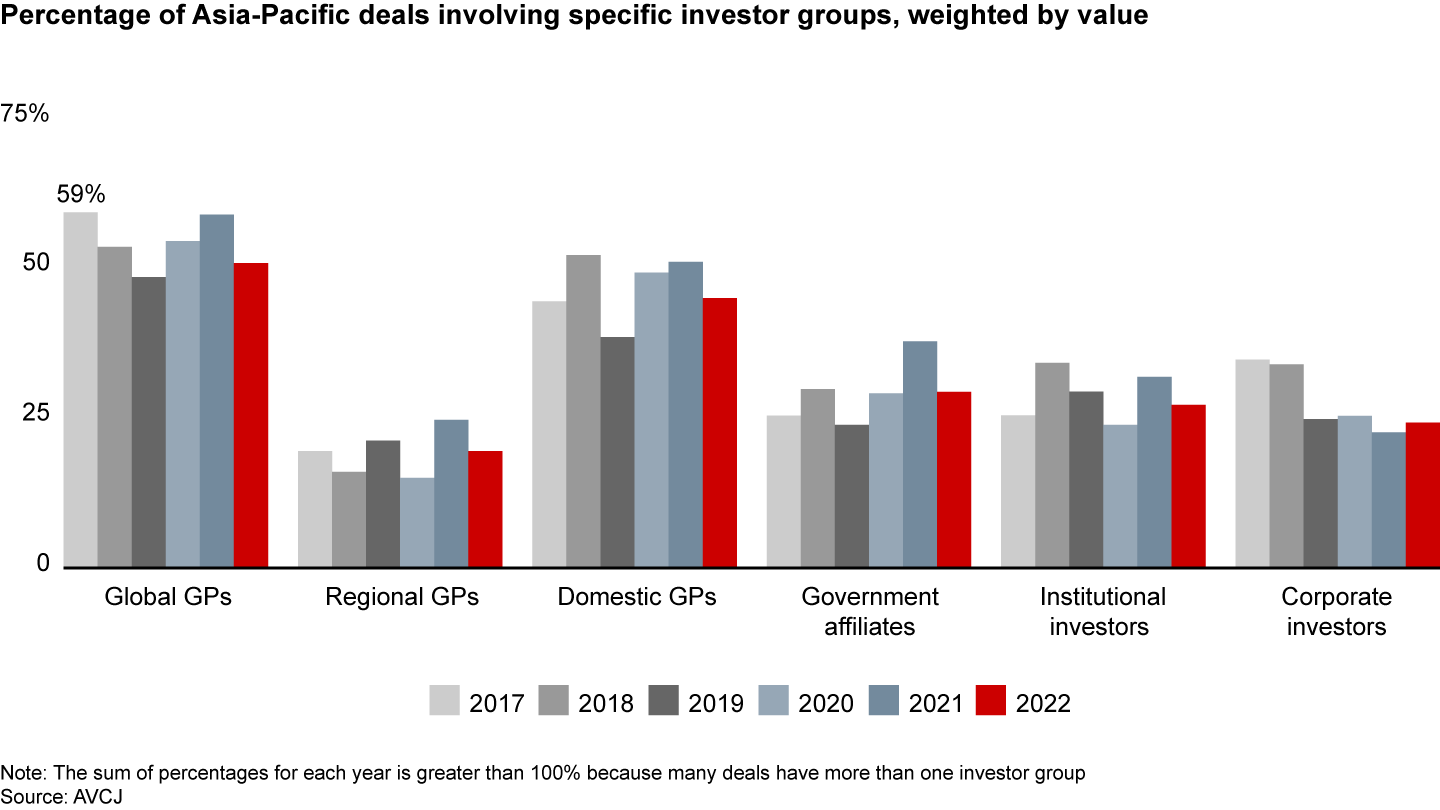
Global GPs and domestic GPs continue to be the largest investor groups, based on deal value. The share of corporate investors rose slightly in 2022 (see Figure 10).
Multiples slide
Deal multiples—the ratio of enterprise value to EBIDTA—declined to 12 from 13.1 a year earlier (see Figure 11). Several factors contributed to the reversal, the first since 2019, when multiples fell to 10. The rerating of companies listed on public markets typically has a knock-on effect, diminishing the multiples of portfolio companies. A second factor is deteriorating company performance in a tougher economic landscape. The multiples of growth companies also may decline as investors in an uncertain market seek more defensive investments, such as companies with strong cash flow and dependable profits. Finally, the Internet and tech sector, which typically contributes to high valuations, shrank in 2022 as a share of overall deal value.
If the conditions—macroeconomic uncertainty, poor company performance, and a decline in deal activity—that prevailed in 2022 persist, valuations may continue to contract as fund managers adopt a wait-and-see attitude. Sixty-nine percent of the fund managers we surveyed expect valuations to continue declining through 2024.
Exits plummet
Following a record year for Asia-Pacific exits in 2021, exit value plunged back to earth, falling 33% year-on-year to $132 billion, 1% below the previous five-year average (see Figure 12). Three key factors deterred GPs from selling: a significant rerating of public market valuations, fewer avenues for exits given the decline in IPOs, and deteriorating portfolio performance.
The average exit value declined 14% to $256 million in 2022, down 8% from the previous five-year average. Nearly 50% of the GPs we surveyed said the 2022 Asia-Pacific exit environment was “far more challenging,” while 82% applied that label to Greater China’s exit market. The top three reasons GPs cited for suboptimal exit opportunities were IPO market underperformance (73%), macroeconomic softness (60%), and multiple compression (50%).
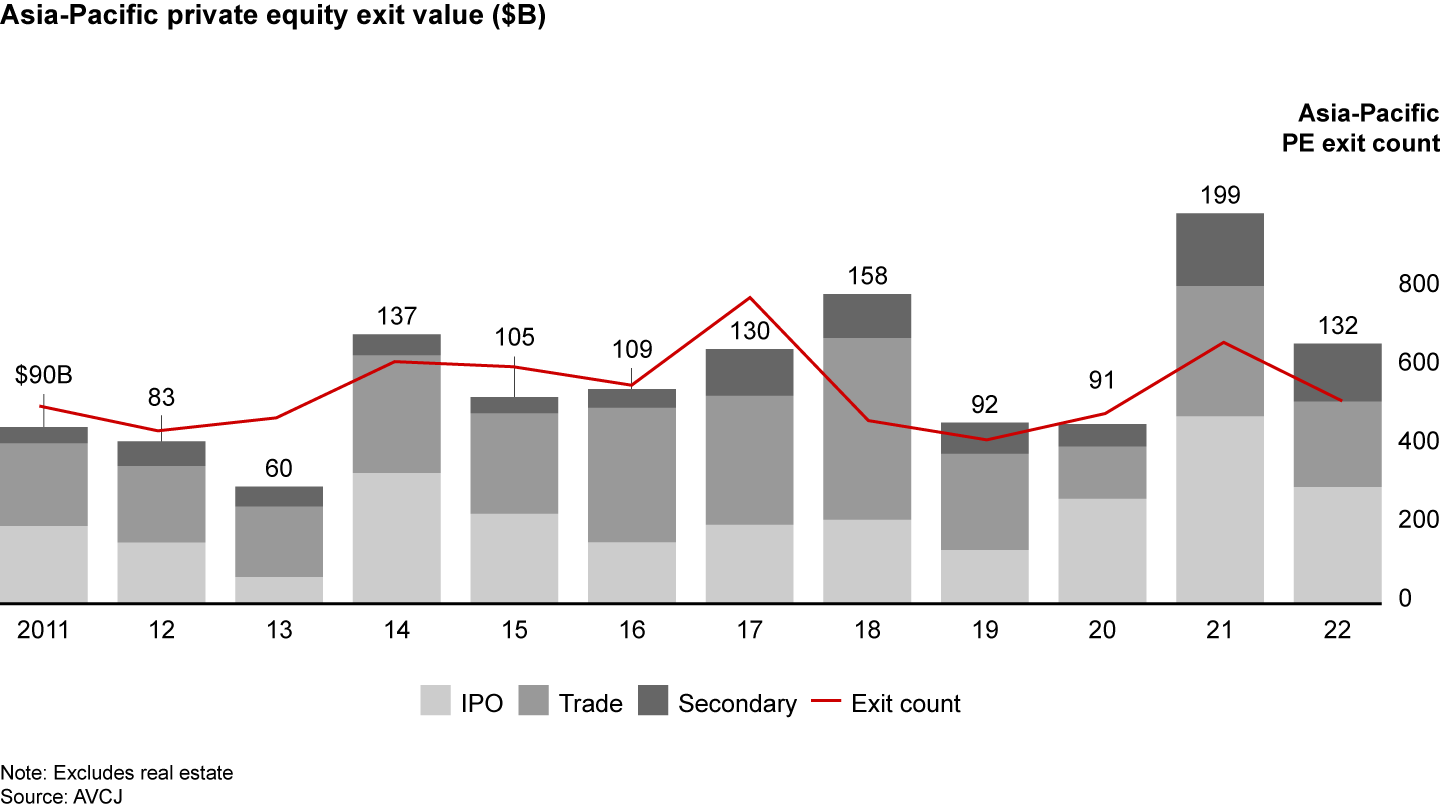
Initial public offerings (IPOs) remained the primary channel of exit, accounting for 45% of the exit market, down slightly from the previous year. Trade sales represented 33%, unchanged from 2021. And secondary deals grew to 22% of the market, up from 19% a year earlier.
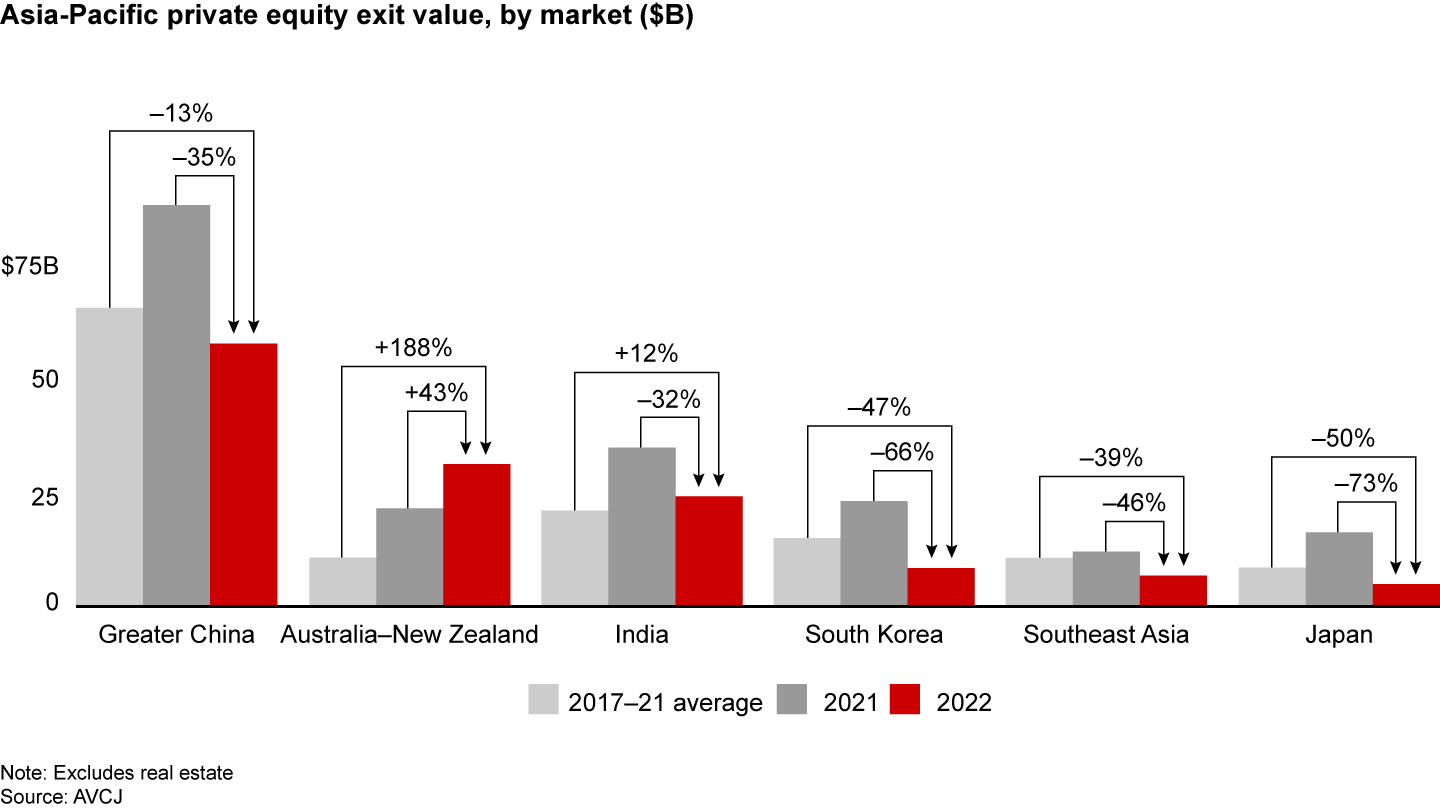
Exit value declined sharply in most Asia-Pacific markets, except for Australia–New Zealand (see Figure 13.) Buoyed by nine blockbuster exits worth more than $1 billion, exit value in these two countries rose 43%. Those blockbuster exits included six secondary deals and three trade deals.
Renewable energy-related sales accounted for 60% of deal value for transactions over $1 billion in Australia and New Zealand. The Ukraine crisis and growing commitment to ESG fueled strong investor interest in renewable energy companies in 2022.
South Korea and Japan recorded the largest declines in exit value. Currency depreciation undercut companies’ performance and diminished GPs’ interest in exits. A sluggish stock market added to the exit gloom. Korea’s KOSPI fell almost 20% in 2022. In Greater China, exit value slumped to the lowest level in three years. Exit value decreased 32% in India from 2021.
Greater China’s share of exit value dropped to 44%, compared with a previous five-year average of 50%. India’s share remained consistent at 18%. South Korea, Southeast Asia, and Japan all lost share in 2022, while Australia–New Zealand increased its share to 24% (see Figure 14).

Public stock market listings remained the top channel for exit. But a gloomy and uncertain economy overshadowed IPOs. The exit value for IPOs decreased by 38% year-on-year. China accounted for 89% of the region’s IPO exit value, the largest share since 2012. India ranked No. 2, with a share of only 6%.
The US eased restrictions imposed in 2021 on Chinese IPOs on US exchanges, paving the way for 18 Chinese companies to list in the US in 2022. However, the viability of listing Chinese companies on US exchanges remains uncertain and vulnerable to geopolitical tensions.
The Internet and tech sector is the largest in terms of Asia-Pacific IPO exit value and has held that position since 2017. In 2022, it accounted for 42% share, down from 48% year-on-year. Healthcare and advanced manufacturing were No. 2 and No. 3 in IPO exit value, with 19% and 18%, respectively, both up from 15% a year earlier.
Fund-raising plunges
After a sharp rise in 2021, global fund-raising activity declined 8% in 2022 (see Figure 15). The share of Asia-Pacific-focused funds fell to 10% in 2022 from 16% a year earlier.
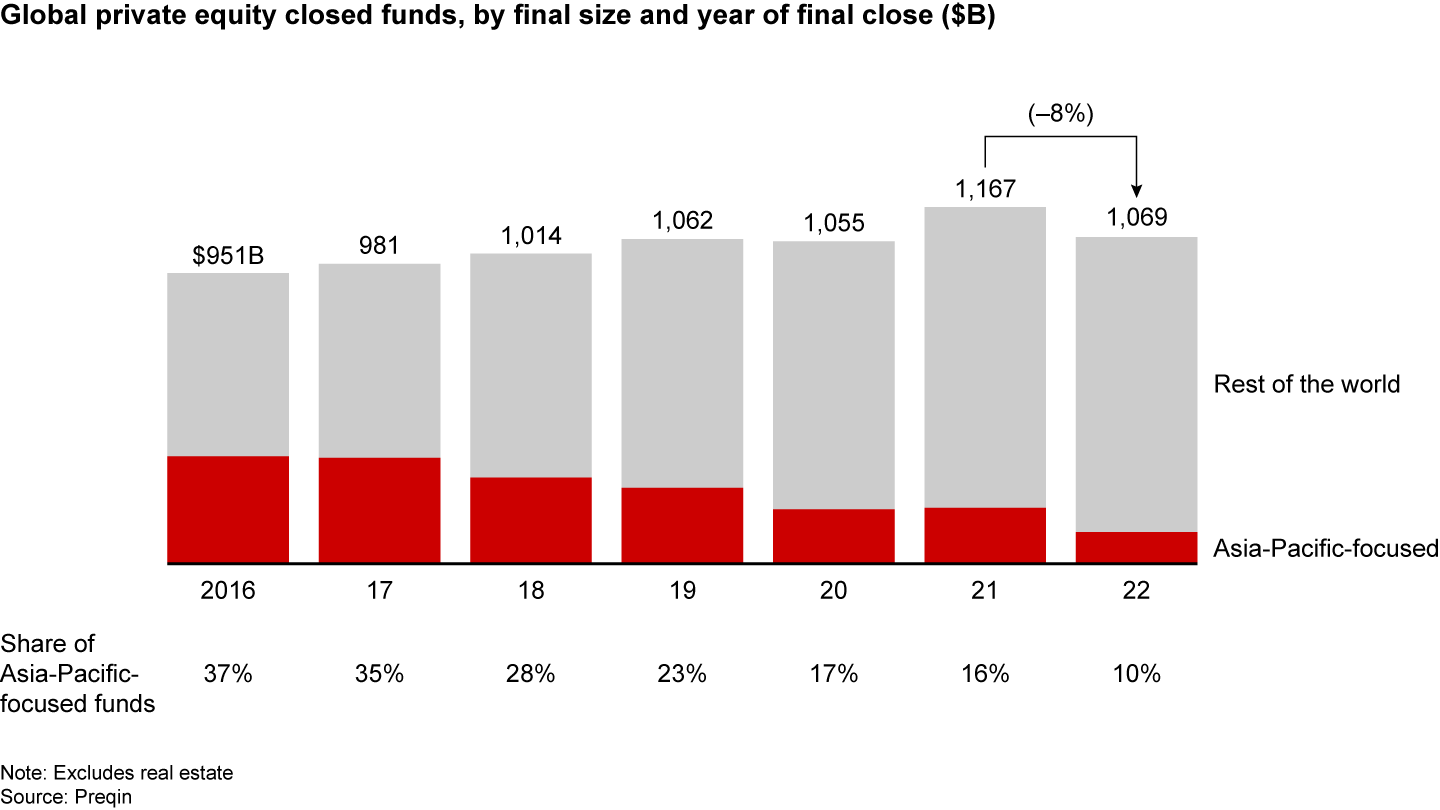
By comparison, Asia-Pacific fund-raising slumped even more dramatically. Asia-Pacific-focused-funds raised $105 billion in 2022, down 43% year-on-year and 70% below their 2016 peak (see Figure 16).
Four out of five GPs said 2022 fund-raising was “very challenging” or “somewhat more challenging” than in 2021, according to our survey. More than three-quarters said fund-raising in China was “very challenging,” and 56% characterized Southeast Asia’s environment the same way.
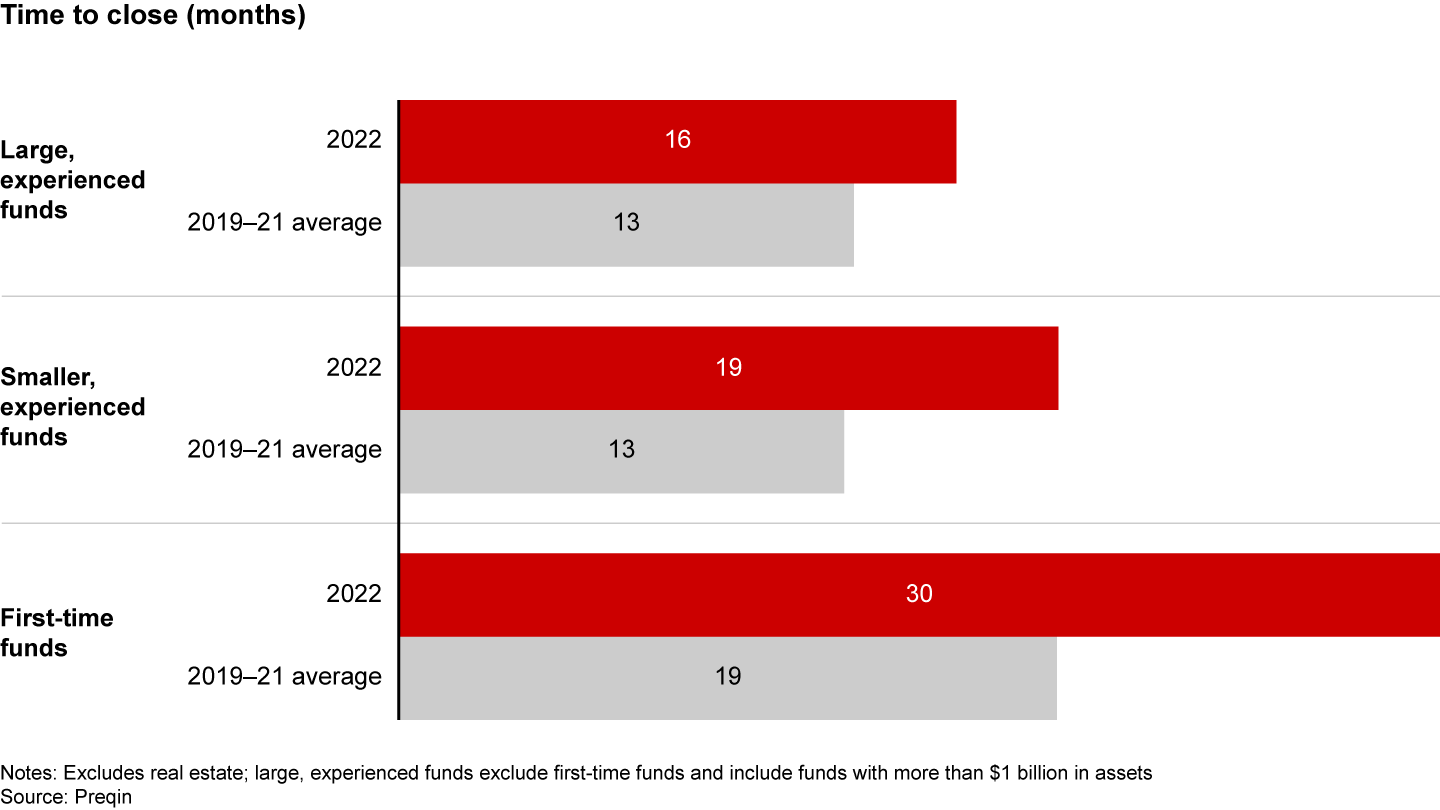
Funds of all sizes and levels of experience needed more time to close funds in 2022 (see Figure 17).
The increase in average time on the road for Asia-Pacific-focused funds, especially smaller and first-time funds, underscored limited partners’ (LPs) preference for funds with an established track record. Funds that had the least difficulty closing were those with differentiated strategies and realistic expectations.
Three key factors contributed to a challenging fund-raising environment. The first was a dismal economic outlook that includes rising inflation and a strong US dollar, which reduced LPs’ appetite for risk. GPs we surveyed said the most challenging aspect of fund-raising was LPs’ decision to reduce their relative allocations for the Asia-Pacific region.
A second factor was the reduced distribution of capital back to LPs, resulting from fewer exits and depressed IPO markets throughout the region. Third, many LPs have allocation restrictions or caps on the share of funds allocated to private equity. With public markets down significantly, private equity holdings account for a higher percentage of LP portfolios, limiting their ability to allocate new funds to private equity.
Fund-raising declined in most Asia-Pacific markets in 2022, with the sharpest drop affecting funds focused on Greater China. Bucking that trend, Australia–New Zealand recorded an 80% increase in private equity capital raised.
Greater China’s share of total Asia-Pacific funds raised shrunk to 24%, a 15-year low. The share of private equity raised by Australia-New Zealand, Japan, and India rose to 7%, 6%, and 5%, respectively. The increase in share for these three countries reflects greater LP capital allocation to alternative markets following the flight of foreign capital from China.
By contrast, private equity raised by pan-Asia-Pacific funds increased 44% year-on-year. The share of pan-Asia-Pacific funds rose to 52%, a 22-year high. Instead of betting on specific country funds, LPs chose to reduce risk by betting on the region. Bain Capital Special Situations Asia II fund raised $2.1 billion, and KKR’s Asia Credit Opportunities Fund raised $1.1 billion.
In a key shift, Greater China-focused funds raised only $25 billion, a 77% decline from the previous year. That contraction pushed Greater China’s share of Asia-Pacific-focused funds to 24%, down from 58% a year earlier. One reason was foreign LPs’ sharply diminished interest in China given the country’s uncertain economic outlook and US-China geopolitical tensions (see Figure 18).

Regulations limiting foreign investment also curbed investor interest in Greater China-focused funds. The latest version of China’s Foreign Investment Negative List went into effect on January 1, 2022. Although the list was shorter than a previous draft, it still strictly regulates more than 30 products or subsectors (including critical infrastructure, airports, telecommunications, and rare earth mining).
The number of Asia-Pacific-focused funds closed in 2022 fell to 352, down 59% from the previous year. But the average size of closed funds increased 40% year-on-year (see Figure 19). And a greater percentage of funds managed to raise more than their target. The final size of new funds raised exceeded the target size by an average 21%, up from 2% in 2021.
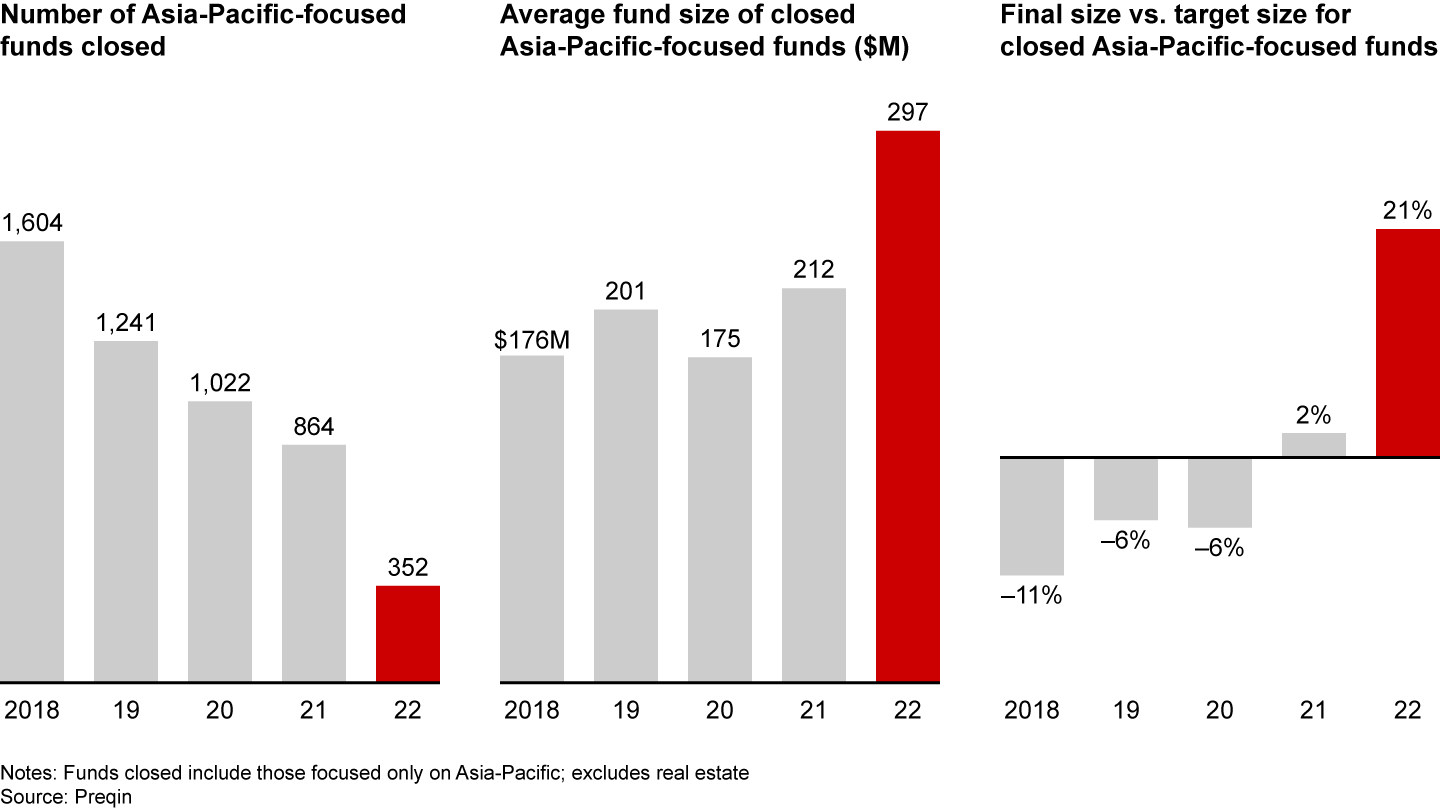
Funds grew larger, in part because of the increase in midsize ($500 million to $1 billion) and large funds ($1 billion to $3 billion) closed in 2022. This trend underscores LPs’ flight-to-quality as they double down on funds with established track records in a competitive fund-raising environment.
The share of midsize funds of total funds raised increased to 19% in 2022 from 16% a year earlier, while the share of large funds rose to 29% from 20%.
Two Asia-Pacific megafunds ($5 billion or larger) closed in 2022: Baring Private Equity Asia Fund VIII ($11.2 billion) and Blackstone Capital Partners Asia II ($11 billion, including a $4.6 billion contribution from Blackstone's global funds). Blackstone closed its Asia II fund in 15 months, quicker than the average 16 months needed for large, experienced funds (over $1 billion), which underscored LPs’ preference for established funds with a solid performance track record.
Dry powder, or total unspent private equity capital, rose to a new high of $676 billion, a 20% increase over the previous year (see Figure 20).
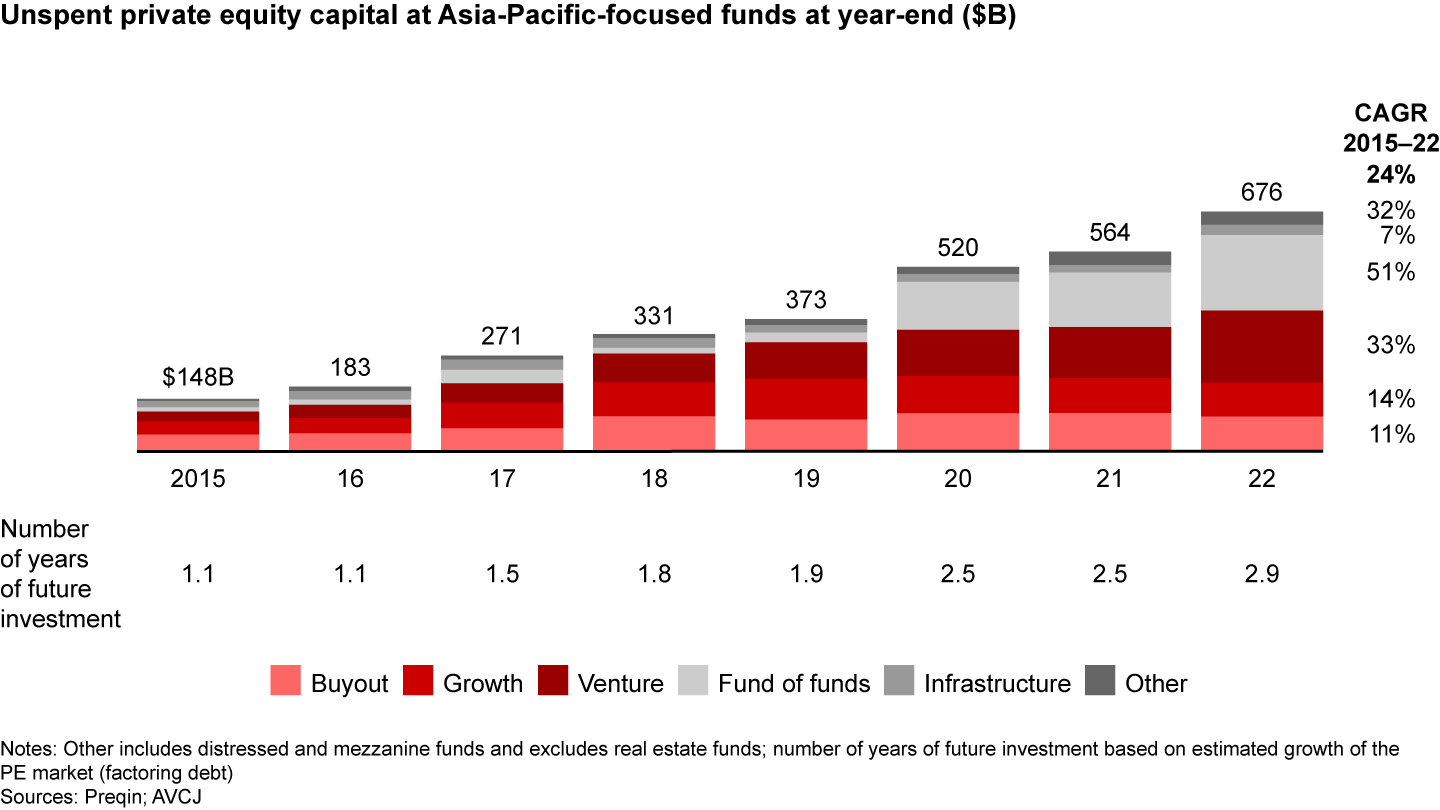
The buildup of dry powder was most pronounced in two types of funds. The share of unspent private equity capital in venture funds and fund of funds increased to 30% and 31% of Asia-Pacific dry powder, respectively, in 2022 from 26% and 27% a year earlier. Fund of funds dry powder has grown at the fastest pace since 2015.
Dry powder at buyout funds and growth funds decreased to $99 billion and $95 billion, respectively (15% and 14% of total dry powder), down from $109 billion and $99 billion in the previous year.
GPs are under pressure to deploy capital, but the uncertain macroeconomic outlook and intense competition for high-quality deals continue to limit investments.
Returns still rising
Despite the sharp drop in dealmaking, exits, and fund-raising, Asia-Pacific PE returns rose to a new high of a 15.0% median net internal rate of return, from 13.9% a year earlier. Top-quartile funds continued to deliver robust returns well above expectations, at 25% median net IRR (see Figure 21).
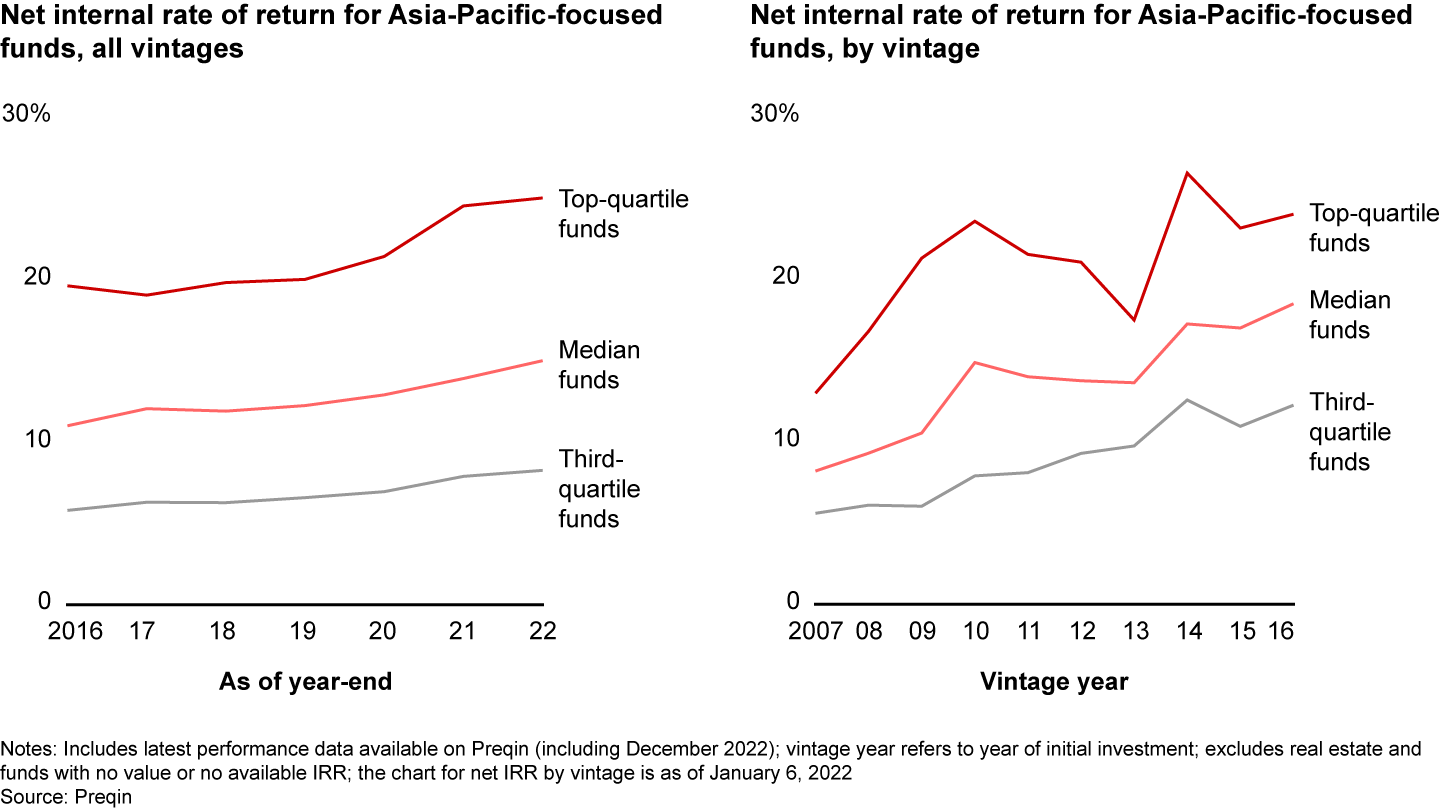
But a turning point may be ahead. More than one-quarter of Asia-Pacific GPs we surveyed expect their net returns to decline in the coming three to five years, due to increasing competition, weakening portfolio performance, fewer exit options, and declining multiples in an uncertain macroenvironment.
Asia-Pacific funds’ net distribution to LPs in 2022 remained positive in the first three quarters of 2022 (see Figure 22). However, the return on public equity declined significantly in 2022, according to Burgiss’ proprietary market index MSCI Asia PME. Private equity continued to outperform public markets across 5-, 10-, and 20-year time periods.

Looking ahead, 49% of the GPs we surveyed said topline growth will be the most important factor for generating strong returns in the next five years, up from 46% five years ago (see Figure 23). Cost improvement will also be critical, given expectations for higher inflation. Our survey showed 23% of GPs expect cost improvement to be the No. 1 factor affecting returns, up from 5% five years ago—the biggest change in sentiment on this question. GPs said multiple expansion and leverage are now less important than five years ago.
Riding out the storm
Looking back in a couple of years, 2022 may seem an obvious turning point for Asia-Pacific private equity investors. After a decade of vigorous growth and two years of resilience in the face of a shifting global economy, most markets succumbed to a worsening macroeconomic storm, rising geopolitical tensions, and ongoing disruptions related to the pandemic. The decade ahead will be less stable and less certain than the previous one. But change brings new opportunities. Successful funds already are adapting their investment strategies to a new era and building the skills to improve portfolio performance.

Smart investing in a downturn
The macroenvironment for private equity investors in the Asia-Pacific region this year remains difficult and uncertain. But economic downturns also create an opportunity to outperform. The best PE funds follow a few key strategies in tough times.
The first is identifying recession-proof sectors and the top-performing companies within those sectors. Next, these funds use scenario planning as a vital tool to understand the range of potential outcomes for targets and portfolio companies. Finally, fund managers roll up their sleeves and help improve portfolio performance.
Although the Asia-Pacific region is one large, dynamic market, macroeconomic uncertainty affects each country differently. Before discussing strategies, let’s first take a high-level view of country-specific outlooks and promising investment opportunities.
China
- The country’s growth rate is likely to accelerate in 2023 as it emerges from a period of Covid-related setbacks and key economic sectors rebound. Despite a strong government commitment to revival, the size of any recovery remains uncertain.
- In the wake of the US-China decoupling, China is focusing on developing the economic potential of its huge internal market to power consumption. The government aims to support key industry sectors, lower barriers for investors, and seek regional trade pacts. As it implements that strategy, consumer confidence and export-based industries are likely to recover.
India
- The country’s large and relatively young population and a growing middle class help increase India’s resilience against global economic headwinds.
- Key investment opportunities include infrastructure of all kinds, especially digital infrastructure. The government’s Gati Shakti plan seeks to overcome long-standing obstacles to integrating and coordinating digital investments nationwide. Education, healthcare, and other services urgently need digital investment, especially in less-developed cities. Rising Internet use also is fueling demand for better digital infrastructure.
Japan
- A weakening yen is good news for Japanese exporters and multinational Japanese firms; overseas sales will generate a higher yen return. At the same time, a weaker yen allows companies to price strategically to capture market share.
- Better corporate governance and increasing acceptance of private equity financing have improved the environment for PE investing in Japan. As a result, the number of carve-outs, corporate restructurings, succession deals, and activist interventions are rising.
South Korea
- Large conglomerates are creating robust demand for private equity through portfolio restructuring, leadership succession, and global expansion. At the same time, many PE funds are seeking exits through secondary sales to other funds.
- A sharp depreciation of the Korean won creates a window for US dollar-dominated funds to pick up acquisitions at attractive prices.
Southeast Asia
- The region’s population of more than 600 million and rising income levels support steady economic growth. Domestic markets such as Indonesia are sizable enough to support large enterprises. Investments in economic development and a steady increase in disposable income will fuel strong domestic consumption.
- Rising geopolitical tensions, increased labor costs in China, and disruption to China’s domestic supply chain have made Southeast Asia, especially Vietnam, an attractive alternative location for global supply chain nodes and manufacturing.
Australia
- Labor shortages are limiting growth in sectors with strong demand, such as healthcare (e.g., hospitals, aged care, diagnostic imaging, primary care) and early childhood education. But companies that improve workforce productivity, for example, in business and industrial services, will be highly attractive as deal activity recovers.
- The Covid-19 pandemic and an aging population create opportunities in healthcare, especially in innovative, flexible, and digitalized healthcare service models. The government is also investing in services for an aging society, including at-home care and residential care homes.
Pre-deal strategies
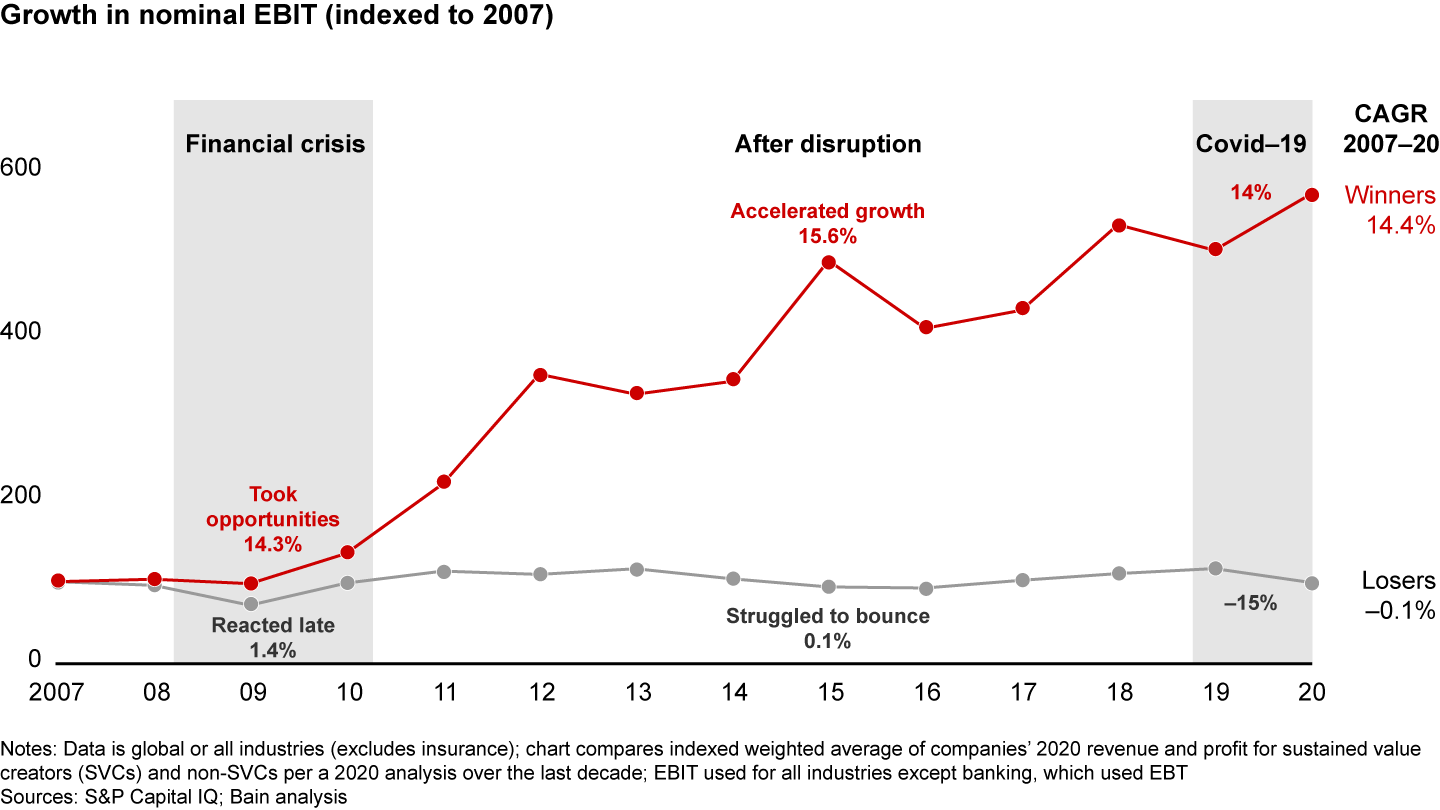
Even in a downturn, companies can accelerate growth and generate superior returns (see Figure 24). The key for PE funds is to identify the right sectors and potential winners in those sectors. Above all, top-performing funds incorporate scenario planning into the diligence process.
In the current macroeconomic climate, attractive sectors in the Asia-Pacific region include healthcare, business services, infrastructure, and technology (see Figure 25).
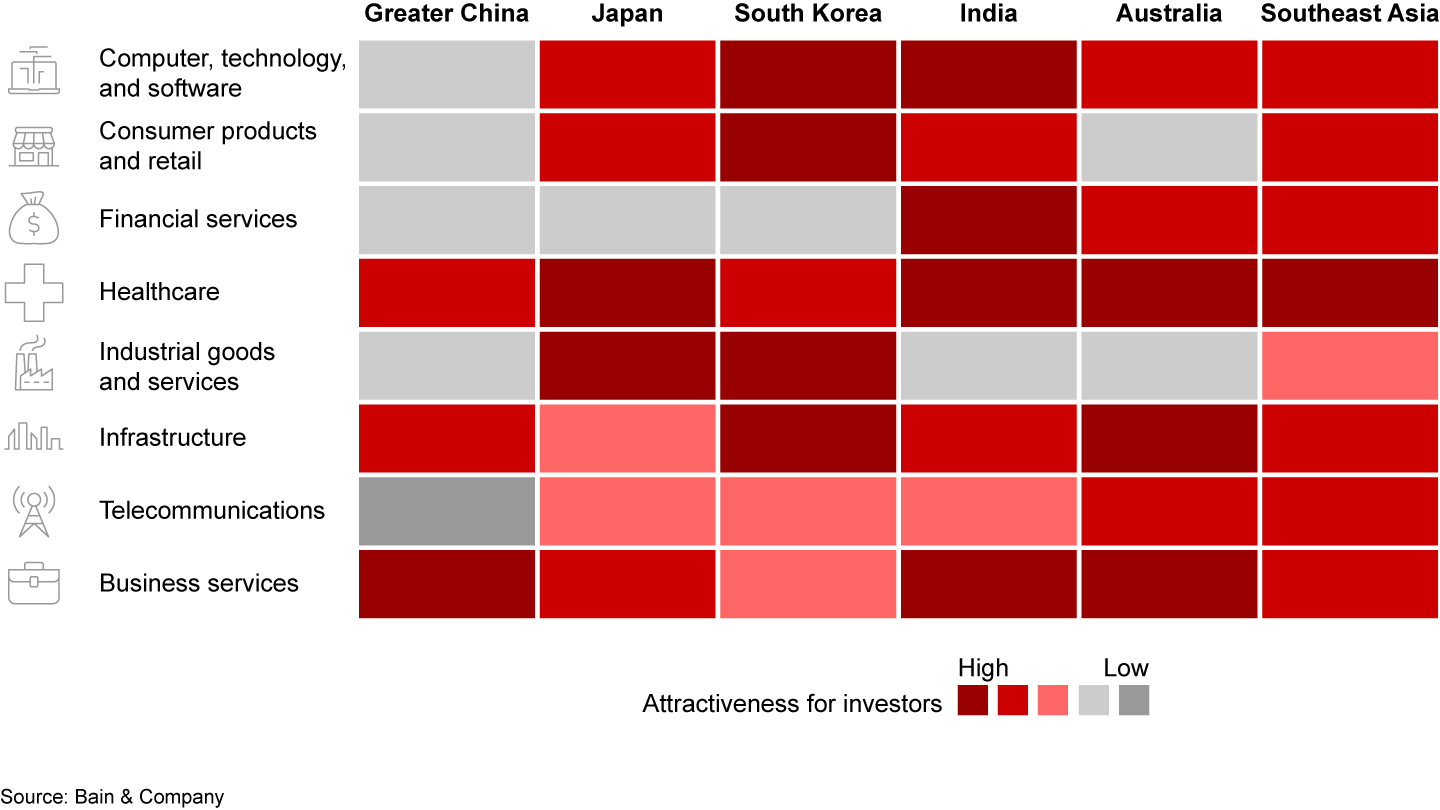
Healthcare. Medical services and pharmaceuticals have been resistant to recessions historically, and structural factors in the Asia-Pacific region, such as an aging population and increasing affluence, continue to support growth in private healthcare services in countries like China and Japan. In Southeast Asia, rising levels of income and broader consumer health awareness also are stimulating the expansion of private healthcare businesses. India’s pharmaceutical services sector will benefit from the China-US decoupling as global pharma companies shift contract research, development, and manufacturing from China to India.
Business services. As companies confront labor shortages, many are turning to outsourcing. That’s creating investment opportunities in business services such as business process outsourcing, facilities management, and industrial and technology services. At the same time, the Ukraine crisis has increased transportation costs and disrupted supply chains, boosting demand for distribution and logistics, such as marine services.
Infrastructure. Market trends in several Asia-Pacific countries are creating attractive investment opportunities in infrastructure. Aging infrastructure, government privatization programs in energy and transportation, and a stable regulatory regime, for example, are encouraging infrastructure investments in Australia and South Korea. The ongoing divestment of infrastructure assets by Korea’s chaebol is also contributing to deal flow. Infrastructure PE deals in both countries have a track record of strong returns.
In all Asia-Pacific markets, the energy transition is creating infrastructure investment opportunities in generation assets such as solar or wind farms as well as logistics, including ports and energy storage. Similarly, government plans to improve and extend digital infrastructure are boosting investment in data centers and 5G networks.
Technology. Asia-Pacific technology and telecommunications companies based outside of China may also benefit from shifting geopolitical winds. The US has already restricted the import of semiconductors, artificial intelligence, big data subsectors, and telecom equipment from China. If restrictions on tech exports from China continue, tech companies in other Asia-Pacific regions are likely to gain a share of that business, especially semiconductor manufacturers in Japan and South Korea.
Spot the winners
Once leading PE firms identify the sectors likely to thrive in a downturn, they choose the companies poised to outperform in their sector. That combination ensures high-quality investments that should outperform through the economic cycle. The good news is that these winners may be available at more attractive prices during a downturn.
Of course, assessing a target’s business fundamentals is even more important in a turbulent economy. Two-thirds (66%) of Asia-Pacific GPs say solid business fundamentals and good cash flow are their top criteria in selecting deals now.
Successful funds also use a set of winning factors and warning beacons to ferret out potential sources of superior outcomes. Bain analysis shows PE deals that outperform have at least one winning factor to counterbalance possible negative macroeconomic developments. These include rapid market growth; organic sales growth in existing stores and rising market share; and expansion into new geographies, products, channels, or adjacent markets. Other winning factors are acquisitions that make a target more competitive, identifiable acquirers that ensure a viable exit strategy, and margin improvement of more than 20% during a five-year holding period.
By contrast, PE deals that significantly underperform investors’ expectations typically possess one or more warning factors. These include an unfavorable change in competitive dynamics, unforeseen or underestimated disruption, and a misunderstood penetration curve. Other red flags are failure to execute a merger or acquisition and unrealistic forecasts for margin improvement.
Scenario planning
In a tough macroeconomic climate, top-performing funds use the due diligence process to assess how a variety of developments could affect a deal, operationally and financially. Inflation, for example, is one critical element in scenario planning. By including a range of inflation rates in market forecasts, investors can better understand how rising inflation can undercut growth.
When inflation is rising, successful funds follow a few key guidelines during due diligence. They start by pressure testing a company’s ability to pass inflation costs to customers and suppliers. Next, they evaluate how inflation might influence a target’s cost structure and how long inflation pressure might last. Just as important, they assess the implications of an increase in working capital and capital spending, a higher cost of capital, and tighter liquidity for cash flow.
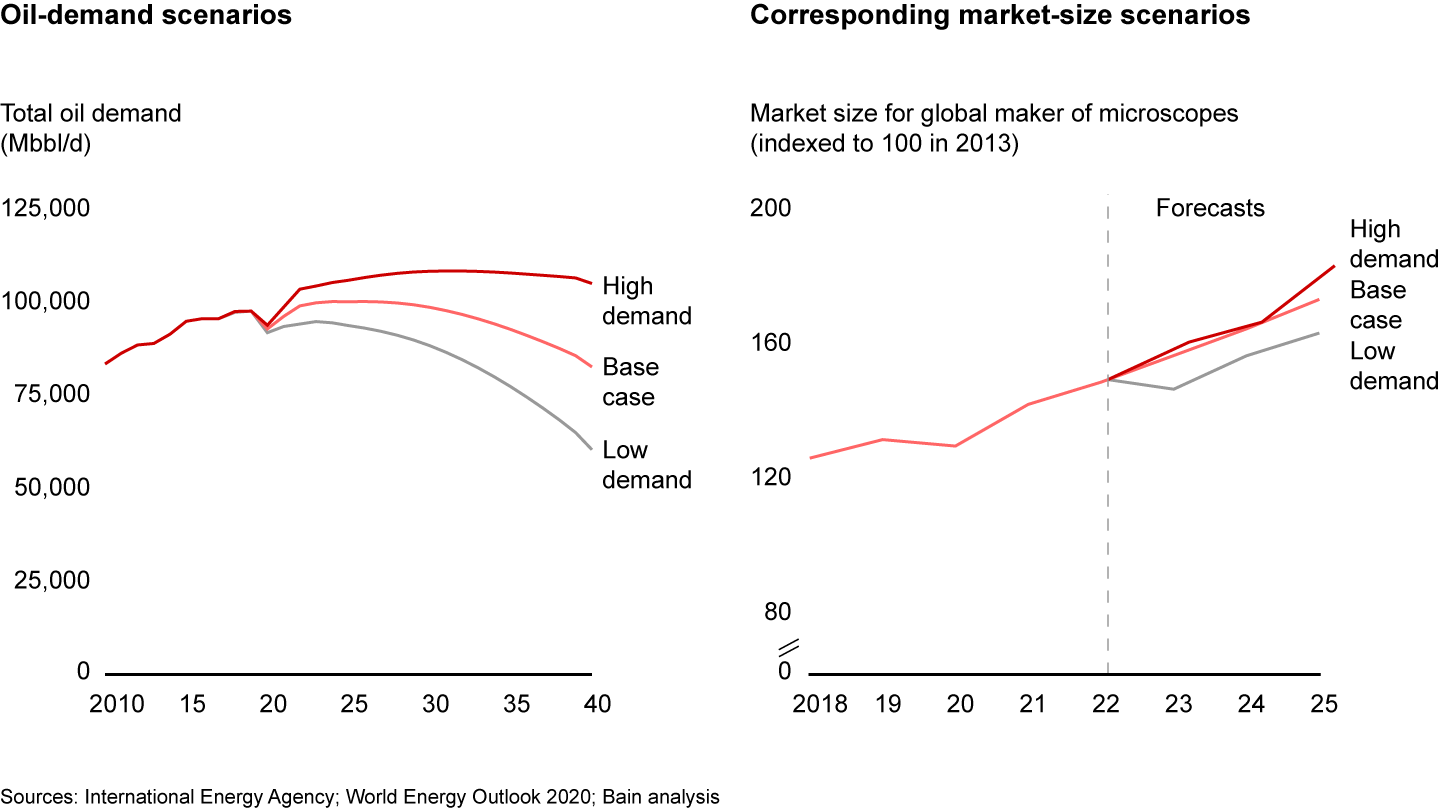
Take the case of a large global PE fund preparing a diligence on a maker of precision microscopes that has key customers in highly cyclical industries such as oil and gas and semiconductors. Given its customer base, the target’s performance is highly dependent on the business cycles of those end markets, which in turn are affected by the macroeconomic environment.
A key step in the fund’s diligence was to model potential demand scenarios for each of the industries the target serves and evaluate the implications on market and revenue forecasts. For the oil and gas end market, the diligence team defined potential scenarios for oil demand (base case, low demand, and high demand), taking into account macroeconomic factors such as global GDP growth and industry-specific factors including the growing number of electric vehicles, demand from plastic production, and plastics recycling. Based on the different scenarios for oil demand, the team calculated three corresponding market forecasts (see Figure 26). That enabled the target to create action plans tailored to low-, medium-, and high-growth scenarios, and to understand the company's best performance potential in each one.
Post-deal strategies
In turbulent times, leading fund managers revisit their portfolio plans. A poor macroeconomic climate may make it prudent to delay exits, for example. Companies suffering from declining multiples or deteriorating business performance are likely to generate lower-than-expected returns. In such a climate, reassessing whether to sell or hold mature assets and creating a clear path with milestones will help achieve targeted returns.
Top-performing funds navigate periods of economic uncertainty by improving the performance of their portfolio companies. Value creation becomes paramount. Leaders know that winning companies with the right strategy can outperform in a downturn, increasing their edge over rivals. Funds that hold certain assets longer than anticipated strive to boost their value in the 18 to 36 months before exit.
Good planning starts with a realistic assessment of a portfolio company’s starting position. That includes its strategic position based on market share, customer loyalty, and other metrics, and its financial position, defined by balance sheet health, cost position, and recession sensitivity (see Figure 27).
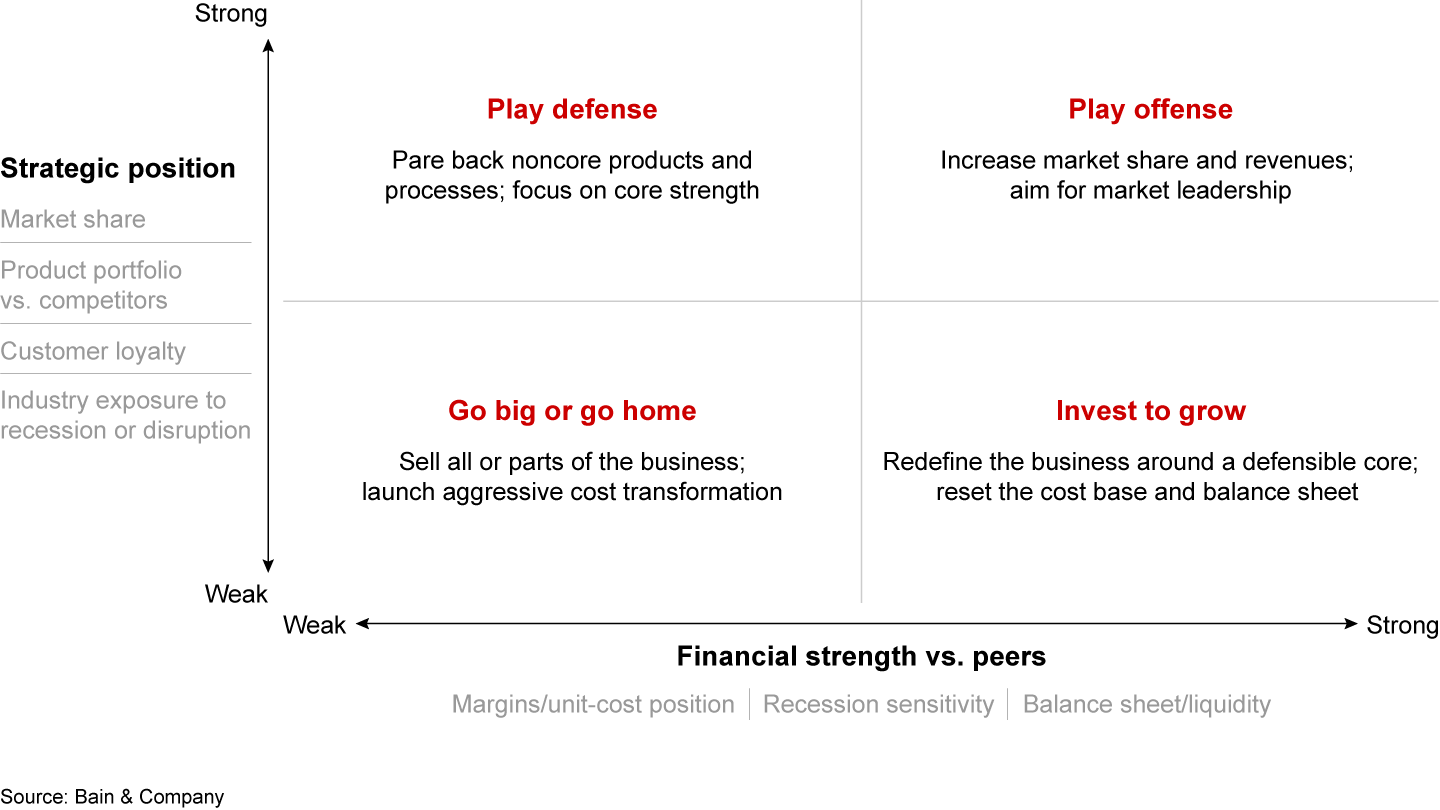
As fund managers know, many actions can improve a company’s performance, including cost reduction, investment, increasing revenue, shifting resources to core business activities, enhancing digital capability, and bold strategic moves. The importance of any one action depends on the company’s industry, strategy, and financial position. Successful funds analyze the potential for value creation to determine which actions will work best for a specific company. In our experience, improving a company’s cost position is highly effective for a range of situations (see Figure 28).
Macroeconomic developments will continue to pose a greater-than-usual risk to company performance for the next 12 months and maybe longer. For investors, the challenge is to identify and focus on the few things that matter most for portfolio performance. Successful funds know that scenario planning is vital in uncertain times. The range of potential outcomes is much wider today than most businesses anticipate.
Leaders are taking a fresh look at their portfolio companies to see if the current macroeconomic climate warrants a shift in strategy. Almost certainly, some assumptions that originally underpinned a value creation plan no longer hold true. When the economic outlook darkens, the best funds redouble their efforts to improve portfolio company performance. They monitor and manage cash on the balance sheet, grow the top line through commercial excellence, and increase margins by managing costs and implementing smart pricing strategies. That helps these winners prosper in challenging times.

Portfolio companies: fit for the storm
During the past decade, strong topline growth has helped power impressive returns for private equity funds in the Asia-Pacific region. But an economic downturn is looming. Some fund managers have navigated through tough times in the past, particularly industry veterans who had to steer portfolios through the global financial crisis in 2008–2009. The initial outbreak of Covid-19 also prompted fund managers to work more closely with portfolio companies to bolster their performance. But most private equity investors in the region are facing their first sustained downturn, including mounting pressure on deal economics.
Slower macroeconomic growth already is curbing portfolio company revenues. And for many deals, exit multiples in the coming years are likely to be lower than they were at buy-in. The good news is that the global PE industry has developed the skills to bring costs down and improve margins when macroeconomic headwinds blow strong. The best-performing funds are already taking a more hands-on approach with their portfolios to manage costs, improve margins, and bolster returns.
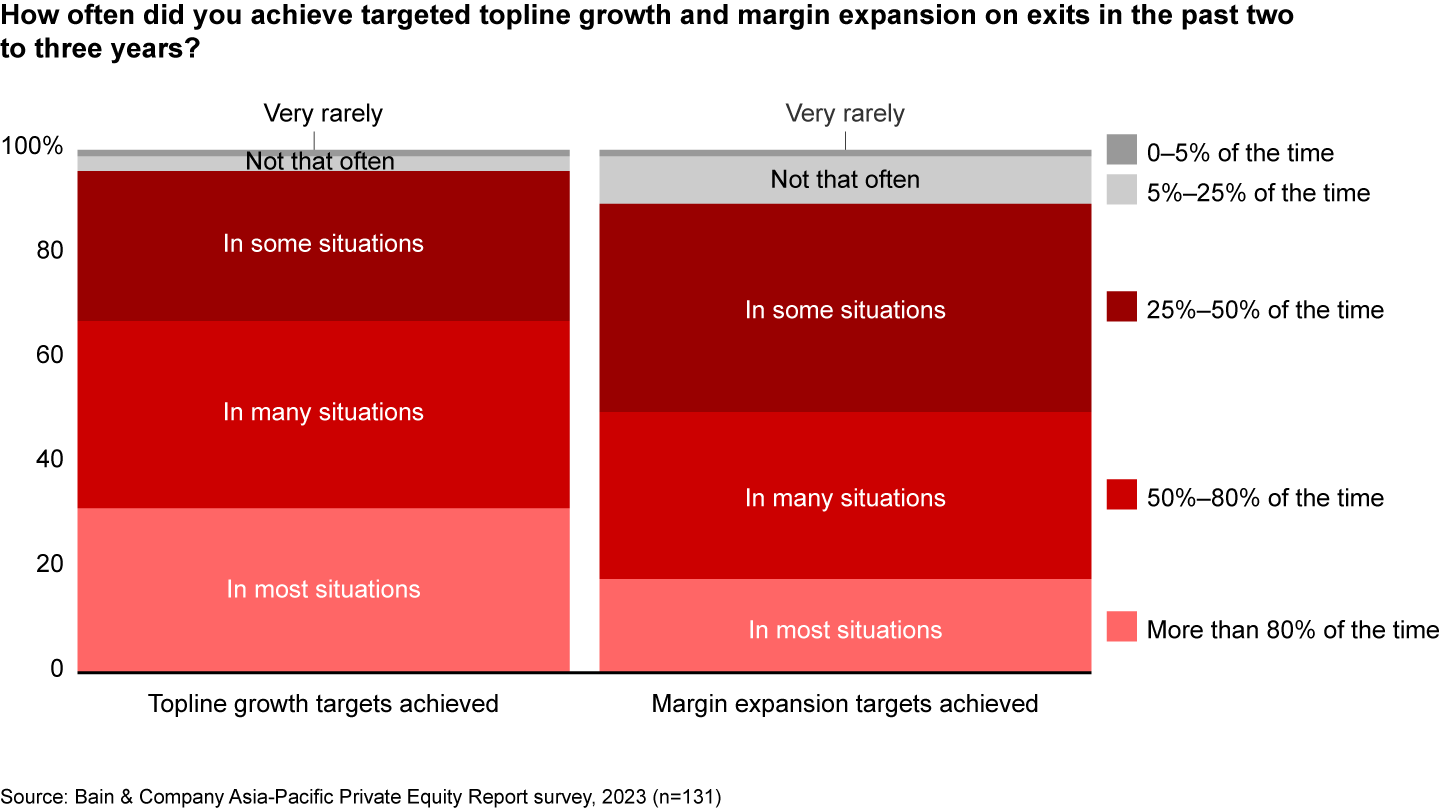
A recent Bain survey shows GPs expect cost improvement to become much more critical to performance. More than half (54%) say it will be one of the biggest factors influencing deal returns over the next five years, compared with 23% five years ago. However, reducing costs is tough. It’s less reliable than topline growth targets as a source of value creation. Two-thirds of the investors we surveyed said they meet topline targets on many or most deals, but only half of these investors do so for margins (see Figure 29).
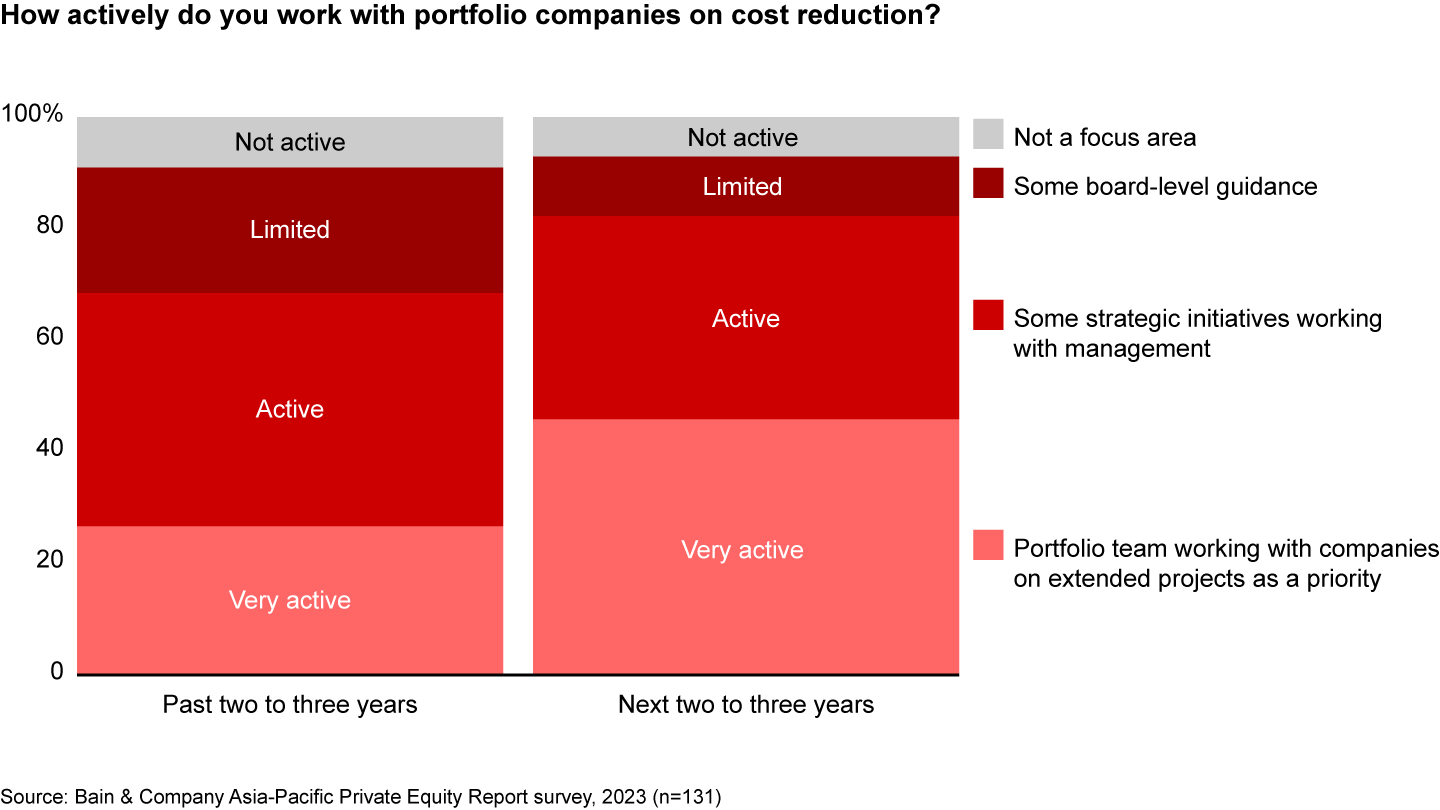
As GPs seek to manage costs, many plan to take a more active role in their portfolio companies. While most funds have worked with portfolio leadership teams on cost reduction to some extent, their engagement has tended to be at a more strategic level, with less than a third saying they’ve deployed teams in recent years to work intensively on some cost initiatives with the portfolio company management. Now, 46% of the funds we surveyed are planning to take a very active role, up from 27% in the past two to three years (see Figure 30).
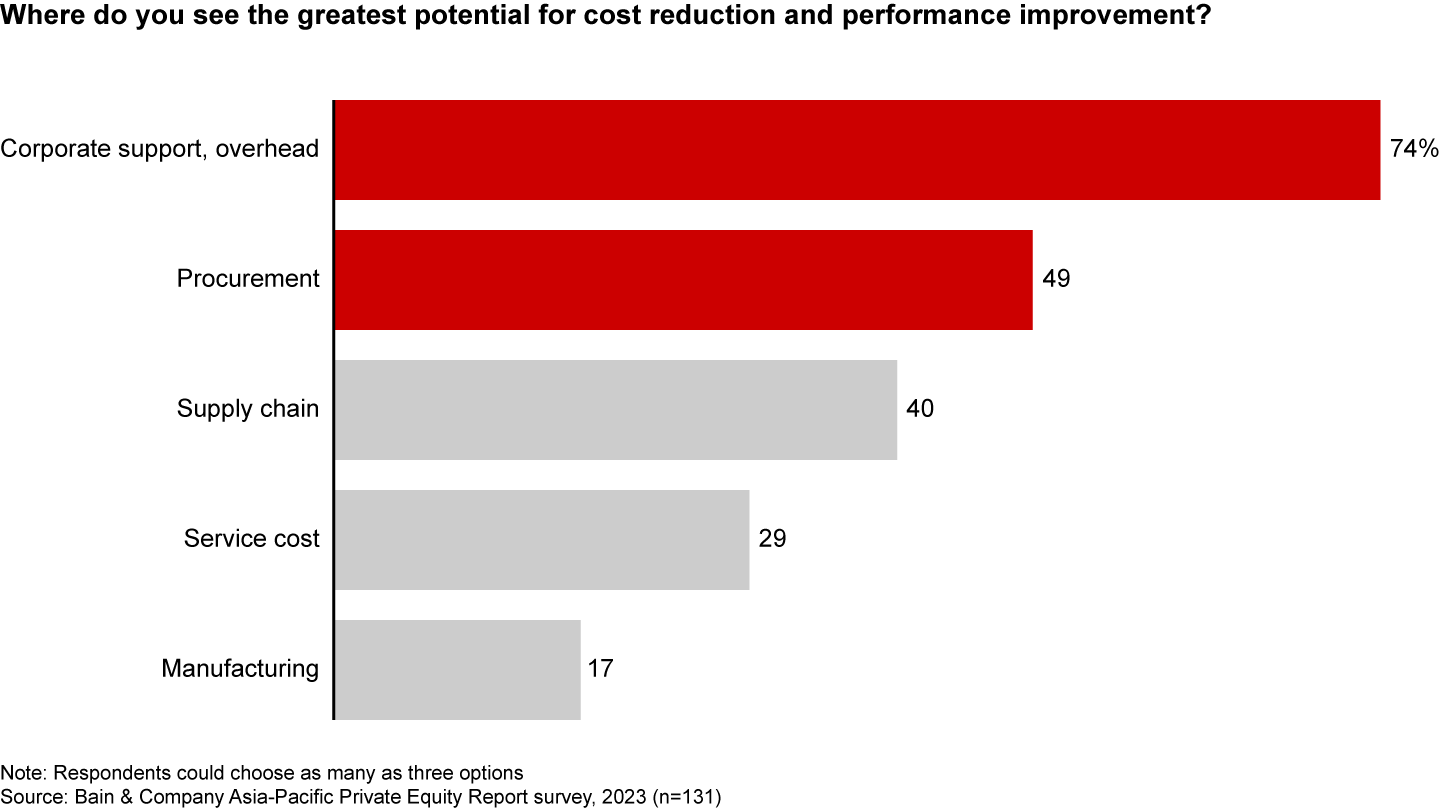
Successful GPs start thinking about performance improvement before they buy an asset. They use the due diligence exercise to identify areas for cost reduction and efficiency gains. In some cases, funds may build an investment thesis around a cost-led transformation of the company, but more often, they focus on reducing costs in one or two functional areas such as corporate support, procurement, supply chain, manufacturing, or service design and operations.
With inflation at elevated levels across the region and supply chain disruption a continual risk, senior executives are focusing much of their attention on procurement, corporate and overhead costs, and supply chain efficiency (see Figure 31). Below, we take a close look at how leaders are making significant gains in each of these areas.
Procurement
For every private equity investor, inflation has taken a toll on performance, raising input costs and squeezing gross margins. While optimizing procurement can cut costs significantly, leaders carefully consider how changes might affect supply chain risk and the customer experience. For example, when a PE-owned electronics company in Japan faced rising input costs on key components such as printed circuit boards and capacitors—as well as ongoing supply chain disruptions from Covid-19—the leadership team decided to assess the potential for savings from renegotiating supplier contracts.
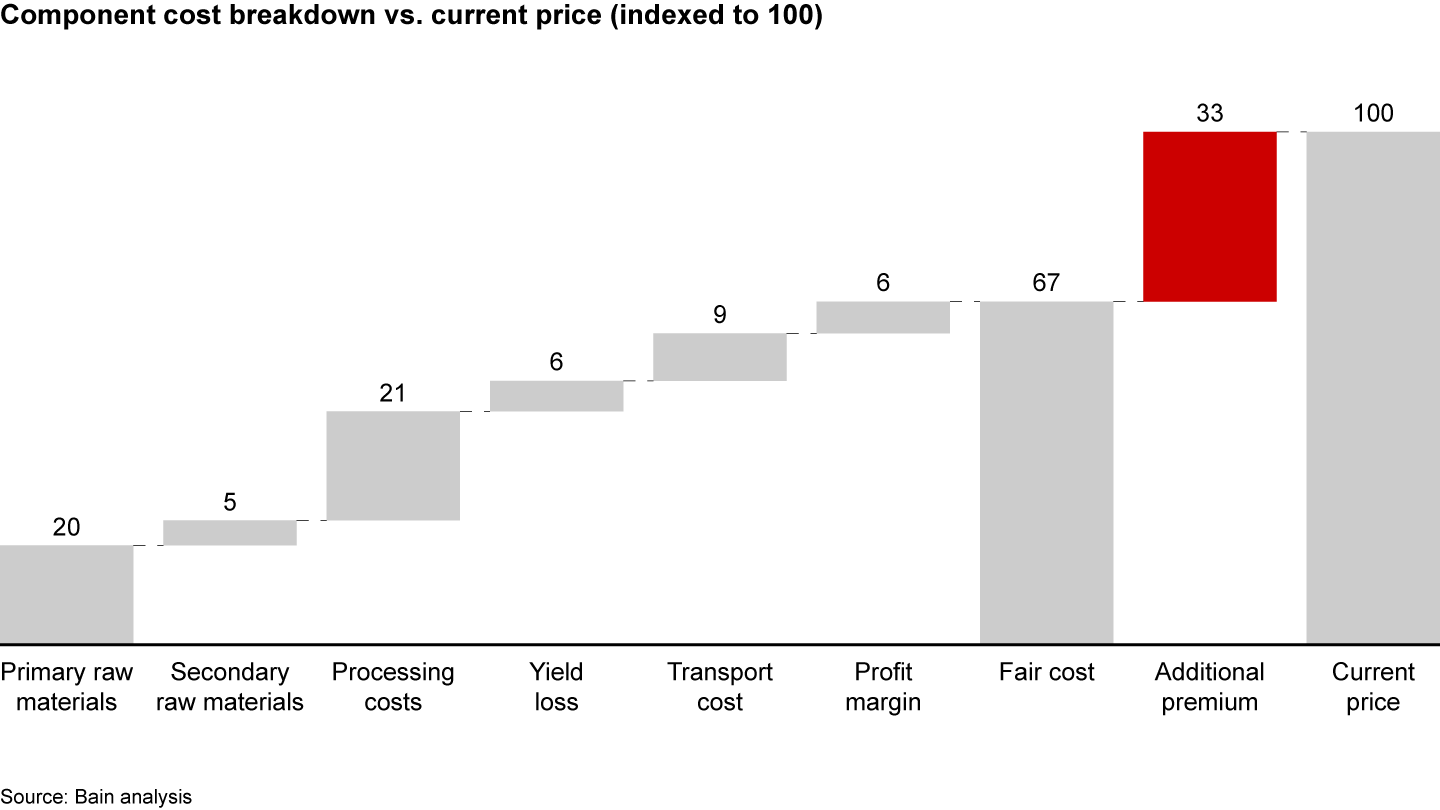
Using an analytical approach based on benchmarking and clean-sheet costing, a company can break manufacturing cost into its component parts and estimate a fair cost as a basis for negotiating with suppliers (see Figure 32).
Once the team identified a set of initiatives with the highest potential savings, it set up a task force to chart progress on each one, including negotiation developments and final outcomes. The task force also used cutting-edge software tools to identify further cost-reduction opportunities.
Targeted negotiations helped the company renegotiate existing contracts on components such as semiconductors and displays within weeks of the initial project, with many contracts yielding higher-than-expected savings. Had the leadership team not acted, inflationary pressure would have triggered cost increases.
More broadly, the team’s effort analyzing its procurement processes prompted a shift in mindset and big efficiency gains in purchasing and supplier management. In total, the company identified $10 million in savings opportunities. Category managers, eager to replicate the positive results in other purchase areas, started to regularly identify negotiation opportunities in procurement.
Supply chain
Covid-related supply chain disruptions have prompted many leadership teams to rethink their networks and increase supply resilience. In fact, supply chain optimization can reduce costs by making fulfillment more efficient and reducing working capital requirements. It also can bolster topline growth by improving service. Take the case of a global private equity firm that acquired a pharmaceutical company in India with the goal of building leading industry platforms for active pharmaceutical ingredients and contract development and manufacturing. As a first step, the fund implemented a cost-optimization program to improve procurement, manufacturing, and supply chain efficiency.
Addressing the supply chain, the fund manager launched several initiatives in logistics. A route-by-route benchmarking exercise identified opportunities to trim costs in air and sea freight (see Figure 33). The optimized road transport analysis included truck size and utilization, packaging, dispatch frequency, and reverse logistics for returns, recalls, and recycling.

The company is now working on a plan to realize the savings, optimize further, and improve supply chain resilience. The leadership team’s goal is a more accurate and integrated view of demand forecasting, inventory management, and sales and operations planning to improve cost management and reduce the risk of supply chain disruptions.
Corporate support
Every fund manager knows that reducing general and administrative costs can expand margins and boost returns. But optimizing support functions also can create value beyond cost savings, including speed, accuracy, and innovation. Automation can help bring about those gains.
When a global PE fund acquired an Asia-Pacific regional airline in the wake of Covid-19, it had to move fast to transform costs in order to survive the collapse in air traffic and reshape operations to thrive in the long term. The fund launched multiple cost and topline initiatives, redesigned the organization, and set up a transformation and results delivery office.
One of the most successful initiatives was a zero-based redesign of head office costs, which had built up significantly and outstripped those of peers. The leadership team first reviewed all the company’s activities and how they were performed, then established an optimal size for each function and subfunction. The process led to a one-time reduction of cost and complexity, particularly in the sales function, which was restructured into smaller groups with fewer spans and layers.
In the wake of Covid, the company reduced headquarters staff in order to maintain a constant level of workers per aircraft, a move that reduced costs by 40%. Cost leaders know it’s critical to base headcount reductions on an effective redesign rather than simple benchmarking. Companies that fail to think through the implications may find the organization unable to perform some critical tasks or suffering from quality problems.
When redesigning an organization or a function, successful companies assess which tasks would be more efficient if automated. By conducting an expert review of more than 70 processes in six functions, this airline company identified 100 subfunctional activities that could be automated, allowing the same functions to be carried out at lower cost. The performance improvement program continued to bolster the bottom line when flight activity rebounded. New structures and processes allowed the airline to increase capacity when travel restrictions were eased, without adding to headcount—and laid the foundation to generate new efficiencies as the company grows.
For many PE firms investing in the Asia-Pacific region, taking a hands-on approach to improving portfolio company performance may seem arduous. However, the macroeconomic winds are no longer providing companies in the region with a powerful tailwind. In the coming years, PE funds that excel at improving cost management and efficiency in their portfolio companies will be able to create value even during a downturn. Top-performing funds have already started down that path.


