Report

한눈에 보기
- While spending did recover for fast-moving consumer goods in China in the second and third quarters, it was not enough to offset the impact that Covid-19 had in the early months of 2020. Overall value declined primarily due to lower average selling prices―the first FMCG deflation in five years.
- If there was a bright spot, it was home care categories, which enjoyed a healthy 9% value growth as consumers stocked up on necessities. Also, innovative healthy alternatives and increased home consumption boosted sales of carbonated soft drinks, which achieved 16% volume growth.
- For the first time, we have analyzed both online and offline shopping behavior across the eight distinct consumer segments developed in 2019 with Alibaba to help consumer goods companies more clearly understand who is buying their products and the untapped potential for growing their brands.
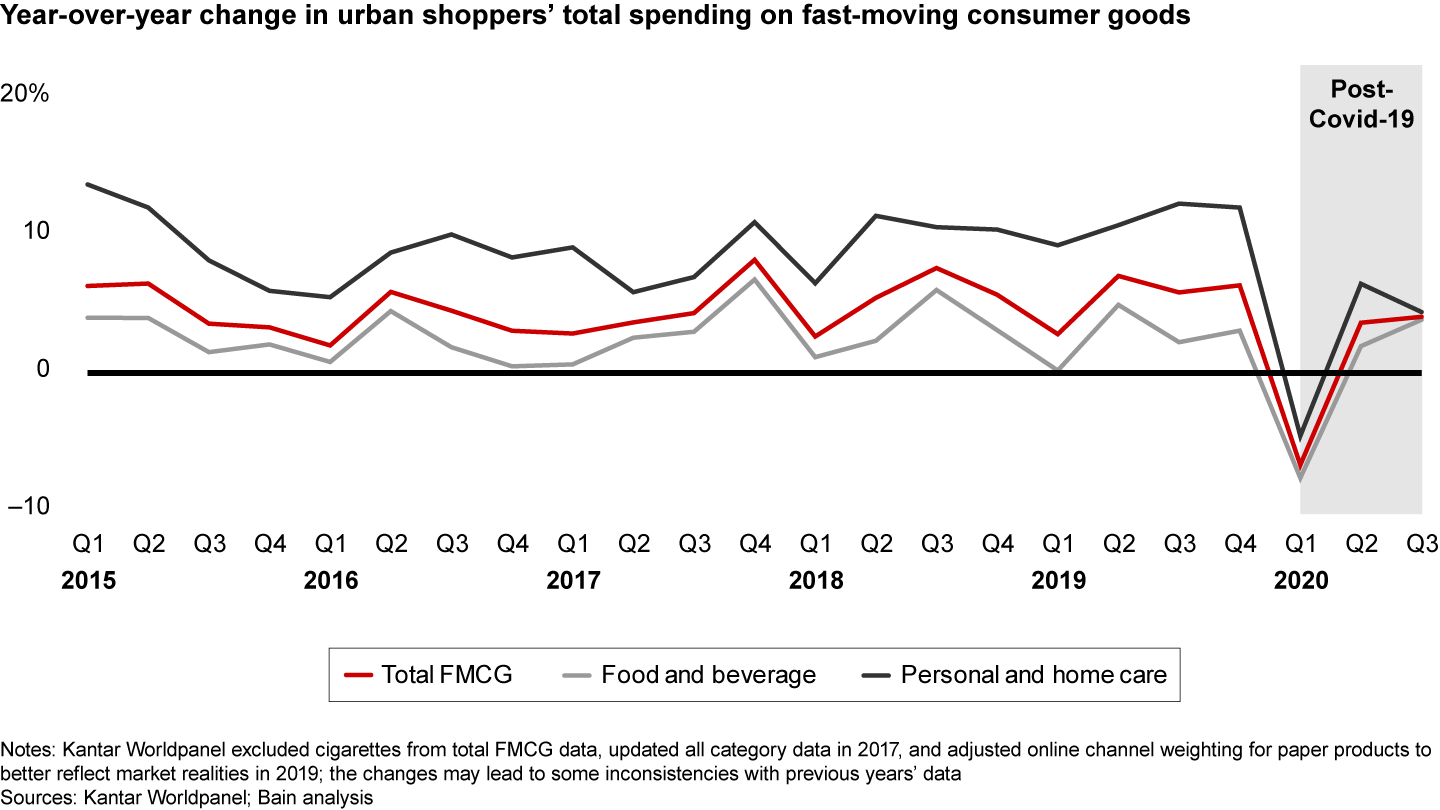
China’s dependable growth in the overall value of fast-moving consumer goods (FMCG) took a pause in 2020 amid dramatic shifts in consumer behavior caused by the Covid-19 pandemic. There was a sharp decline in overall spending in the early months of 2020, as cautious consumers stocked up on necessities, sought out lower-priced goods and held off on anything deemed unessential. Overall, FMCG spending did recover in the second and third quarters (see Figure 1). However, those recent gains were not enough to outweigh the significant slowdown earlier in the year. Sales were essentially flat in the first nine months of 2020 after three straight years of more than 5% annual growth.

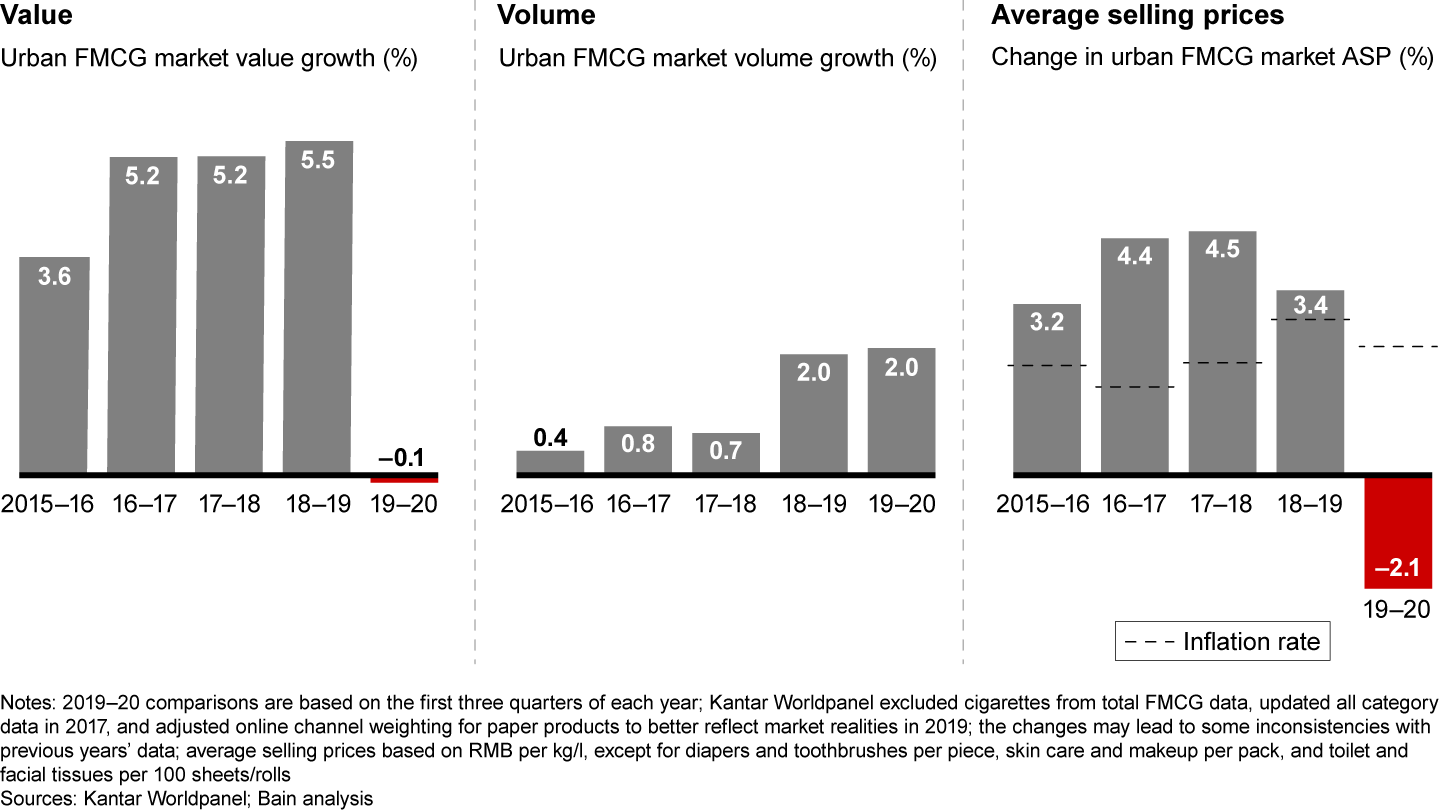
While volume growth remained steady at the same 2% level of 2019, the biggest contributing factor to the flat sales performance was a major decline in average selling prices (ASP). Those prices dropped by an average 2.1% in the first three quarters, with consumers buying more mass-market products and making more of their purchases online, where products typically are sold at promotional rates. The ASP loss represents more than a 5% drop when you consider the 3.4% increase in 2019 (see Figure 2). Indeed, after years in which selling prices outpaced inflation, the long run of premiumization―or the ability to increase ASP above the rate of inflation―ended this year, another victim of Covid-19.

This is the ninth consecutive year that we have tracked the shopping behaviors of Chinese consumers. Our continuing research has given us a valuable long-term view across 106 fast-moving consumer goods (FMCG) categories purchased for home consumption in China. As in each of the past eight years, we analyzed the key 26 categories1 that span the four largest consumer goods sectors: packaged food, beverages, personal care and home care. We also looked at another 19 categories2 to form a more comprehensive view of the market. This report, which updates the findings from China Shopper Report 2020, Vol. 1, Amid Stable Growth, Covid-19 Changed Shopper Behavior, includes Kantar Worldpanel shopper behavior data for the first three quarters of 2020.
Written in collaboration with
Written in collaboration with

This year we also added a new dimension to our research. We evaluated shopper behavior across the eight consumer groups we first identified in the 2019 Online Strategic Consumer Groups Report: Innovate for Consumers with Insights from Big Data. For that report, we drew on proprietary Alibaba data to paint the clearest picture ever of who China’s online shoppers are, how they shop and what it all means for companies hoping to sell to them. To sketch out the profiles of those eight consumer groups, we relied on the data produced by hundreds of millions of Tmall and Taobao consumers. In this report, we further look at both their online and offline behaviors.

Macro Surveillance Platform
For more detail on the business implications of coronavirus from Bain’s Macro Trends Group, log on to the Macro Surveillance Platform. Learn more about the platform >
Pandemic silver linings: packaged foods and home care sales
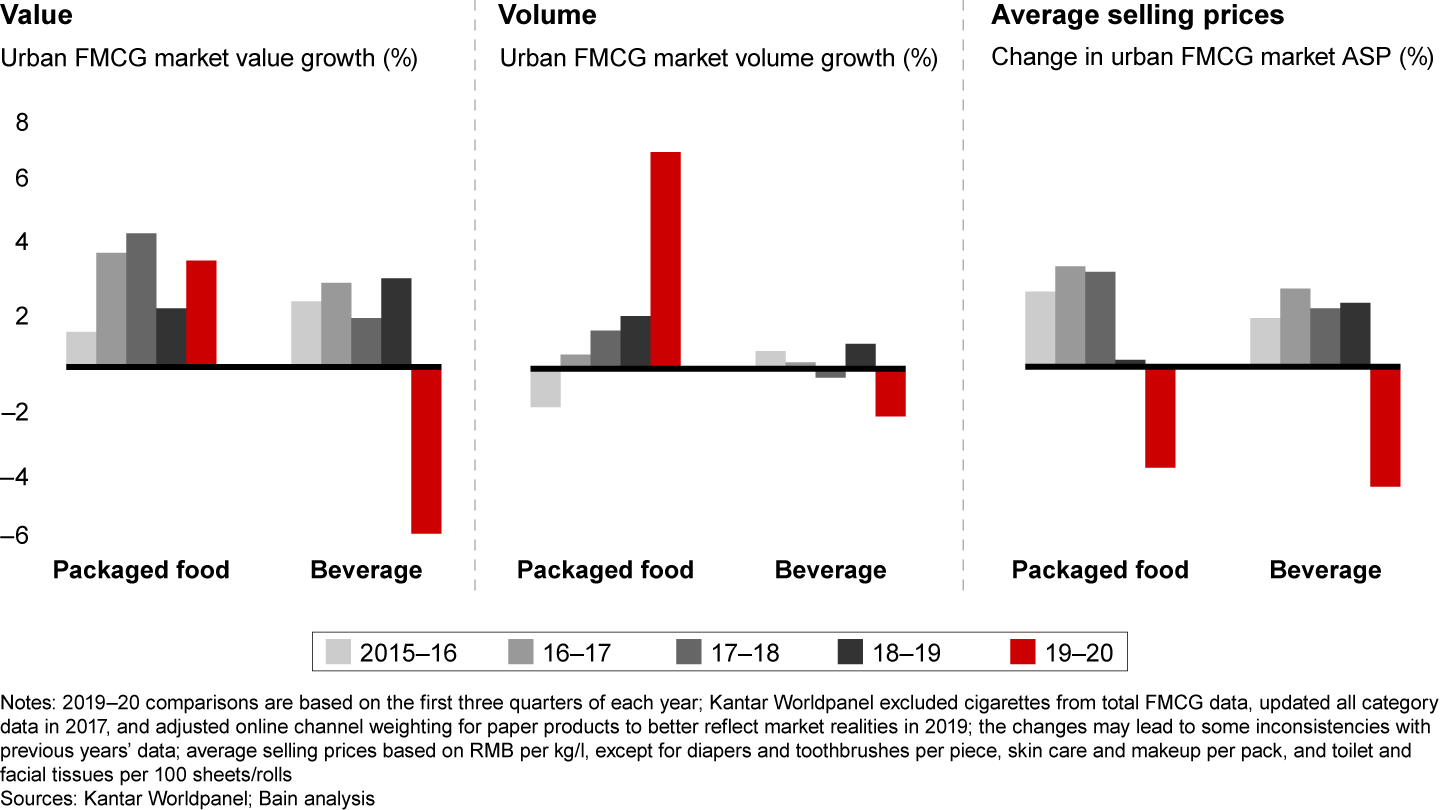
China shopper behavior resulted in dynamic trends in 2020 and none was more striking than the divergent performance of packaged foods and beverages. Both sectors dealt with deflated prices, which declined 3.4% for packaged foods and 4.1% for beverages (see Figure 3). However, the similarities end there. The volume of packaged foods grew 7.2% in the first nine months, as consumers stocked up on instant noodles, frozen food and other staples to get them through lockdown and a tentative recovery. The volume gains for packaged foods represent a more than threefold increase over the same period in 2019. Yet, as package food sales boomed, beverage volumes fell by 1.6%, the result of a hiatus on social occasions. While rising volumes contributed to a 3.5% overall value growth for packaged foods, lower volumes for beverages resulted in a 5.6% decline in value during the first three quarters of 2020. Despite the disappointing performance in beverages, some categories bucked the trend. For example, carbonated soft drink volume rose 16%, driven by increases in home occasions, new products such as sugar-free/diet sodas from insurgent brands Genki Forest and Hey Tea, and the greater focus of major brands on the same segment, which appeals to consumers’ growing demand for products that foster health and wellness.

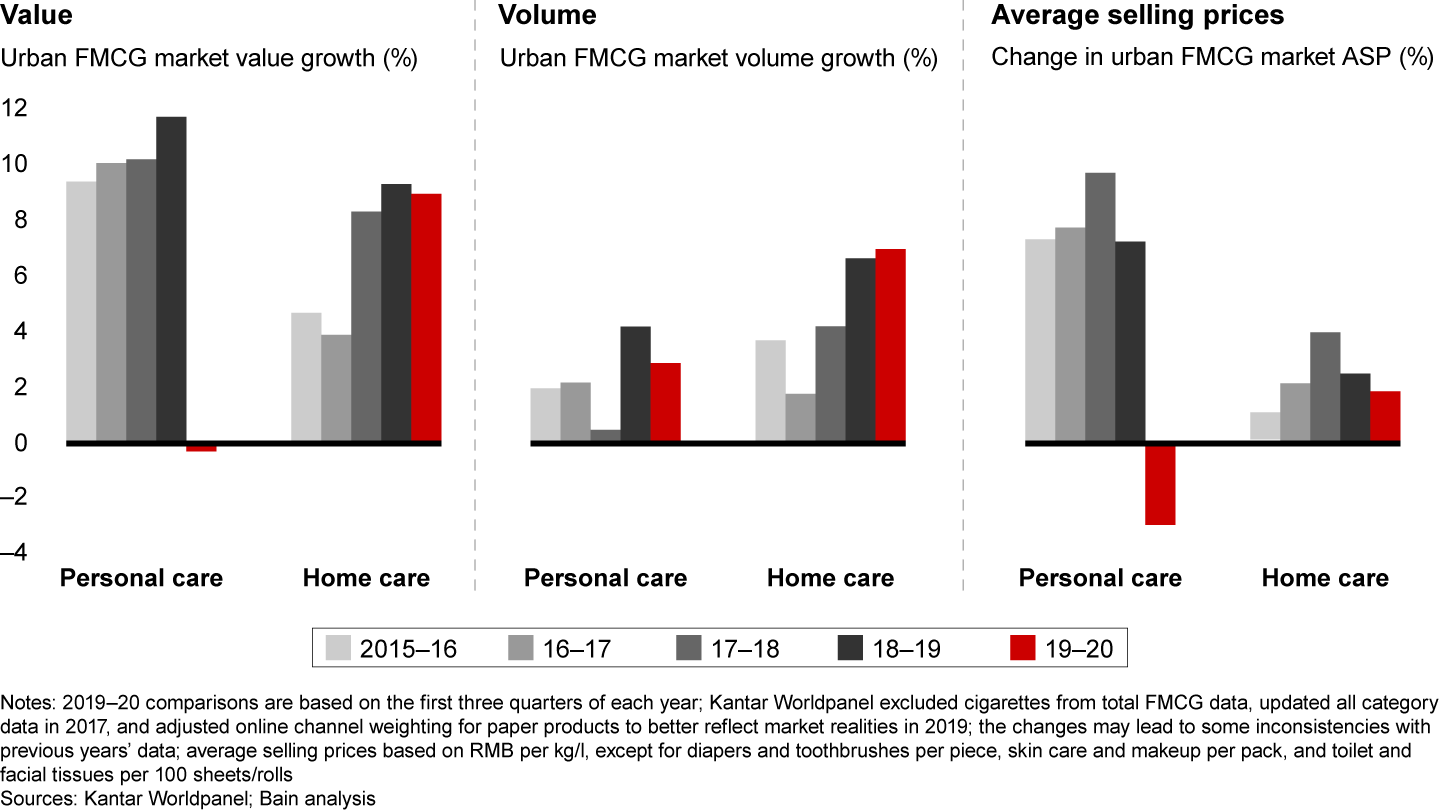
There was a similar divergence between personal care and home care categories. Personal care volume grew a moderate 2.9%, but a 3% decline in ASP led to a 0.2% decline in value (see Figure 4). The personal care story reflects consumer sensitivities during the Covid pandemic. For example, consumers spent considerably more on soap products to maintain their hygiene, leading to a 15% volume growth in personal wash categories. At the same time, locked-down and worried consumers delayed purchases in such categories as skin care and makeup. Makeup, in particular, felt another consequence of the pandemic: ASP dropped by 6.6% as price competition was exacerbated by declining volumes due to Covid-19. Homebound consumers preferred to purchase online, where products typically are sold with large promotional discounts. By contrast, the home care sector enjoyed a healthy 9% value growth as consumers stocked up on facial tissues, toilet paper, paper towels and other home necessities. Home care was the bright spot for the first nine months of 2020, with volume growing 7.1% and ASP rising by 1.8%, making it the only one of the four major sectors to see increased prices.

Four paths to recovery
As we reported in China Shopper Report 2020, Vol. 1, Covid-19 affected FMCG companies in four distinct ways (see Figure 5). A first group of categories surged during the pandemic and continued booming in the recovery. This is the growth trajectory of hygiene categories such as personal wash, carbonated soft drinks and other products that were widely used in stay-at-home situations. Sales of these products remained strong as restrictions were lifted, with consumers’ renewed commitment to their health.
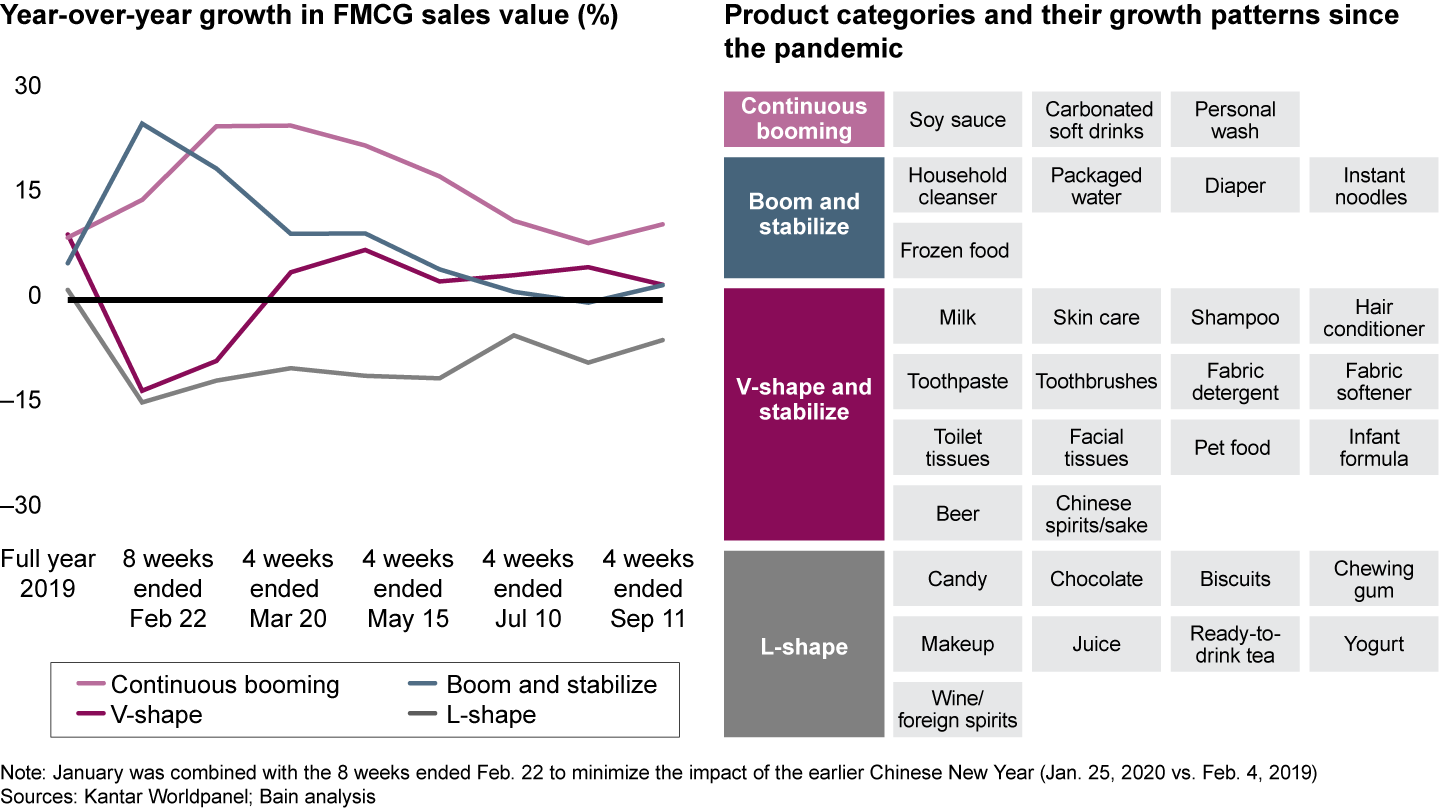

A second group of categories boomed in the lockdown weeks, then stabilized as restrictions were lifted. Consumers who stocked up on such categories as frozen food, packaged water and household cleanser did not need to buy more.
A third group of categories, many of them relating to health and nutrition, went through a V-shaped recovery. Sales dropped dramatically during the pandemic, only to quickly recover as consumers repurchased the products. Categories such as milk and infant formula even generated stronger growth than in previous years.
A final pattern: Categories such as makeup, which was not essential for consumers wearing masks, and impulse categories such as candy declined, but are slowly improving. However, the recovery speed of those categories was slower than the expected U-shape, presenting an L-shape pattern instead. As consumption continues to return to normal, we see these diverging consumption patterns converging toward the pre-Covid normal.
As we mentioned, the drop in selling prices was the biggest cause for declining overall FMCG value growth in the first three quarters of 2020. Evaluating the overall FMCG market, we see three major pricing trends (see Figure 6). The first involves spending polarization in pricing tiers. Mass segments are growing as fast as premium segments, with both outpacing midrange segments in categories such as instant noodles, personal wash, fabric detergent and infant formula. The polarization trend in consumption mirrors the polarization of household incomes and is expected to continue even after Covid ends.
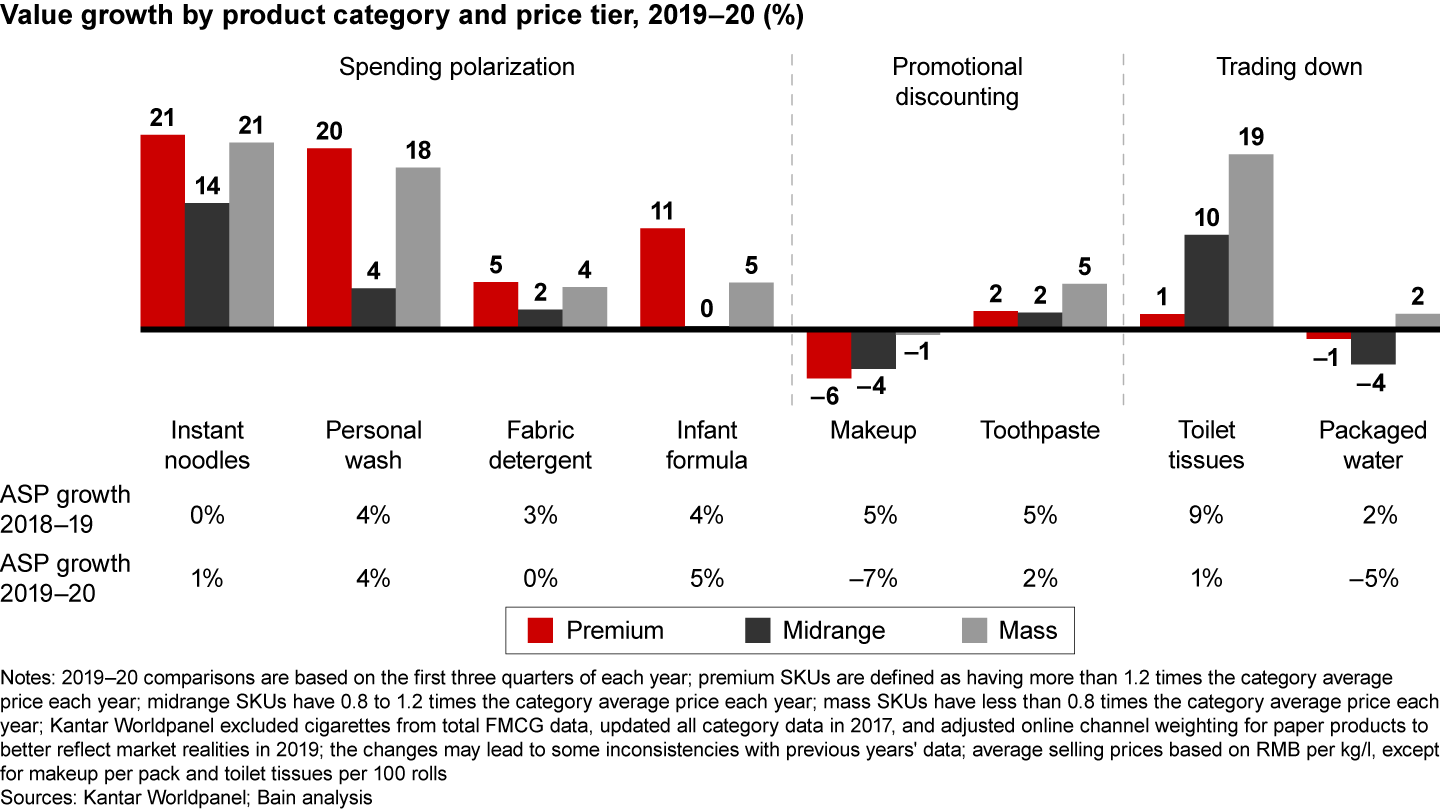

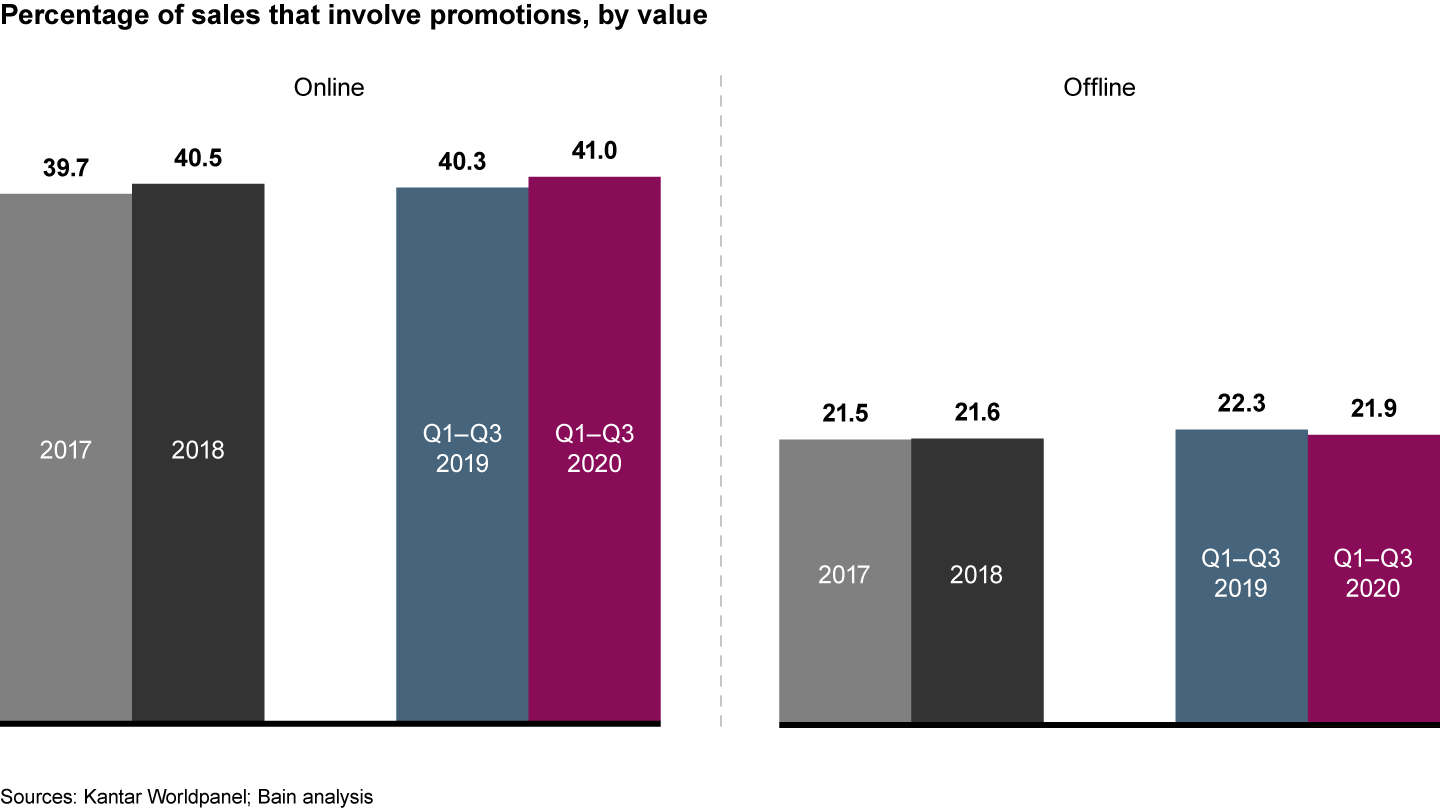
The second pricing trend relates to the heavy promotions that companies offered in categories such as makeup that suffered heavily during the pandemic, and categories with intensifying competition such as toothpaste. Brands sold goods at unprecedented discounts, especially online. Goods sold as part of online promotions grew to 41% of sales, compared with around 22% for offline promotions in the first nine months of 2020, as companies strived to stimulate online sales (see Figure 7).

The final pricing trend we identified: As Covid worries led cautious consumers to switch to lower-priced necessities such as toilet tissues and packaged water, leading e-commerce players have focused more on bargain-conscious consumers to fuel growth this year. The trend is reflected in the rapid growth of Pinduoduo and the fact that the top two retailers invested in lower-priced platforms: Alibaba’s Taobao Deal and JD’s Jingxi. As consumer confidence improved, sales of premium products gradually recovered from the first to third quarters, but this premiumization trend was not enough to offset the negative pressure on prices.
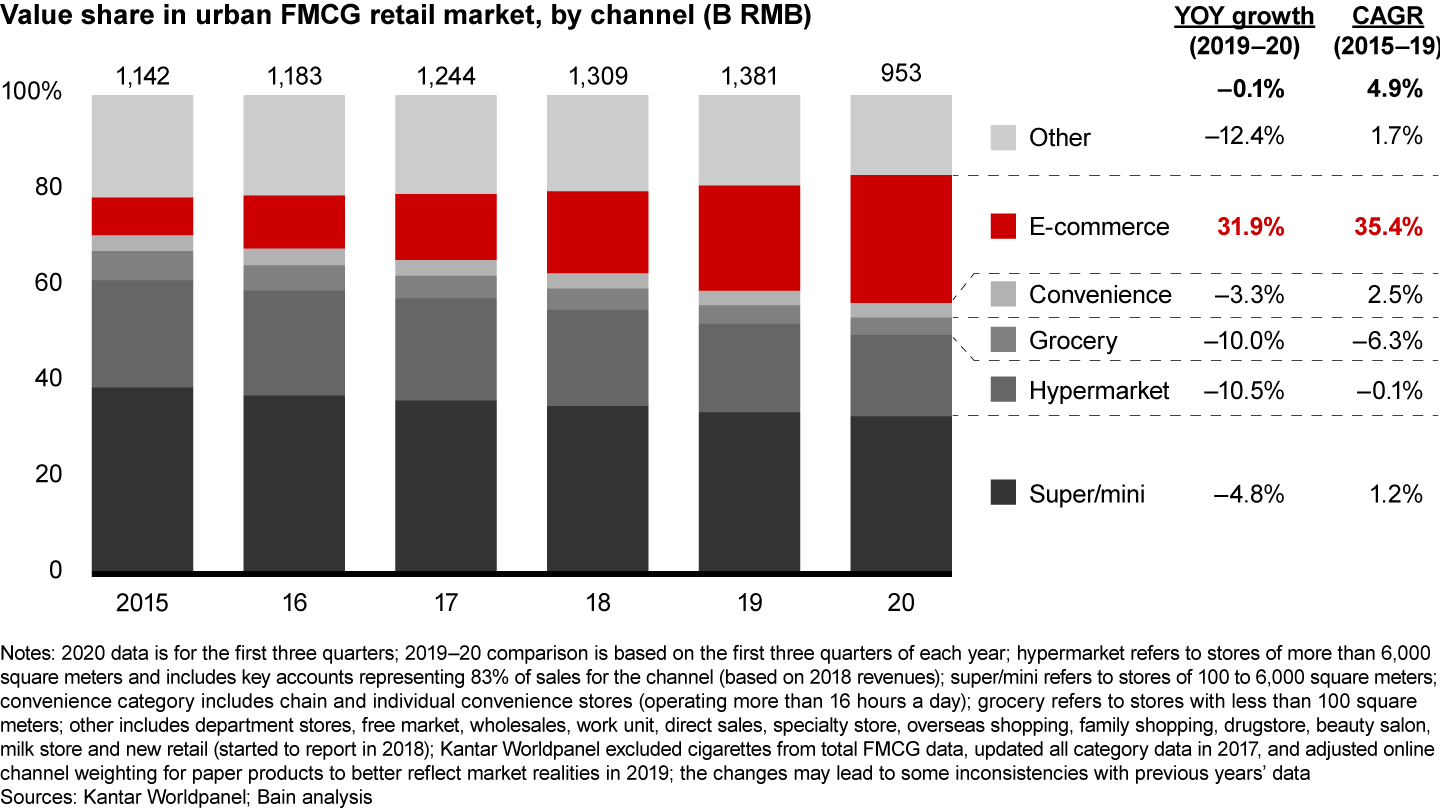
Online channels continued to attract China’s shoppers during the early months of the pandemic and the recovery that followed. E-commerce represented 26.7% of all FMCG sales in the first three quarters of 2020, up from 21.9% in 2019 (see Figure 8). E-commerce is growing largely at the expense of hypermarkets and groceries, despite the rapid growth of online-to-offline (O2O) sales, which are captured in offline channels by Kantar. (We discuss O2O growth later in this report.)

As in previous reports, we track online penetration by segmenting product categories into four clusters, which all increased their penetration significantly in the first three quarters of 2020 as the pandemic accelerated the shift online (see Figure 9).
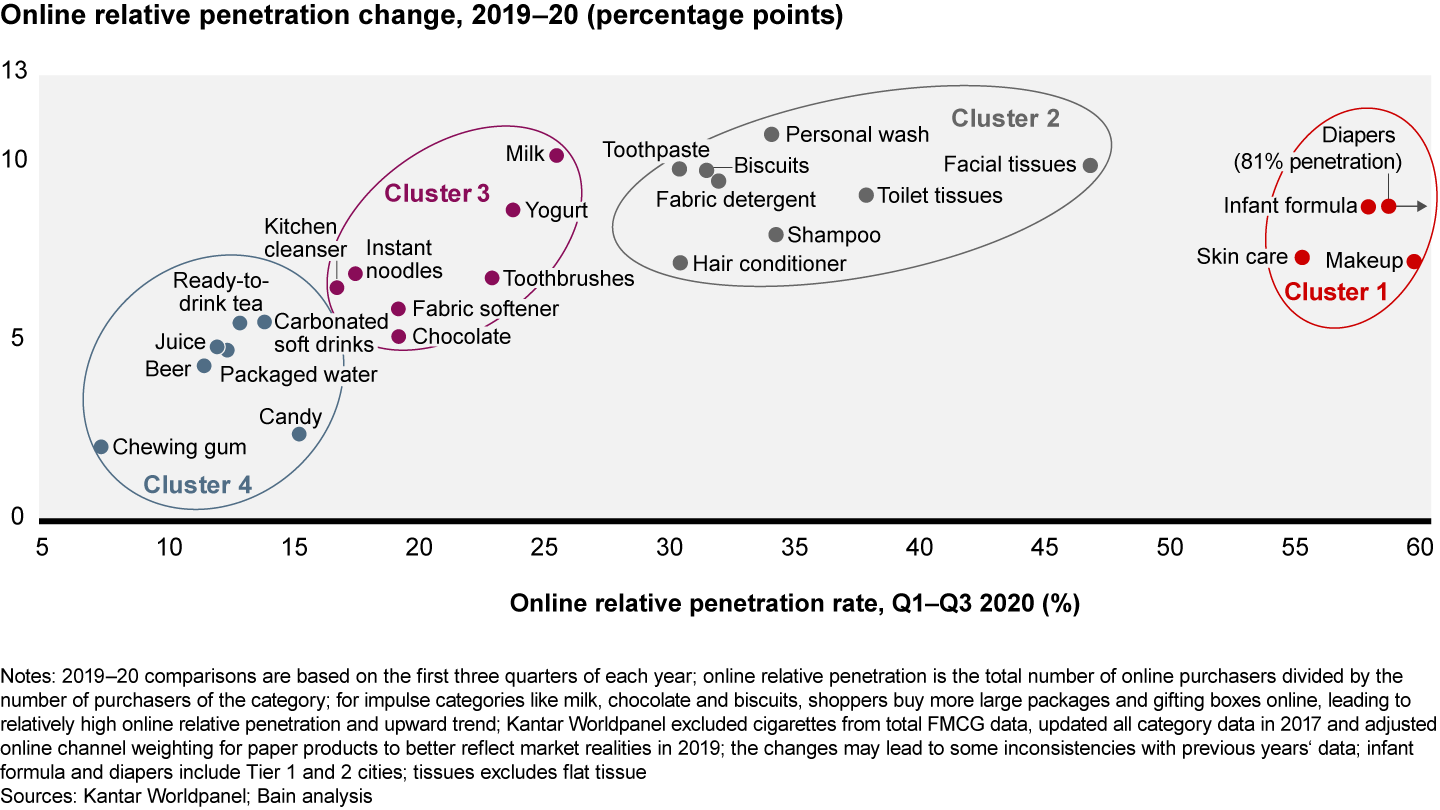

The first cluster consists of categories with very high online penetration and which historically had low penetration growth. Many of these categories—including diapers, infant formula, skin care and makeup—were approaching the limits of online penetration growth. However, the Covid-19 crisis boosted their online penetration by an unprecedented seven percentage points or more. Diapers achieved 81% penetration, for example.
Online penetration for the second cluster, spanning daily essentials categories such as personal wash, toothpaste, facial and toilet tissues, also rapidly grew to more than 30%.
The third cluster, which is made up of less essential categories such as chocolate, yogurt and fabric softener, boosted its online penetration to 20% to 25%.
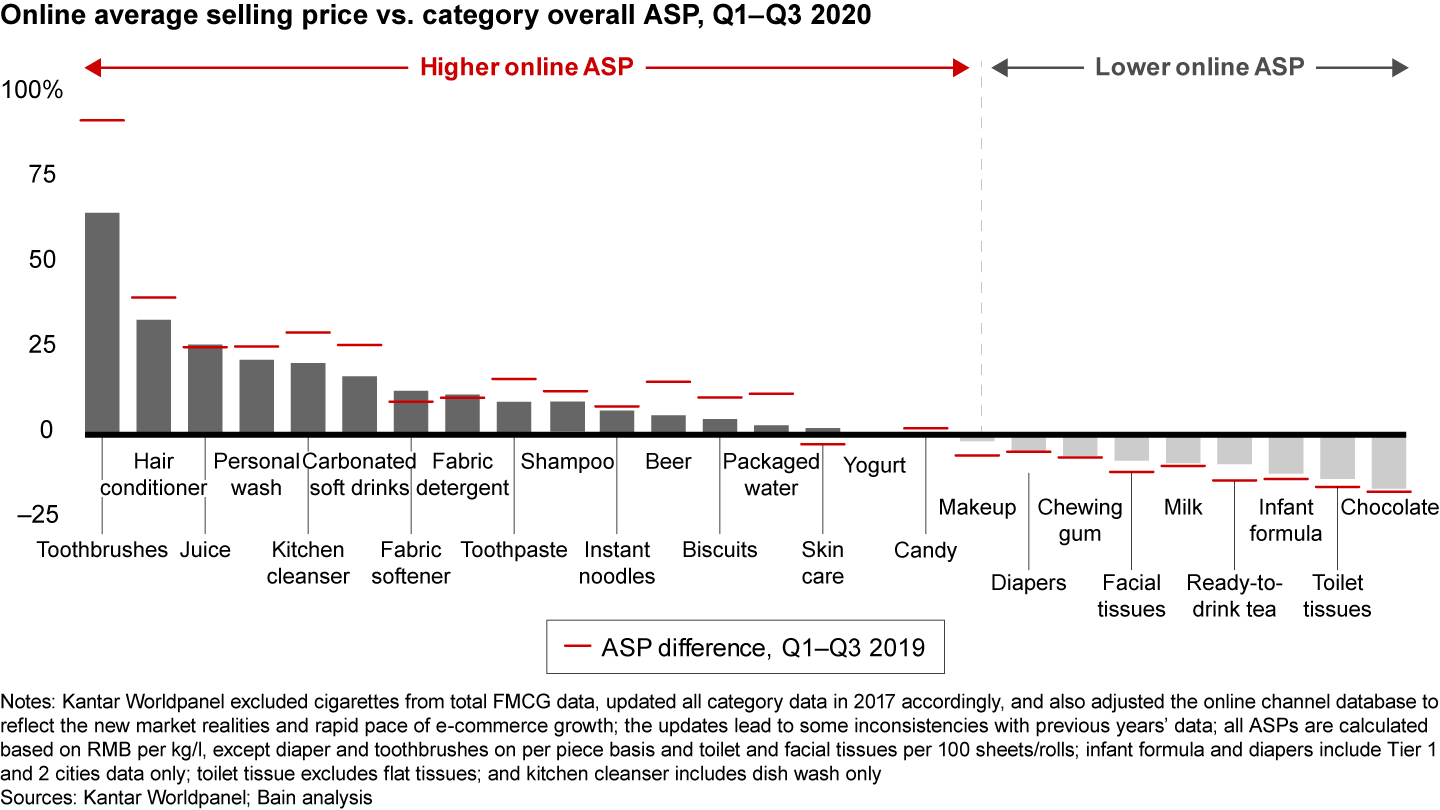
The fourth cluster consists of impulse categories such as chewing gum, candy and beverages. For these categories, the high cost of fulfillment limits the potential for significantly boosting online penetration. In addition, many of these categories, with the exception of beer, packaged water and carbonated soft drinks, are experiencing the L-shaped recovery mentioned above. As companies increase online penetration, they have reaped more value in some categories than others (see Figure 10). Relative online ASP is higher in categories such as toothbrushes and hair conditioner, for example. But their online price premium has declined from 2019, an indication of this year’s overall price deflation. Increased competition from Insurgent Chinese brands has also played a role. Consider that in electric toothbrushes, competitors such as Saky, Xiaomi and Usmile have introduced low-priced versions in online channels. Also, Saky and Xiaomi both collaborated with top Taobao livestreamers riding on the livestreaming trend. Categories with lower online ASP tend to be heavily promoted online. Moreover, categories such as toilet tissues and facial tissues sell larger pack sizes online at lower prices per kilogram.

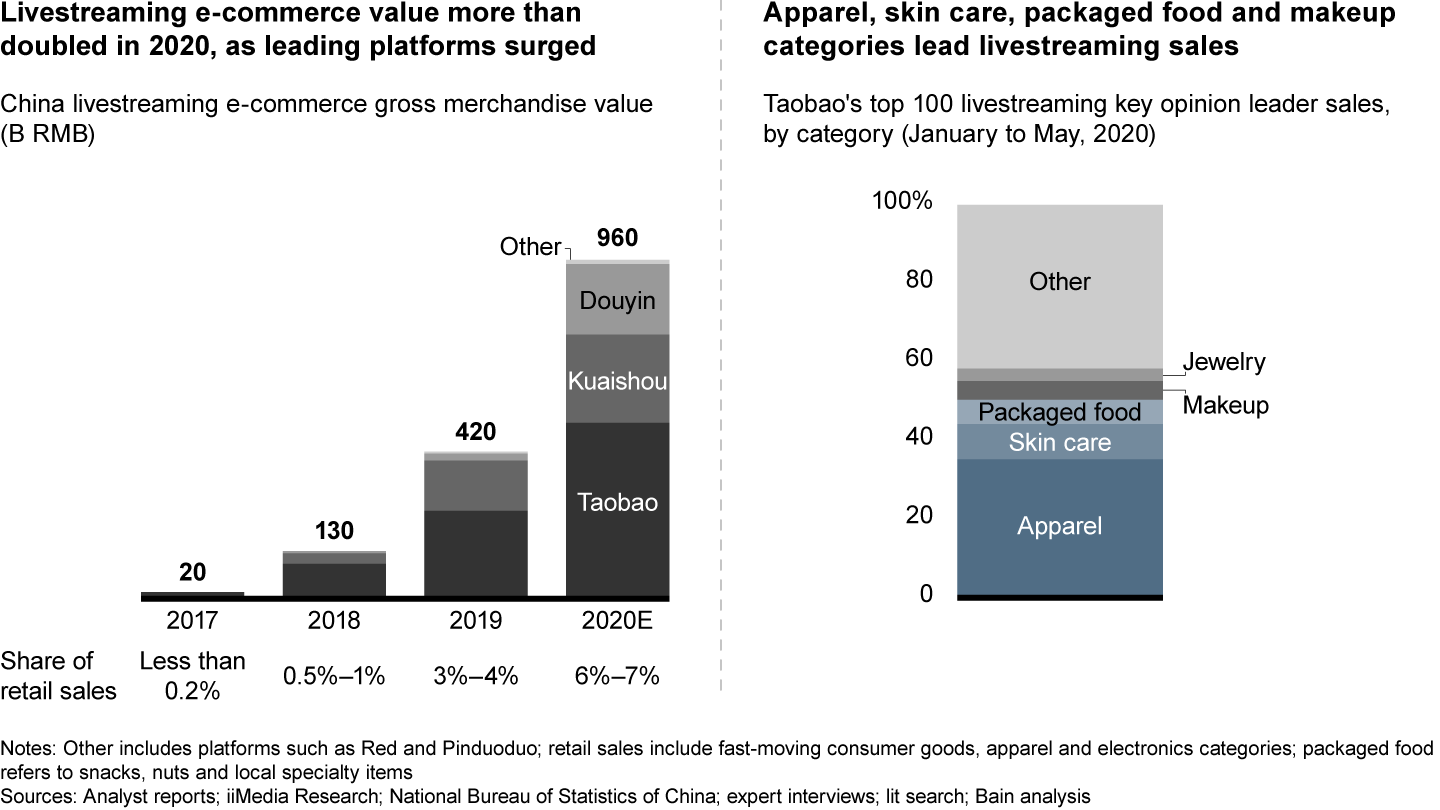
In China Shopper Report 2020, Vol. 1, we reported on the livestreaming video boom. Livestreaming, which burst onto the retailing scene in 2019, provides immersive experiences, personalized recommendations and, as the country locked down during the Covid-19 pandemic, an entertaining alternative to physical shopping trips. Virtually nonexistent three years ago, livestreaming sales account for as much as 7% of total FMCG, apparel and electronics sales (see Figure 11). Apparel, skin care, packaged food and makeup comprise more than half of all livestream sales. Most recently, for example, as top livestreamers on Taobao, Austin Li and Weiya each sold more than RMB 3 billion of FMCG products in just one night during the Double 11 campaign. Livestreaming brings with it a challenge in that many of the products are sold on promotion, which reduces ASP.

Convenience is a big factor in livestreaming’s appeal and is also at the heart of another retailing phenomenon: O2O retailing, which now represents 7.3% of total FMCG value―up from 4.3% last year (see Figure 12). The O2O channel boomed in both food and nonfood categories, capturing more than 50% increases in value share through three major O2O models: Horizontal platforms, New Retailer platforms and Traditional retailers. Many of these retailers have independent apps or mini apps on WeChat, but rely on partners for delivery. For example, RT-Mart collaborates with Taoxianda and Walmart with JD Home Delivery to reduce costs and improve the customer experience.
Consolidation is improving profitability in O2O delivery and is expected to continue. Horizontal platforms such as Dmall, with its digital category management and supply chain management capability, continued to grow amid Covid-19 and now ranks as the No. 1 O2O fresh products app in terms of monthly active users. Meanwhile, Carrefour further integrated Suning’s supply chain capability this year, to execute more timely deliveries. In summary, consumers really enjoy O2O, but the companies involved are still looking for a way to make the model profitable.
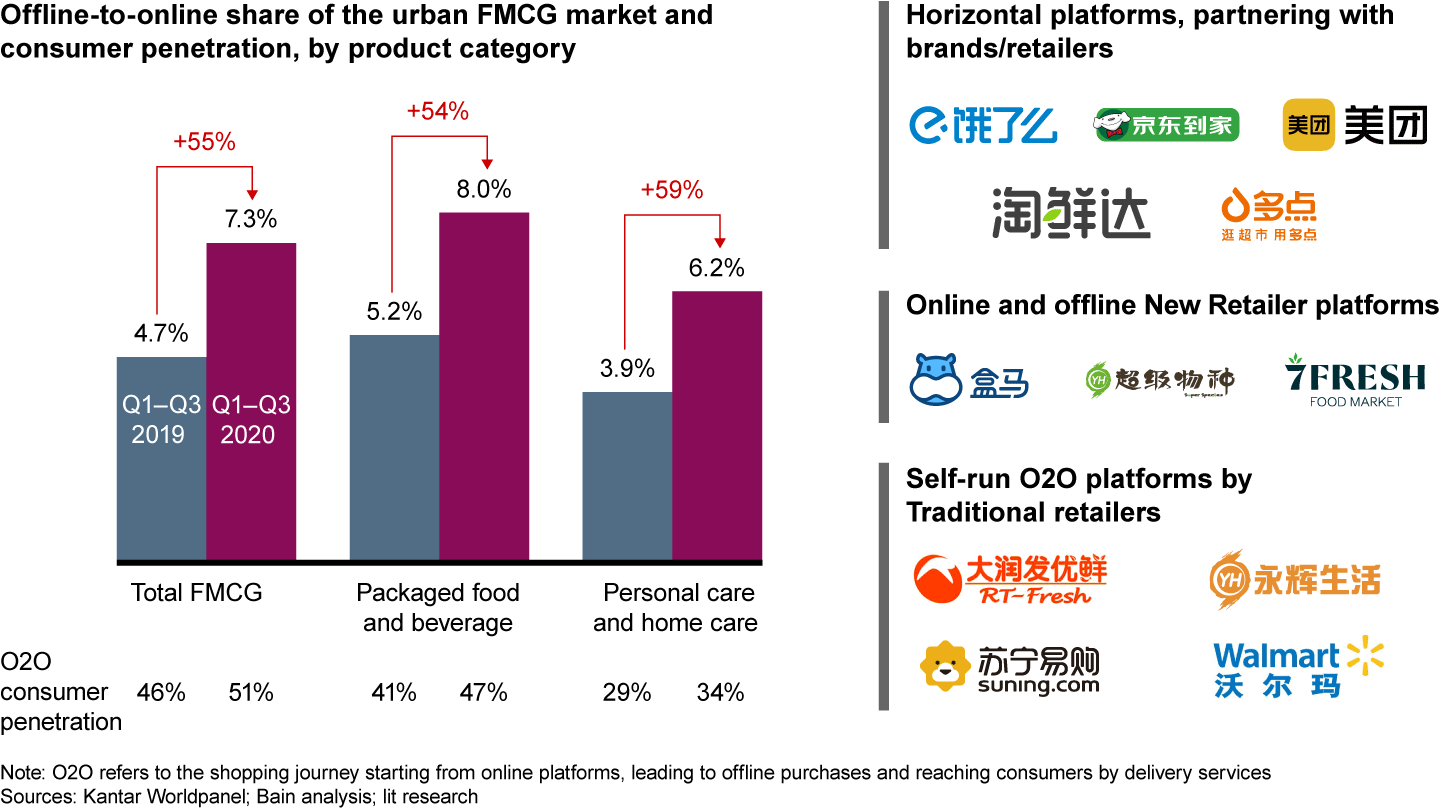

With the pursuit of safety and convenience accelerating consumer demand for O2O retailing during the pandemic and recovery, platforms continued to innovate to compete for consumers. Hema, the leading New Retail player, not only expanded its footprint, but also innovated its store format, introducing Hema Station to serve top-tier cities’ suburban areas and Hema Mini for lower-tier cities.
As Covid-19 helped spur growth in O2O retailing, it also gave a boost to trusted and local brands, which both withstood the Covid-19 pandemic (see Figure 13). Our analysis compares the performance of brands based on their size. Young insurgent brands―many of them Chinese―have been posing increasing competition for incumbent brands. But trusted, established brands weathered Covid-19 relatively well and continued to outperform smaller brands in most categories throughout 2020, driven partly by safety and health concerns.
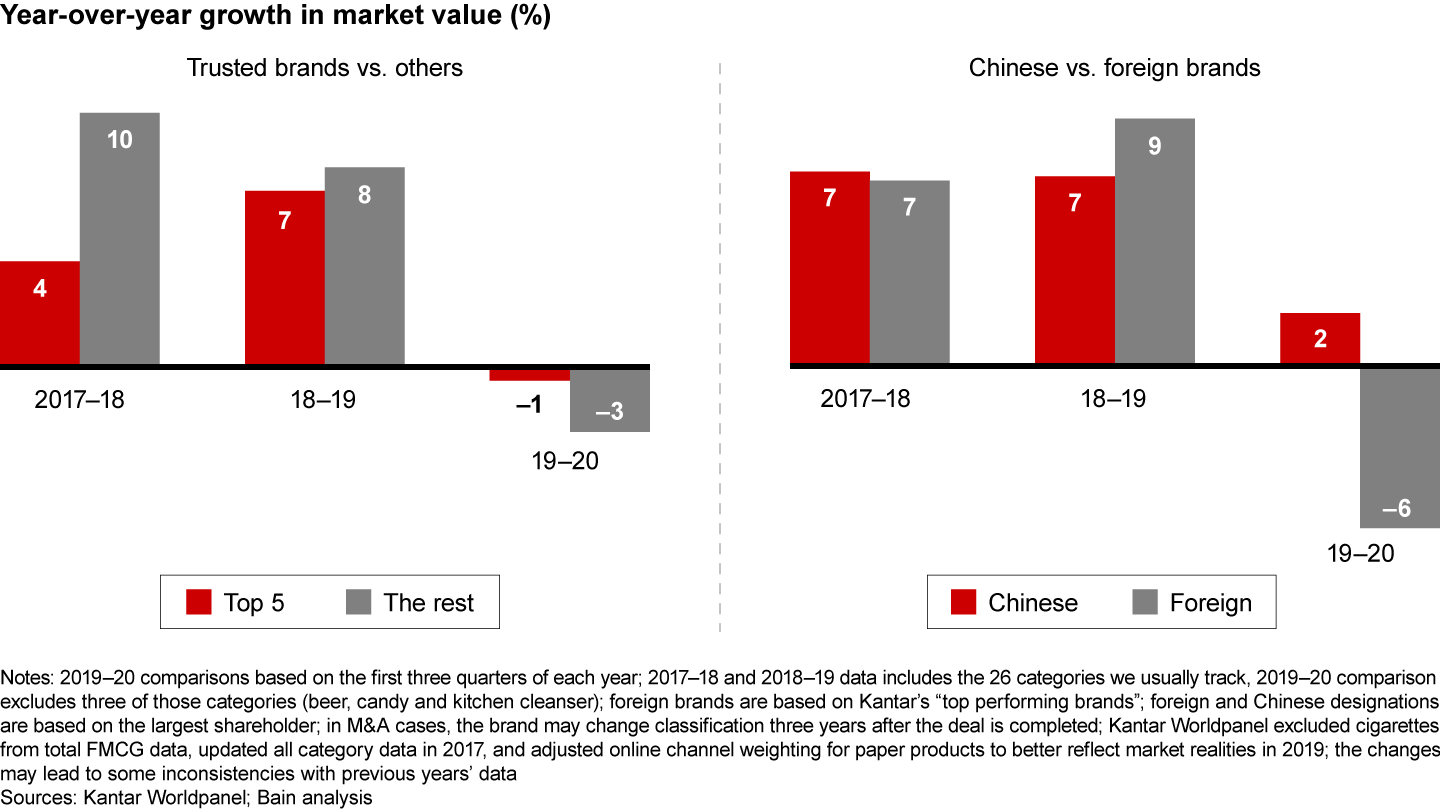

Additionally, we have been tracking the intense competition between foreign and domestic brands since 2013. In the first five years, local brands achieved stronger growth until multinationals started narrowing the gap in 2018. They were learning from their Chinese competitors how to sell in China by taking a “4D” approach: design for China, decide in China, deliver at China speed, and digitalize the China business (see the Bain Brief “Consumer Products: Now’s the Time to Double Down on China”). Foreign brands gained enough traction that in 2019 they outpaced their Chinese competitors in market value growth. However, the pandemic caused this trend to change course. In the early months of 2020, local brands suffered less than multinationals, mainly due to fewer supply chain disruptions and a boost in online sales.
When considering all of these factors, top Chinese packaged food brands benefited the most. For example, top Chinese instant noodle brands such as Master Kong and Baixiang outperformed a category that already was surging in overall consumption. Also, top Chinese brand Firmus in infant formula far outperformed most foreign brands. But foreign brands were generally well-positioned in personal care, which suffered more than home care categories during the pandemic. As Covid-19’s early impact erodes, both small and foreign brands are catching up, although they still are lagging behind large brands and Chinese competitors.
Understanding shopper behavior by consumer segments
Relying on Alibaba’s mountain of data and our insights gained from working with consumer goods and retail companies in China, last year we identified eight strategic segments of China’s online consumers, the demographics and consumption behavior that define each distinct group, the role they play in a host of timely category trends, and the touchpoints that appeal best to them. (See the 2019 Online Strategic Consumer Groups Report: Innovate for Consumers with Insights from Big Data.) Those consumer groups are Rookie White Collars, Wealthy Middle Class, Supermoms, Small-Town Youth, Gen Z, Urban Gray Hairs, Small-Town Mature Crowd and Urban Blue Collars. Collectively they account for 80% of Tmall and Taobao FMCG platform users and represent over 90% of gross merchandise volume. To help brands more clearly understand the consumer segments that are buying their products―and the potential for boosting sales―this year’s report analyzes Kantar sales data for both online and offline sales of these eight segments.
Let’s look at the segments one by one.
Rookie White Collars are educated people in their early 30s who live in Tier 1–3 cities. Their careers are advancing. They work in a fast-paced environment and greatly value convenience—hence, they prefer online shopping. They represent higher per-capita spending on Tmall and Taobao.
Wealthy Middle Class consists of financially stable consumers, typically in their early 40s. They live in Tier 1–3 cities, and primarily work as civil servants or in corporate middle or senior management. They are less passionate than their younger counterparts when buying the latest new products. As more deliberate consumers, they value quality, and a higher proportion of their online purchases are premium products.
Supermoms are women who are pregnant or have children under the age of 12. They live in Tier 1–3 cities and are concerned about raising healthy families while taking great care of their own careers—and their own health and beauty. They are the main shoppers for their families and are willing to pay a premium for convenience. Among all groups, they have the strongest spending power. It is reflected in the number of categories and brands they buy, their shopping frequency and the amount they spend.
Gen Z consists mainly of students in college or graduate school, or freshmen in the job market, living in Tier 1–3 cities. These consumers are digital natives. Unlike their older counterparts, they value trendy items over established brands and are major fans of insurgent brands. This group represented the fastest per-capita spending growth on Tmall and Taobao FMCG.
Small-Town Youth are consumers in their 20s in Tier 4 or smaller cities. They take their cues from big-city youth, eagerly following the latest urban trends. Without the pressure of exorbitant housing prices, they have considerable disposable income at their fingertips. The slow pace of life also provides them with enough time to enjoy games, video streaming and other online leisure activities. Their income and free time make them a huge potential force in online shopping.
Urban Gray Hairs are consumers born before 1970 who live in Tier 1–3 cities. The majority of them are retired and have substantial pensions. This group could be considered a hidden gold mine for online sellers. They now spend relatively little online.
Small-Town Mature Crowd consumers are older than 35 and live in Tier 4 or smaller cities. With their slow pace of life, they typically have an abundance of time to watch videos or news online. They make most of their purchases offline, a preference that allows them to socialize with acquaintances face-to-face.
Urban Blue Collars are less affluent consumers in Tier 1–3 cities who are typically engaged in such professions as catering, transportation or retail. They are familiar with the same e-commerce infrastructure and online channels that influence their middle-class counterparts. Yet, compared with the Rookie White Collars or Wealthy Middle Class groups, they are more concerned about value for their money when shopping online and tend to buy fewer items. Their per-capita spending on Tmall and Taobao is far below that of middle-class shoppers.
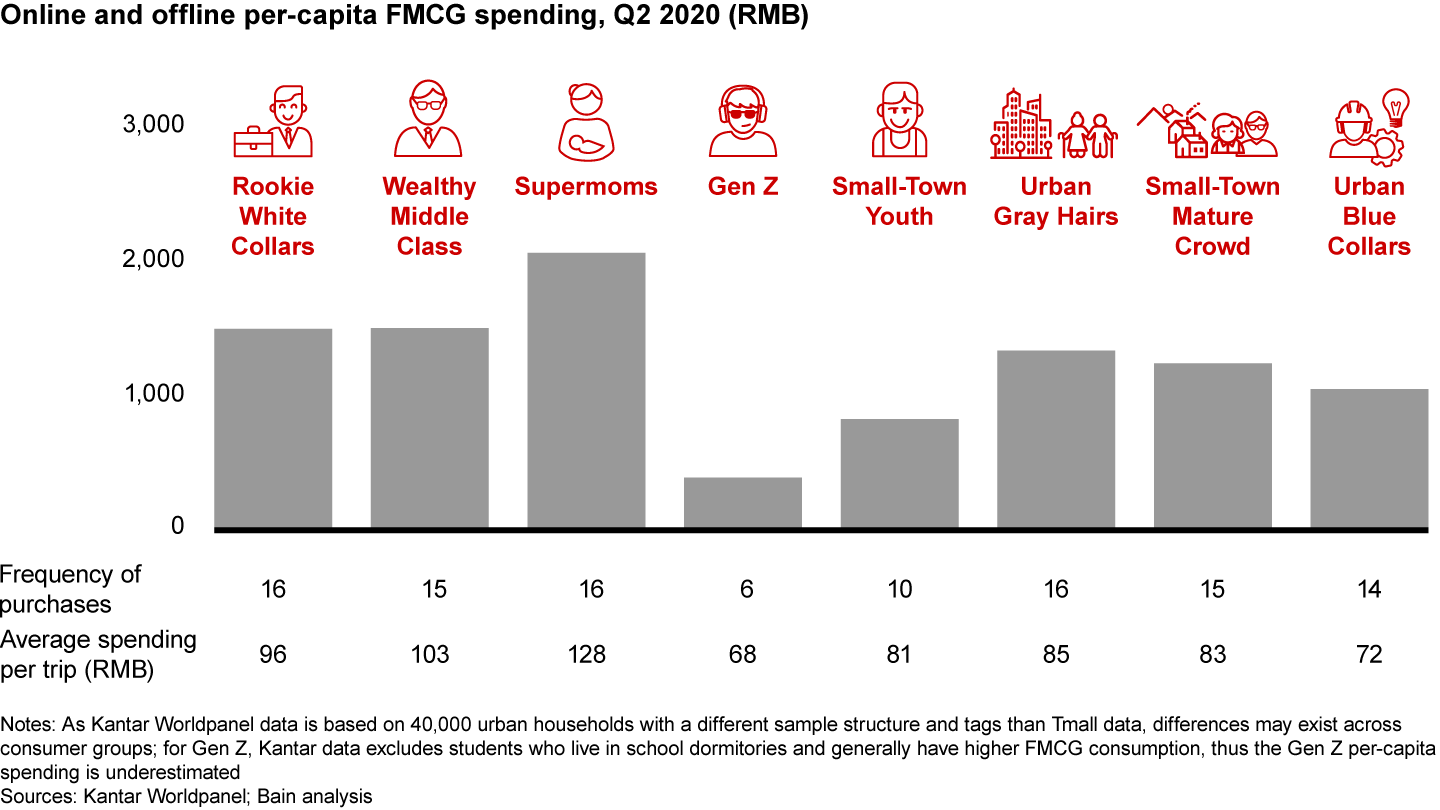
As the main shoppers for their families, Supermoms are the biggest consumers, spending an average RMB 2100 on FMCG in the second quarter of 2020, with the highest average number of trips and spending per trip (see Figure 14). At the opposite end of the spectrum are Gen Z consumers, who lag in both frequency and spending per trip.3

Different consumer segments showed distinct category preferences. As expected, consumers with babies―Supermoms, Small-Town Youth and Urban Blue Collar―spent more on products such as infant formula and diapers (see Figure 15). However, younger consumer segments are aggressively spending on their appearance. Makeup and skin care were top-three categories for Rookie White-Collars, Small-Town Youth and Gen Z.
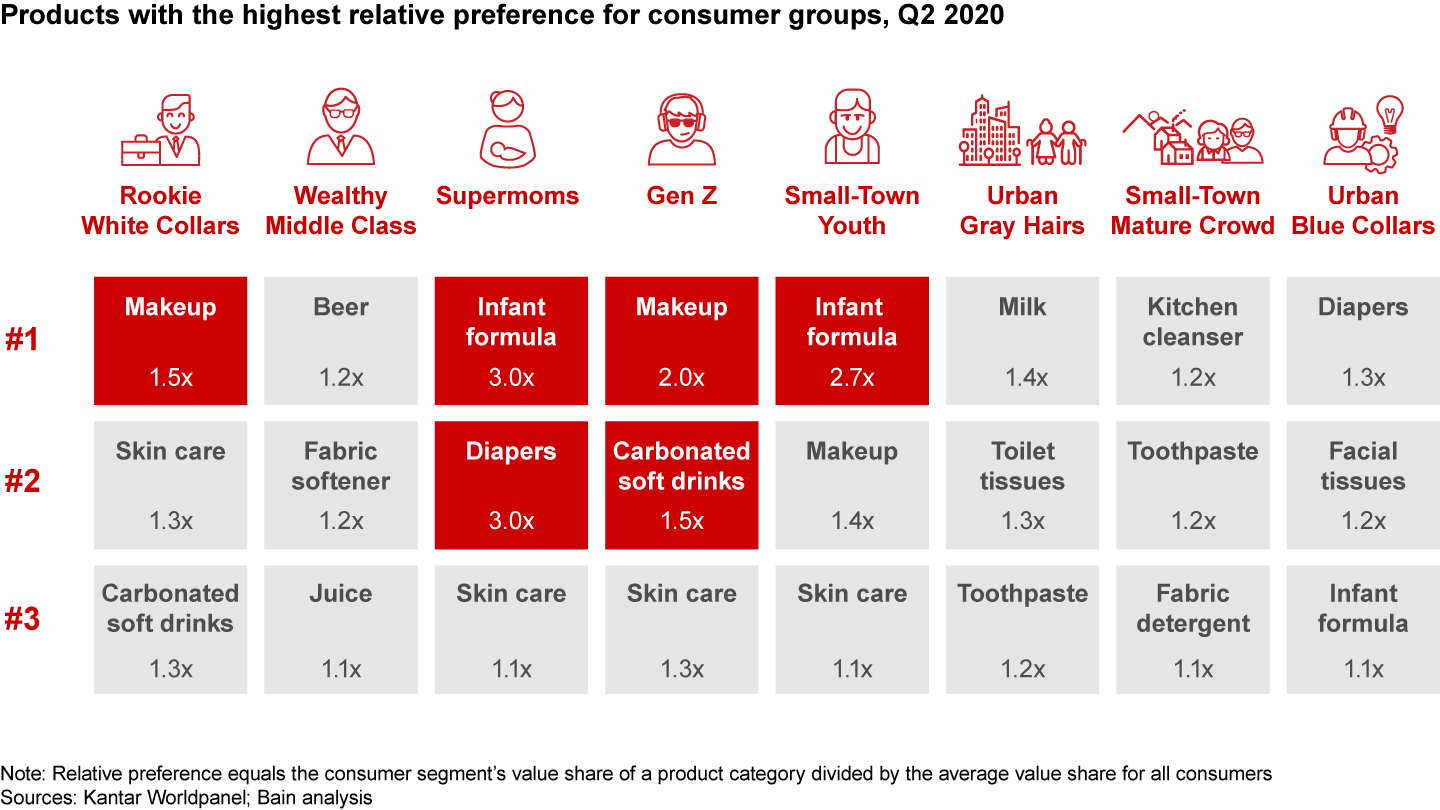

Rookie White Collars and Gen Z consumers are spending 1.3 to 1.5 times the average on carbonated soft drinks and 1.2 times the average for candy, a category that is benefiting from imports and such innovations as Uha brand fruit gummy candy. Meanwhile, older and lower-income consumer segments (Urban Gray Hairs, Small-Town Mature Crowd and Urban Blue Collars) are spending relatively more for daily essentials such as tissues, toothpaste and fabric detergent.
Finally, we analyzed the spending by these eight segments according to the channels in which they purchase (see Figure 16). E-commerce is preferred for most Tier 1 and Tier 3 city consumers. Hypermarkets are the No. 2 channel for high-income urban groups, while supermarkets and minimarkets are popular with young consumer segments. Wealthy consumers in top-tier cities―Rookie White Collars and Supermoms―are the core e-commerce consumers, with 40% of their spending online. When they choose offline channels, it typically is for the physical store experience. They patronize hypermarkets, their preferred offline channel, as a one-stop location for their family needs.
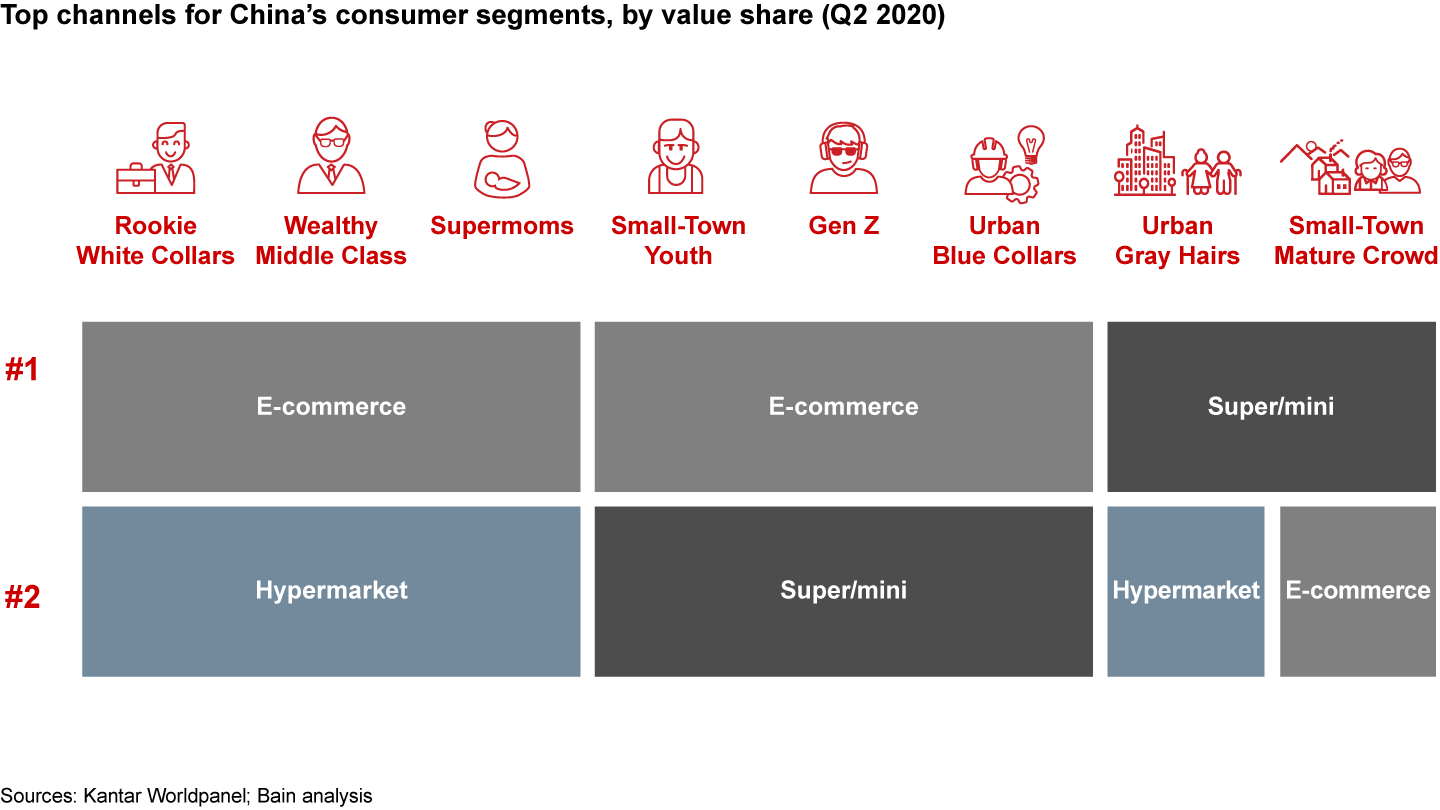

Younger and Urban Blue Collar consumers devote 30% of their spending to e-commerce. Younger consumers shop online for convenience and the availability of new items. Blue-collar shoppers are influenced by their middle-class counterparts’ online shopping behavior. Among offline channels, these consumers favor supermarkets and minimarkets for their convenience. For their part, Gen Z consumers prefer convenience stores.
The older consumer segments are the only ones that do not as regularly shop online; their e-commerce value share is a low 15% to 20%. When shopping offline, both of these older groups prefer supermarkets and minimarkets. As a sign of the infrequency of e-commerce shopping, Urban Gray Hairs spend more in hypermarkets than online, even if the gap is narrowing.
What to expect in 2021?
We will continue to track the ever-changing behavior of China’s shoppers. Here is how we see the FMCG consumer landscape evolving.
- Occasions and needs. The out-of-home category, a victim of Covid-19, will gradually recover. Even as it does, there still will be room for growth in categories for at-home consumption as well as for health- and wellness-related categories. Chinese consumers will continue to make purchases that will improve their well-being.
- Digitalization. We expect consumers to continue increasing their spending in online and O2O channels. China’s FMCG market will maintain its dynamic tradition. Short videos and livestreaming are likely to continue thriving, not only as traffic builders but as formidable forces in the retail landscape. Consumers will become more demanding in their need for anywhere, anytime shopping and a seamlessly integrated omnichannel shopping experience.
- Value proposition and price. As e-commerce steadily grows, so will the rate of heavy promotions. This will continue to serve as a challenge for most brands. The polarization trend of steady and simultaneous growth in both premium and mass categories will continue, making it critical for brands to compete with the right value proposition and price.
- Organization. Rapid and unexpected shifts like the Covid-19 pandemic shake up industries. The best consumer goods companies will become prepared with nimble organizations that will enable them to address changing needs faster and better than their competitors.
About the authors and acknowledgments
Bruno Lannes is a partner with Bain & Company’s Consumer Products and Retail practices, and is based in Shanghai. You can contact him by email at bruno.lannes@bain.com.
Derek Deng is a partner who leads Bain & Company’s Consumer Products practice in Greater China and is based in Shanghai. You can contact him by email at derek.deng@bain.com.
Jason Yu is managing director at Kantar Worldpanel Greater China. You can contact him by email at jason.yu@ctrchina.cn.
This report is a joint effort between Bain & Company and Kantar Worldpanel. The authors extend gratitude to all who contributed to it, especially Chris Miao, Joe Wang and Laura Chen from Bain; and Tina Qin, Robin Qiao and Lorna Peng from Kantar Worldpanel.

Kantar—Understand People, Inspire Growth
As part of Kantar, the world’s leading marketing data and analytics company, Worldpanel provides brands and retailers with a unique, 360-degree understanding of consumer behaviour across the globe. We are shopper-centric, continuously monitoring the purchase and usage behaviour through the largest omnipanel in the world to shape the brands of tomorrow by better understanding people everywhere. With unparalleled datasets, pioneering technology and expert analysts, we partner with brands and retailers of all sizes, empowering them to reimagine what’s possible, and change the landscape to create a better, healthier, more sustainable and inclusive world. In the China market, the Worldpanel division is one of the services in CTR, covering over 100 FMCG categories, 50,000+ brands and 100+ retailers, among many others.

Coronavirus
The global Covid-19 pandemic has extracted a terrible human toll and spurred sweeping changes in the world economy. Across industries, executives have begun reassessing their strategies and repositioning their companies to thrive now and in the world beyond coronavirus.
참고
- These 26 categories are (a) packaged food: biscuits, chocolate, instant noodles, candy, chewing gum and infant formula; (b) beverages: milk, yogurt, juice, beer, ready-to-drink tea, carbonated soft drinks and packaged water; (c) personal care: skin care, shampoo, personal wash, toothpaste, makeup, hair conditioner, diaper and toothbrushes; and (d) home care: toilet tissues, fabric detergent, facial tissues, kitchen cleanser and fabric softener.
- These 19 categories are soybean milk, mouthwash, oyster sauce, pet food, kitchen rolls, ready-to-drink coffee, hair colorant, quick soup, functional drinks, sesame sauce, hamburger, monosodium glutamate, soft cake, foreign spirits, leather care products, napkins, Chinese spirits, cooking oil and nutrient supplements.
- As Kantar Worldpanel data is based on 40,000 urban households with a different sample structure and tags than Tmall data, differences may exist across consumer groups; also for Gen Z, Kantar data excludes students who live in school dormitories and generally have higher FMCG consumption as living independently from family, thus Gen Z’s per-capita spending here is underestimated.