レポート

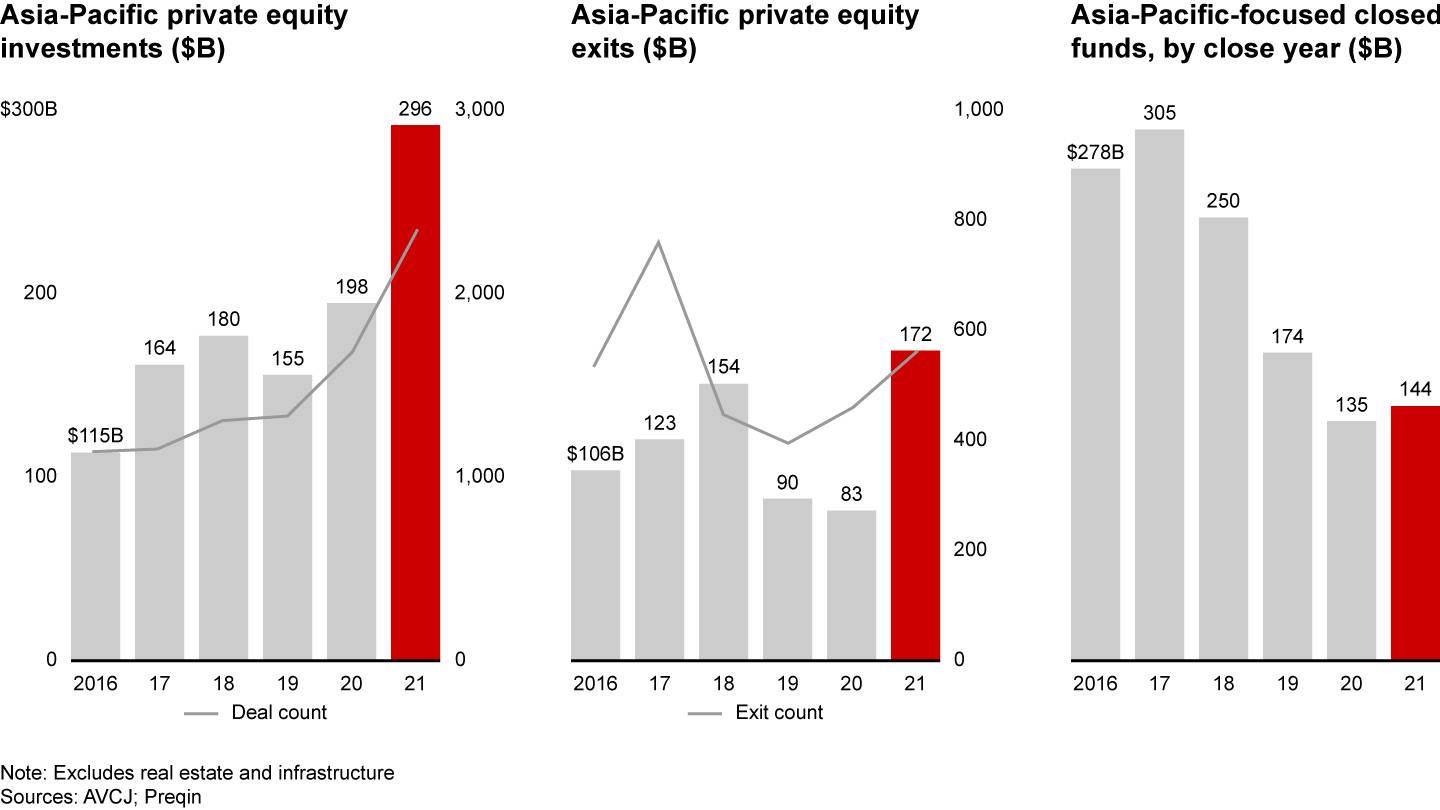
Covid-19 loomed over the global economy for a second year running, but Asia-Pacific private equity investors hardly noticed. The region’s economies grew at a healthy clip, especially in the first half of the year. That set the stage for robust dealmaking and spurred Asia-Pacific investment value to a record $296 billion (see Figure 1). The quick rebound resulted partly from rapid vaccination rollouts that helped Asia-Pacific economies recover during the first half of the year, before the Omicron variant prompted renewed lockdowns and other precautions.
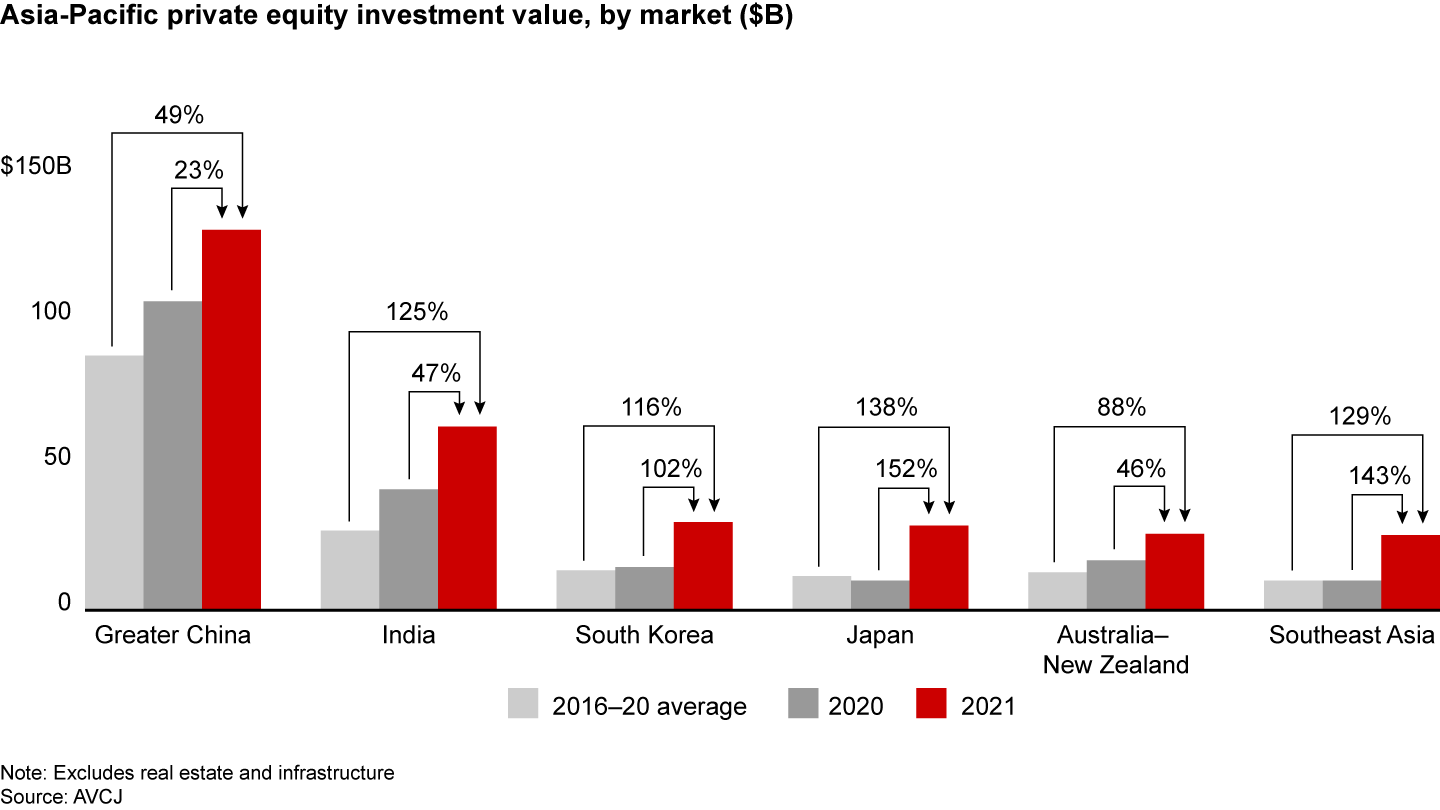
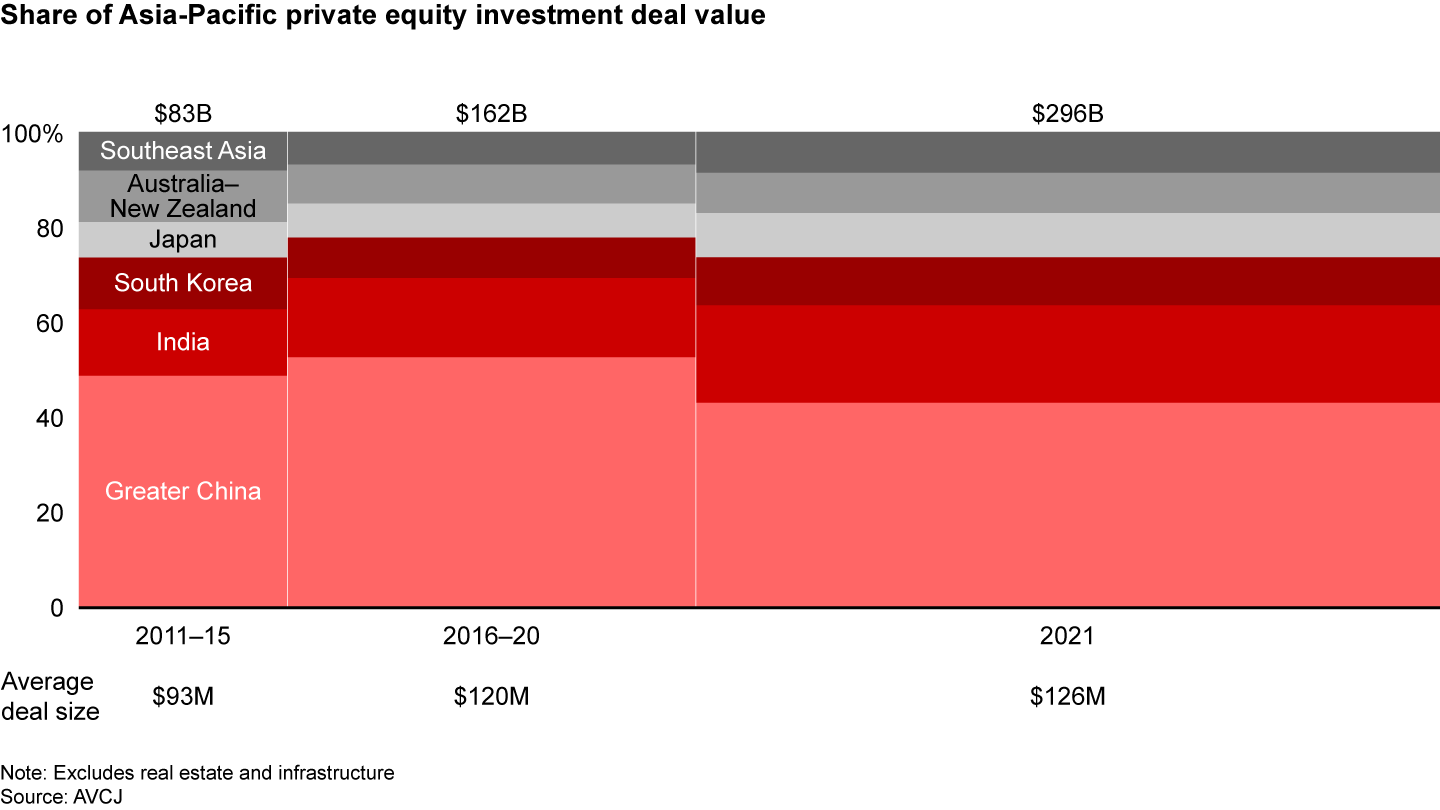
Each country in the region set new investment highs, and deal value in Japan, Southeast Asia, and South Korea more than doubled. Investments in Greater China and India represented 43% and 20% of total deal value, respectively, but breaking with the pattern in previous years, India grew faster than China in 2021, increasing its share of the overall market.
Asia-Pacific's share of global assets under management (AUM) rose to 30% at the end of 2021. Over the past decade, AUM focused on this region grew 2.4 times faster than for North America and 3.0 times faster than for Europe (which Asia-Pacific passed for second place in 2018).
Investors’ demand for Internet and technology companies was strong, as in years past. The Internet and tech sector contributed 48% of total deal value. Across the region, the number of unicorns—privately held start-ups with a value of $1 billion or more—rose to 277 in 2021, up 61% over the previous year. The pool of Asia-Pacific unicorns, which more than quadrupled in the past 5 years, now represents more than 50% of the world total.
After 2 years of sharp declines, exits rebounded vigorously. Total exit value for the region more than doubled, reaching $172 billion. Initial public offerings (IPOs) were still the most popular exit channel, buoyed by strong stock market performances in South Korea and Japan. In India, the value of all IPOs set a record.
The amount of dry powder—committed but unallocated capital waiting to be invested—in Asia-Pacific-focused funds reached a new high of over $650 billion, a level that will fuel investment activities in the region for years to come. Fund-raising activities picked up slightly, reversing three consecutive years of decline. Returns rose and private equity again outperformed the region’s public markets by 4 to 6 percentage points across 5-, 10-, and 20-year horizons.
Despite a remarkable overall performance for the Asia-Pacific private equity market last year, there are several reasons for caution in 2022 and beyond. The second half of 2021 had already presented new challenges, with Covid-19 outbreaks leading to continued lockdowns and travel bans, roiling markets, and slowing the pace of dealmaking and exits. Now Russia’s invasion of Ukraine promises to deepen the global uncertainty and disruption.
China’s private equity market, in particular, may lose momentum after years of superheated growth. Global LPs are increasingly concerned about China’s slowing economic growth and increasing investment risk, given rising geopolitical tensions and tighter industry regulations. Reflecting that concern, Greater China-focused fund-raising in the second half of 2021 slowed significantly from the first half.
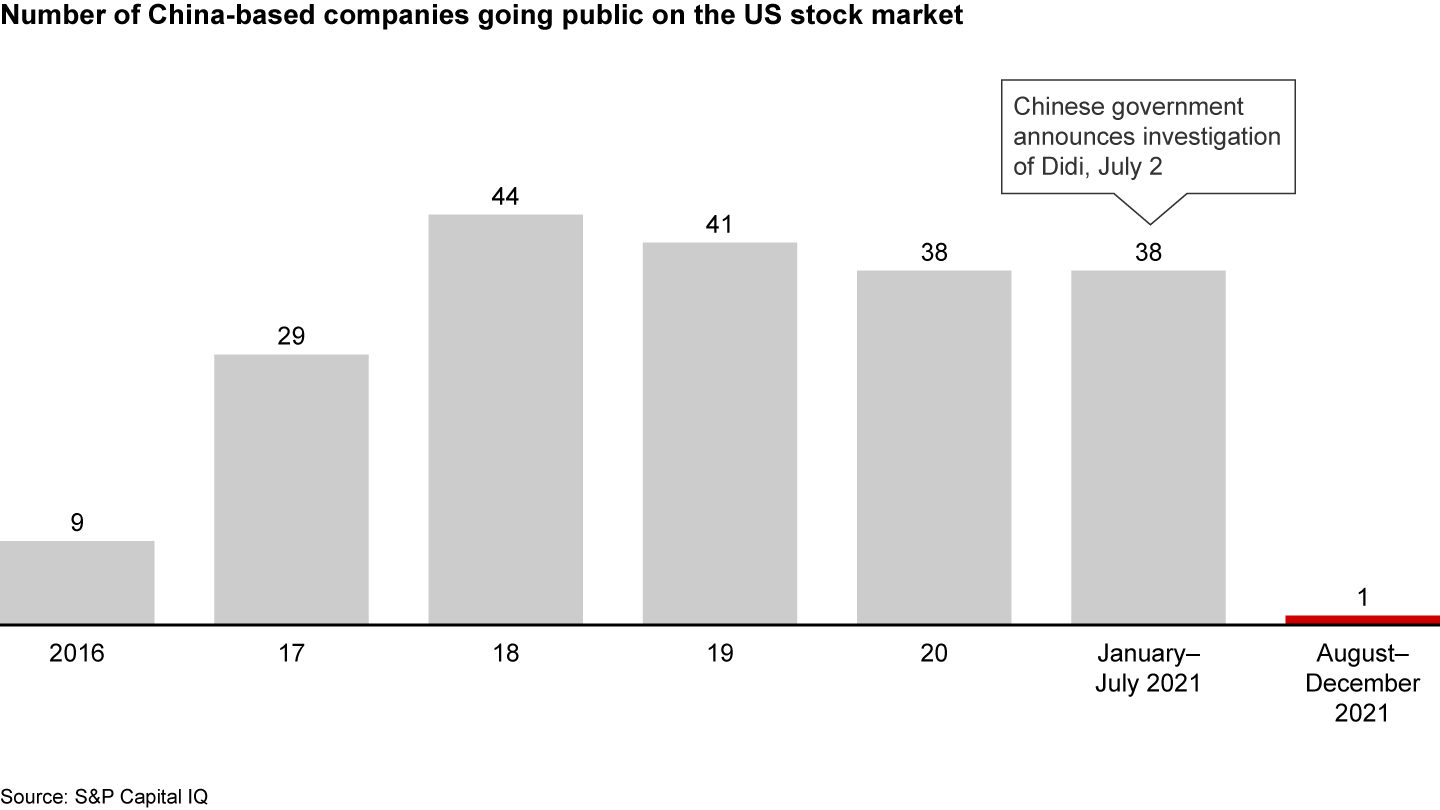
Political and economic uncertainty also cast a cloud over the region’s exit market in the second half, particularly China’s. Exit value fell and the value of IPOs dropped 50% from a year earlier. China’s decline pulled down the region’s totals, even though the exit value in all Asia-Pacific markets apart from China rose, compared with 2020. Greater China’s overall exit value in the second half declined to 30% from the first half. And the closing of the US IPO channel for Chinese companies dramatically reduced the number of Chinese firms listing in the US in the second half.
More than 60% of Asia-Pacific general partners (GPs) remain confident about the region’s macroeconomic outlook in 2022, according to Bain’s annual Asia-Pacific survey of GPs. However, only 35% of China GPs are confident, a sharply divergent view that may signal a fundamental change in China’s performance in 2022. China’s slowing growth, reflected in consumption data in the fourth quarter of 2021, and a more sober assessment of the outlook for the country’s Internet and technology companies, could create a more cautious investment climate in 2022. Exits will be more challenging, and China-based companies will need to find alternative exit channels to the US IPO market. Negative sentiment among global limited partners (LPs) has also slowed Greater China-focused fund-raising.
As investors grow more cautious toward China and seek deals elsewhere in the region, India's private equity market may benefit. China and India are similar in population, growth rates, and state of development. For Asia-Pacific-focused funds attracted to the Internet and tech sector, India’s increasing digital penetration and strong domestic IPO market are likely to be a powerful lure.
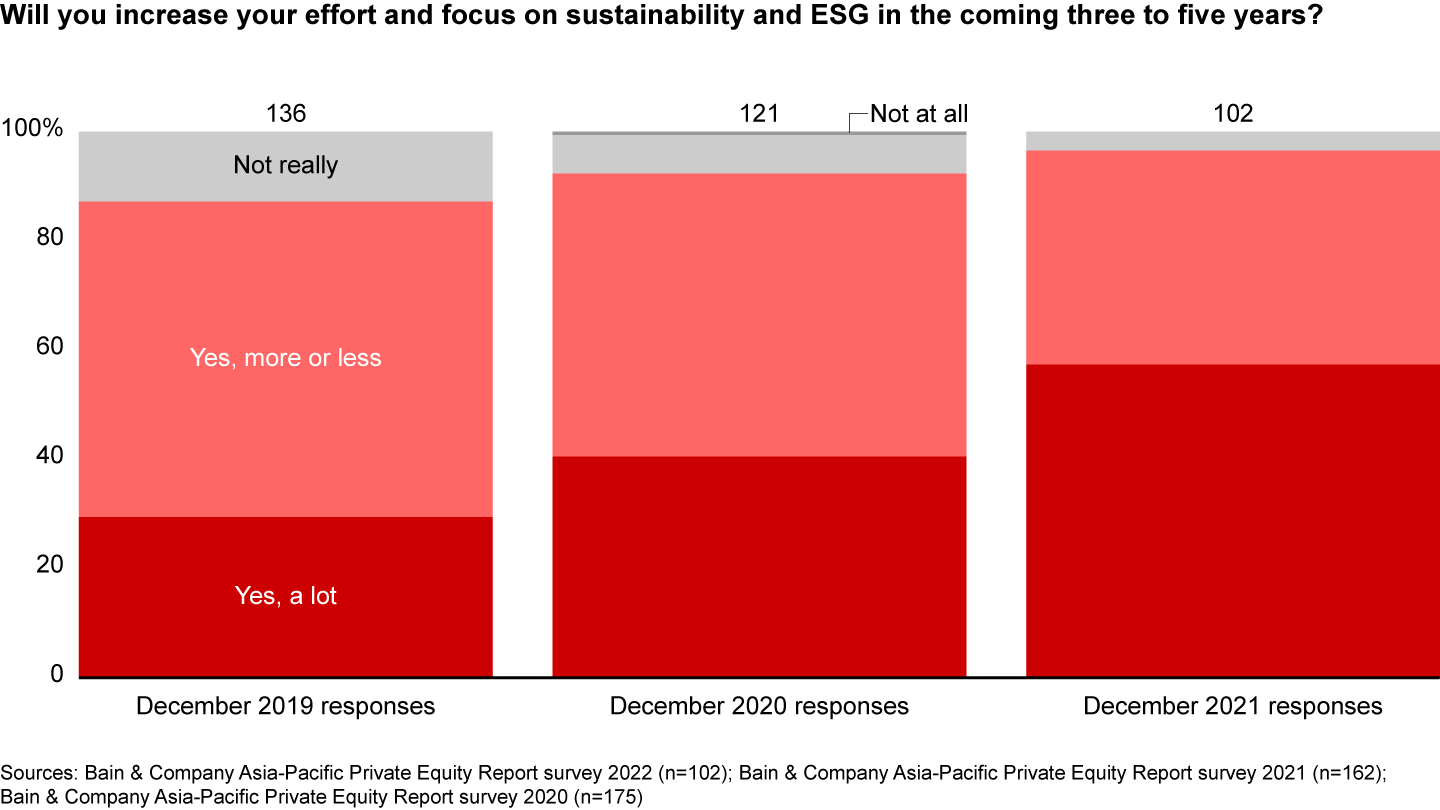
High valuation continues to be Asia-Pacific GPs’ No. 1 concern. To deliver strong returns, successful funds increasingly take a comprehensive approach to value creation. And as governments churn out new regulations for a more sustainable economy, leading funds also are incorporating environmental, social, and corporate governance (ESG) criteria into due diligence and value creation plans. According to our 2022 survey of Asia-Pacific GPs, 57% said they plan to increase their focus on sustainability and ESG significantly in the coming 3 to 5 years, compared with fewer than 30% 2 years ago.

What happened in 2021?
Undaunted by the global pandemic and supply chain disruptions, Asia-Pacific private equity investors closed a record number of deals, some still making up for lost time in 2020. Investment and exit value set new highs for the region, and fund-raising rose slightly over 2020. Deal value soared to a record $296 billion, up 50% over 2020 and 82% over the previous five-year average.
Remarkably, records for deal value were set throughout the region (see Figures 2 and 3). Greater China continued to dominate the Asia-Pacific market, generating $128 billion in deal value, or roughly 43% of the overall investment in the region. India ranked second with $61 billion in deal value. A surge in big-ticket Internet and tech deals boosted India’s share of the overall market to 20%. In a break with recent years, the rate of investment growth in India outpaced Greater China: Deal value in India rose by 47%, compared with 23% in China.
South Korea’s deal value more than doubled to nearly $30 billion, buoyed by four megadeals—a record count for the country. PE funds active in Korea were increasingly focused on tech investments. Japan’s investment value rose 150% over 2020, with a large contribution from deals in manufacturing and industrials.
Investments in Southeast Asia also surged. Five megadeals accounted for 33% of total deal value, which was up 143% compared with 2020. In Australia and New Zealand, investment value rose 46% year-on-year.
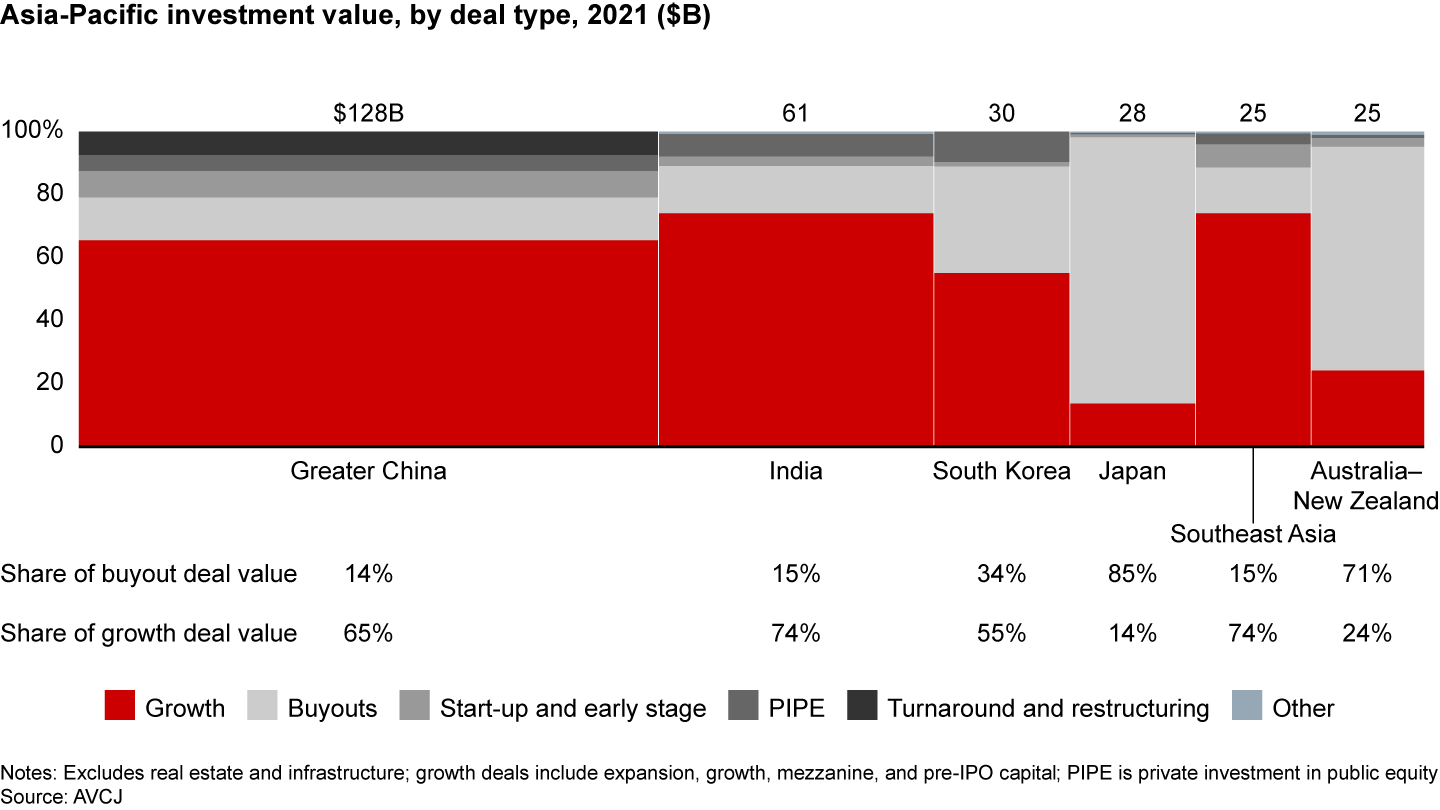
Growth deals made up 59% of Asia-Pacific deal value and were the dominant deal type in four of the region’s six markets, including Greater China, India, South Korea, and Southeast Asia (see Figure 4). Buyouts remained the most popular deal type in Japan and Australia–New Zealand. The overall proportion of total deal value represented by buyouts remained little changed across the region for the fourth year in a row at about 25%.
Among buyouts, many deals were carve-outs from conglomerates. The largest deals in 2021 included Hitachi Metals ($7.5 billion), Mead Johnson ($2.2 billion), and CVC–Shiseido ($1.5 billion), all of which were carve-outs.
Carve-outs have become more frequent as companies adapt to significant market changes, including new consumer behaviors and competition from local insurgents. As they grapple with disruptions triggered by the Covid-19 pandemic, leadership teams are increasingly looking at strategies that enable them to focus on their core businesses, improve operational efficiencies, and boost profits.
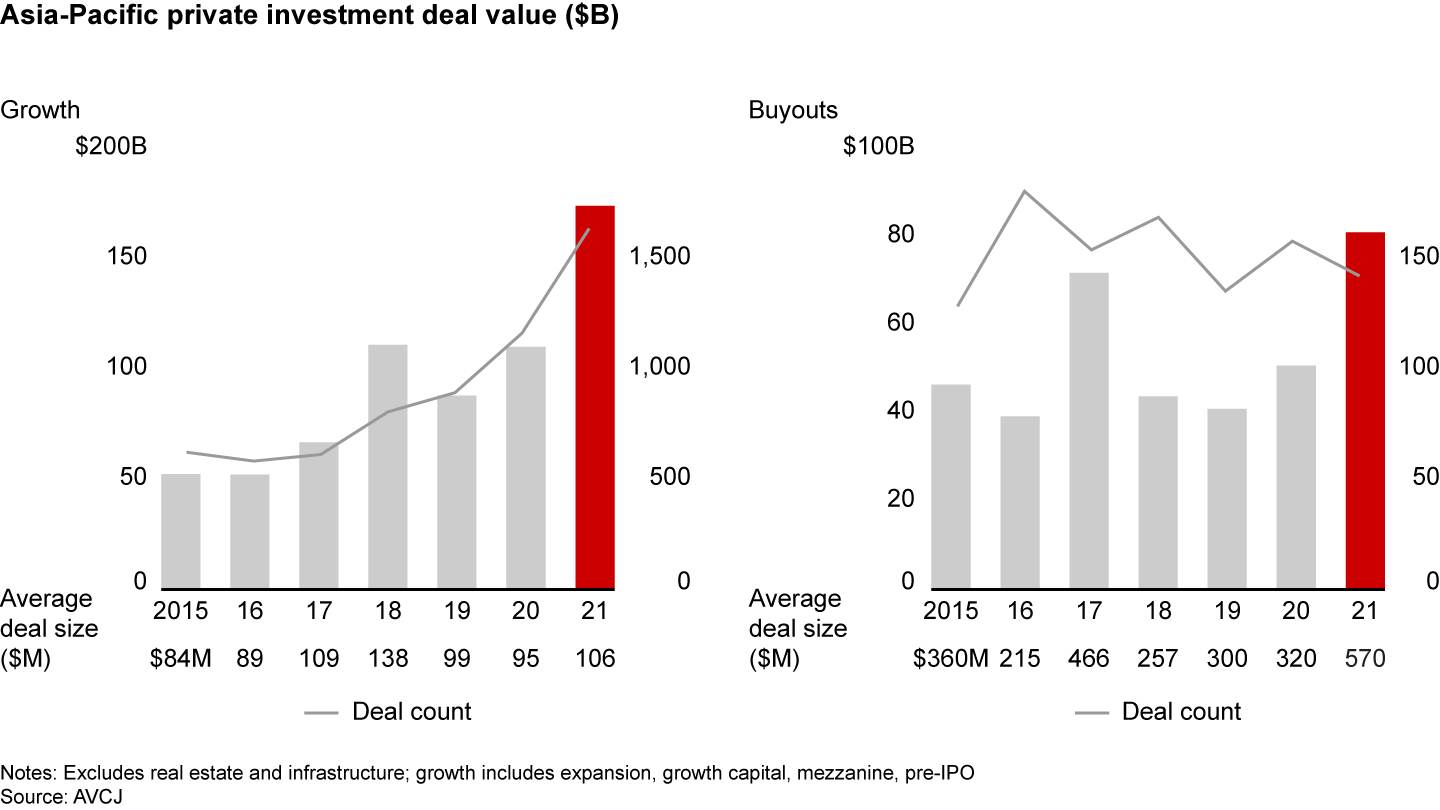
The size of the average buyout deal rose 78% to $570 million from $320 million a year earlier, fueled by megadeals and increased activity in Japan, Australia–New Zealand, and South Korea. The size of the average growth deal was up 12% to $106 million (see Figure 5).
Sector view: Internet and tech lead the way
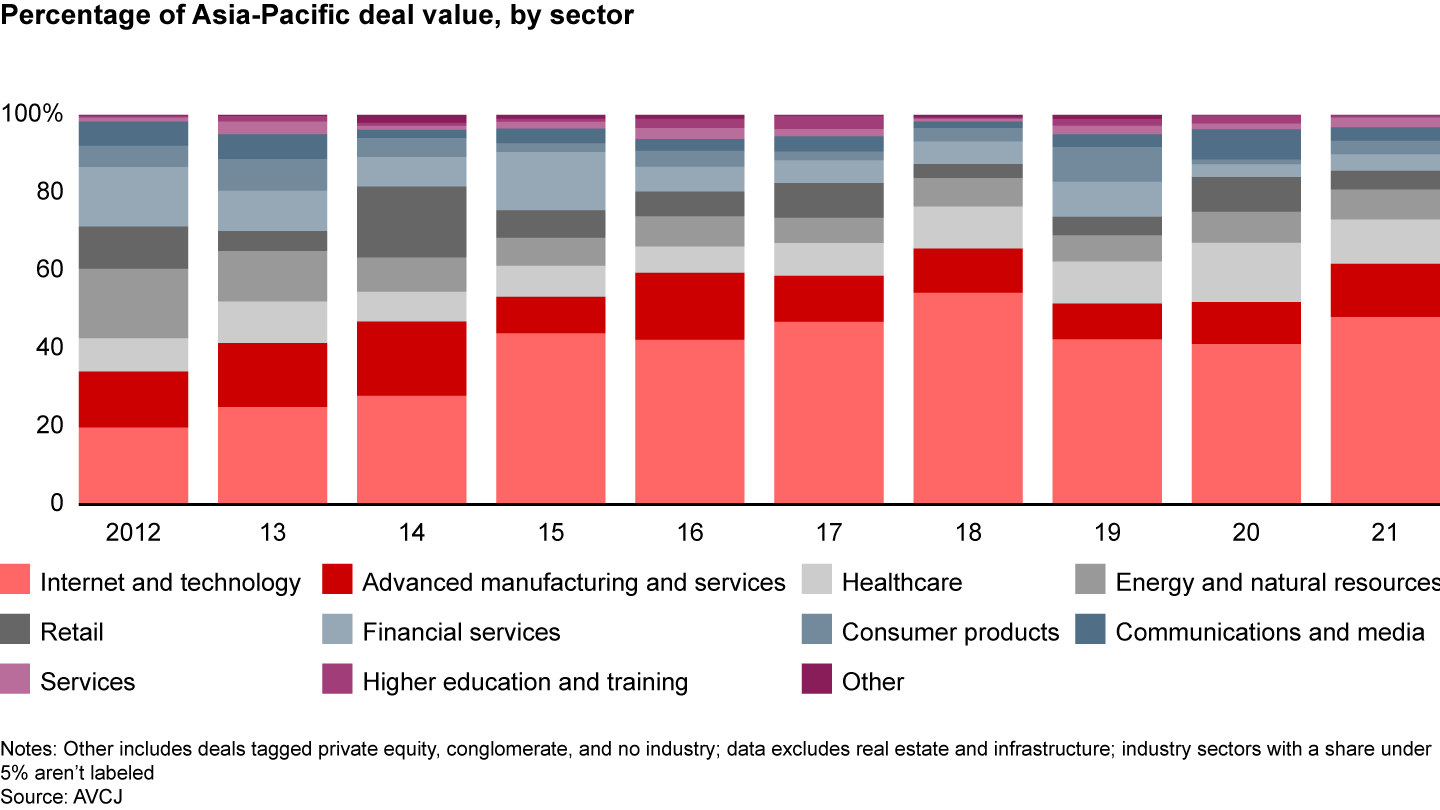
For the 10th year running, the Internet and technology sector attracted the largest share of capital. Internet and tech deals accounted for 48% of the overall Asia-Pacific deal activity by value, up slightly over the previous year. Together, technology and advanced manufacturing and services represented 62% of total deal value (see Figure 6).
The Internet and technology sector accounted for 62% of overall deal value in India and was the largest sector by deal value in Greater China, South Korea, and Southeast Asia. The trend toward digitalization, already strong in Asia-Pacific countries, accelerated following disruptions linked to the pandemic, including the work-from-home trend. E-commerce and online services were among the most sought-after tech companies. B2B sectors like semiconductors and software were also popular. The region’s pool of fast-growing Internet and tech unicorns—start-ups worth $1 billion or more—rose to 277 by year-end, an increase of more than 60% over 2020, according to CB Insights. Asia-Pacific’s share of the global count of unicorns was 54% at the end of 2021.
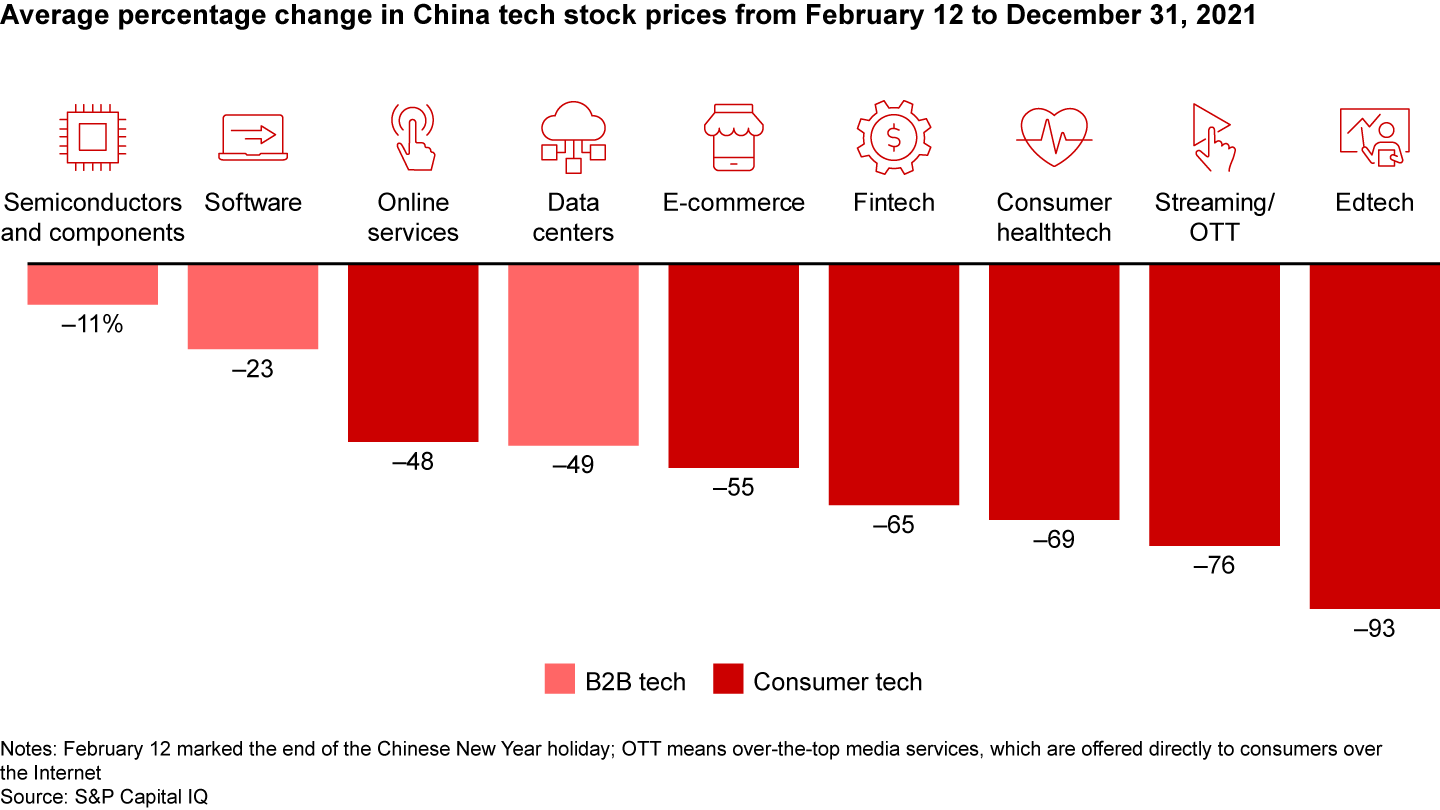
While technological innovation is strong across the region, Asia-Pacific governments have begun imposing regulations that could slow the growth of some tech companies. In an effort to promote health and well-being in children, for instance, China’s authorities have introduced policies to curb online gaming, for-profit tutoring, and tech addiction. The country has also established policies to restrict unfair pricing, monopolies, and false advertising, and implemented regulations to improve cybersecurity, data sovereignty, and data security. Increased controls on the tech sector battered China tech stocks in 2021, especially consumer-focused and US-listed companies (see Figure 7).
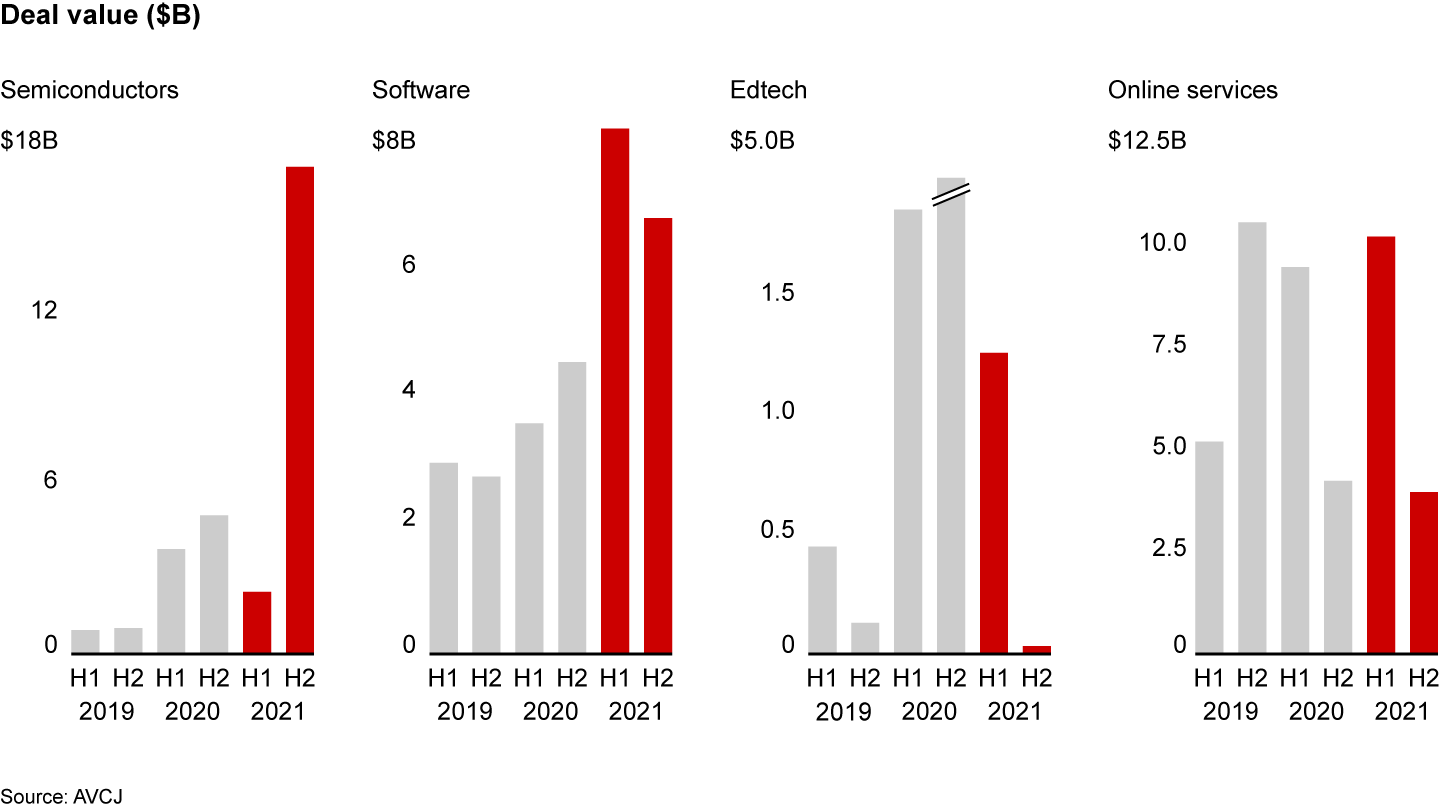
Not surprisingly, deal value in the Internet and technology sector barely grew in the second half of the year. Investment in education technology in Greater China dropped to only $30 million in the second half. In 2020, by contrast, four megadeals helped the region’s e-learning deal value climb to $6.7 billion, as investors stampeded into that burgeoning field. However, B2B tech like semiconductors and software, including artificial intelligence, rose significantly in the second half. This investment shift within the tech sector is likely to continue (see Figure 8).
India’s government has launched initiatives to encourage businesses to go digital. However, companies and investors still face significant uncertainty about the direction of regulatory reforms in specific sectors. In February, India announced a new Internet governance framework to manage social media platforms. The government now is expected to implement a personal data protection bill that will regulate how big technology firms operate in the country.
Across Southeast Asia, governments have launched initiatives to support the growth of tech companies while tightening regulations and increasing taxes on them. Thailand offers technology firms allowances and exemptions on visas and taxes under its Thailand 4.0 scheme, for example. Indonesia has passed legislation requiring tech companies with online services to pay value-added tax on local sales, even when purchases are initiated offshore. Governments also are seeking greater oversight over digital banking by issuing licenses. After Singapore introduced digital banking licenses at the end of 2020, Philippines followed in 2021, and Malaysia announced plans to do so in early 2022.
To ensure target companies don’t face regulatory hurdles or other policy-related disadvantages, GPs will need to be more scrupulous in their attention to regulations, macroeconomic policies, and their indirect impact on the industry.
After Internet and tech, the most sought-after sectors in the Asia-Pacific region were advanced manufacturing and services and healthcare, which garnered 14% and 11%, respectively, of total investment value. Investment in advanced manufacturing and services rose sharply over the previous 2 years, propelled by the $7.5 billion Hitachi Metals sale, two rounds of J&T Express funding, and more than a dozen deals exceeding $500 million.
At the same time, the increase in ESG regulations across the region has created a significant investor focus on companies with products and services linked to the environment, renewable energies, and clean technologies. Investments in clean technology rose 230% in 2021, following a 106% jump in 2020. The renewables sector generated big investments, including $3 billion in funding for SVolt and Sequoia Capital's $1 billion investment in China's Envision Group. More than 95% of private equity investors plan to increase their focus on ESG-related issues in the coming 3 to 5 years, encouraged by investor demand, according to our 2022 Asia-Pacific GP survey.
Competition intensified
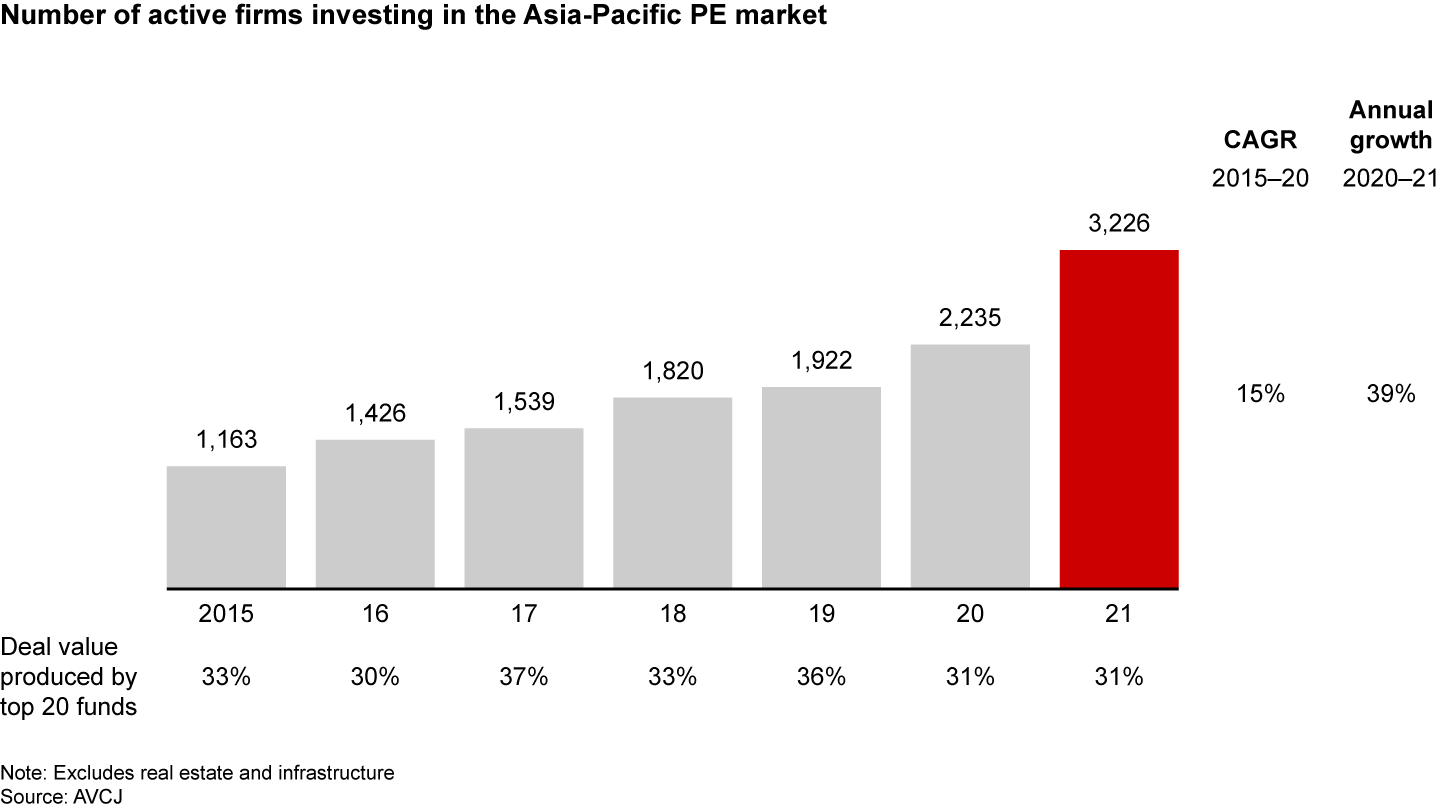
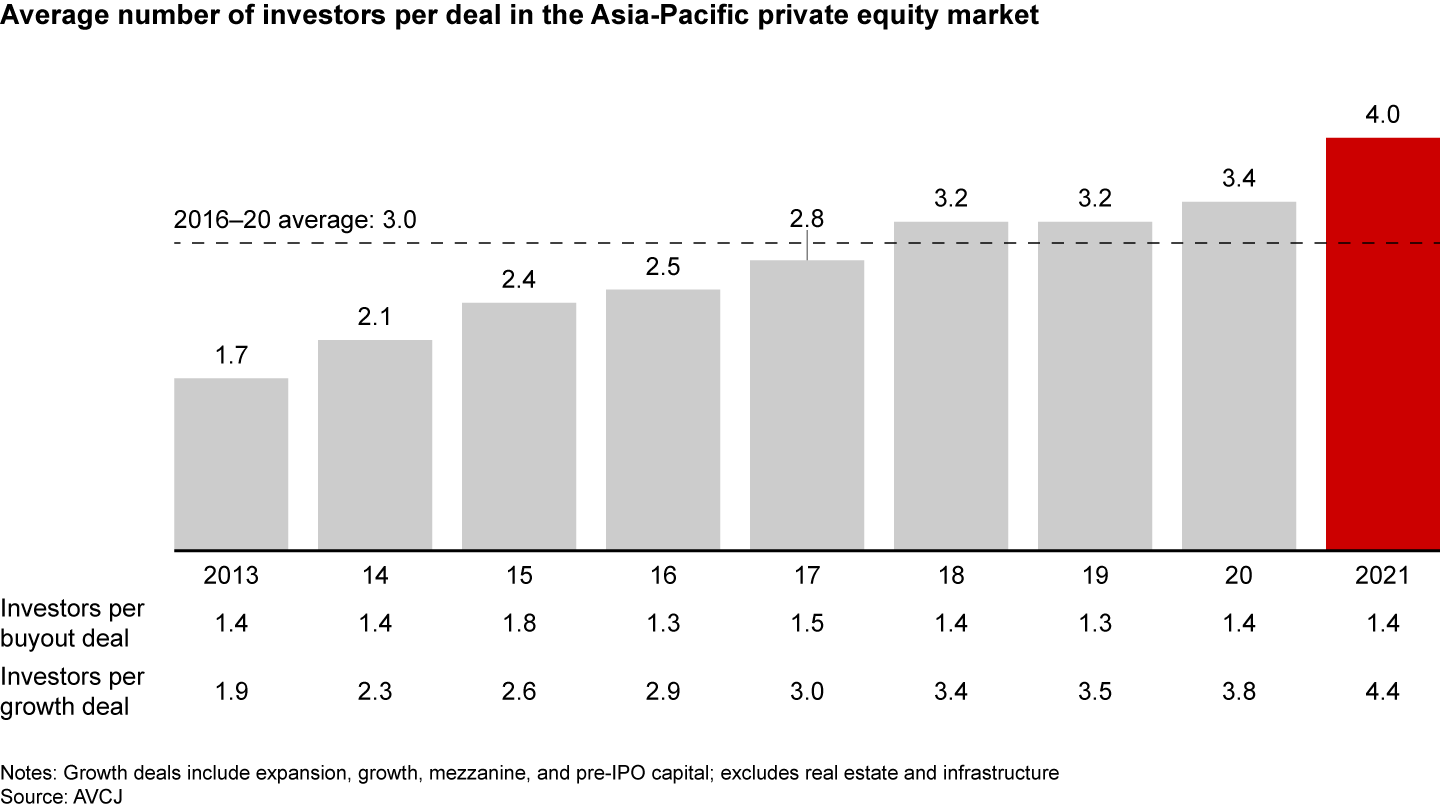
The number of active investors in the region continued to climb in 2021, rising 39% to more than 3,200, compared with a compound annual growth rate of 18% during the past 5 years. However, deal value remained relatively concentrated, with the top 20 funds involved in almost one-third of deals by value, slightly lower than in 2017 to 2019 (see Figure 9). Funds continued the trend of teaming up to make the most of their complementary expertise and resources, while reducing risk. The average number of investors per deal increased to a record 4.0, up 33% from the prior 5-year average. Growth deals topped the list with an average 4.4 investors per deal (see Figure 10).
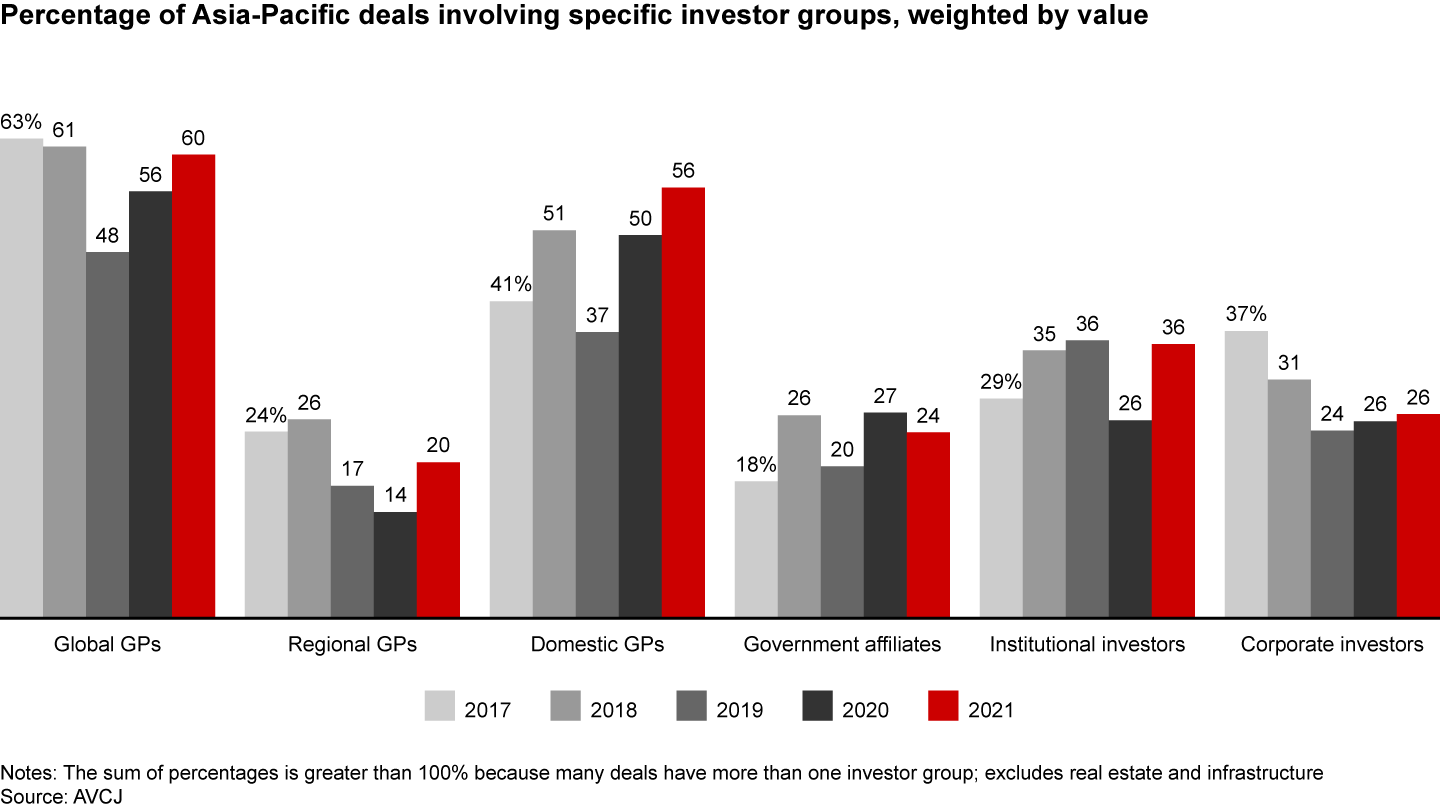
Global GPs, with their access to larger pools of expertise and worldwide networks, and domestic GPs, with their deep local expertise and presence, remained by far the most active investors in the region, with 60% and 56% shares of deal involvement, respectively (see Figure 11). Forty-six percent of GPs view large global PE firms as the biggest threat, according to our survey.
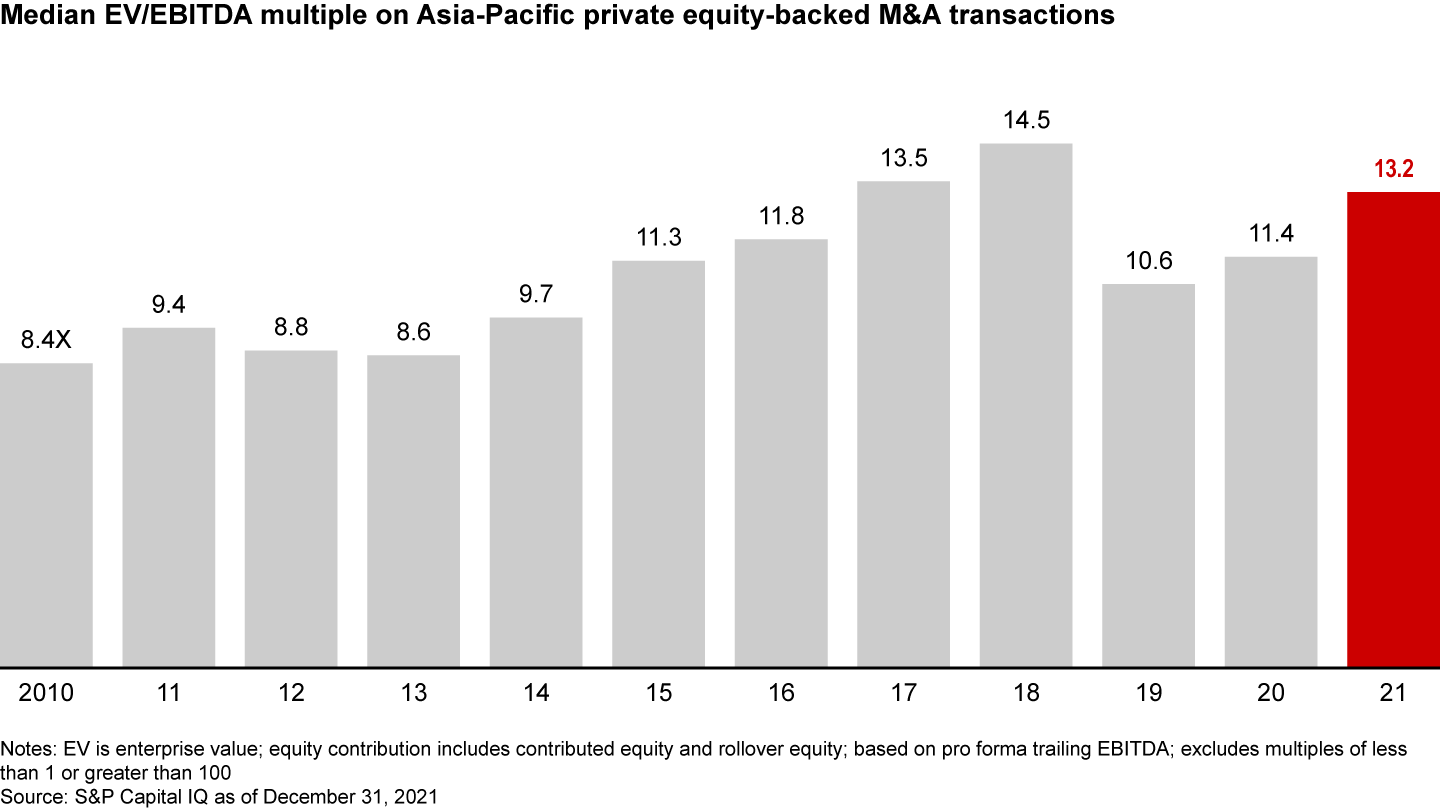
Deal multiples—the ratio of enterprise value to EBIDTA—rose for the second year in a row to 13.2, after a sharp fall to 10.6 in 2019 (see Figure 12). Of the GPs we surveyed, 72% view higher valuations as the industry’s major concern—a top worry for several years running and 9 percentage points higher than a year earlier. More than 60% of GPs believe valuations have risen in their region, while 35% think valuations will continue climbing in the next 2 years.
Several factors contribute to high valuations across the Asia-Pacific region. With record dry powder at their disposal, PE firms are chasing a limited number of high-quality companies. That increase in demand has pushed up asset valuations. Concurrently, policy uncertainties and geopolitical tensions have reduced the pool of attractive deals. Technology and healthcare deals, in particular, continue to generate unexpectedly high valuations fueled by investors’ steady demand for investment opportunities. Finally, abundant global liquidity is inflating company valuations across all markets.
While these factors have given sellers attractive valuations, it increases the pressure on investors to identify value creation opportunities during due diligence. As expansion of multiples slows, boosting top-line growth and cost efficiency are vital to success.
Exits: A much-needed rebound
Exits revived after 2 consecutive years of decline, reaching $172 billion, up more than 100% over 2020 and 54% over the previous 5-year average (see Figure 13).
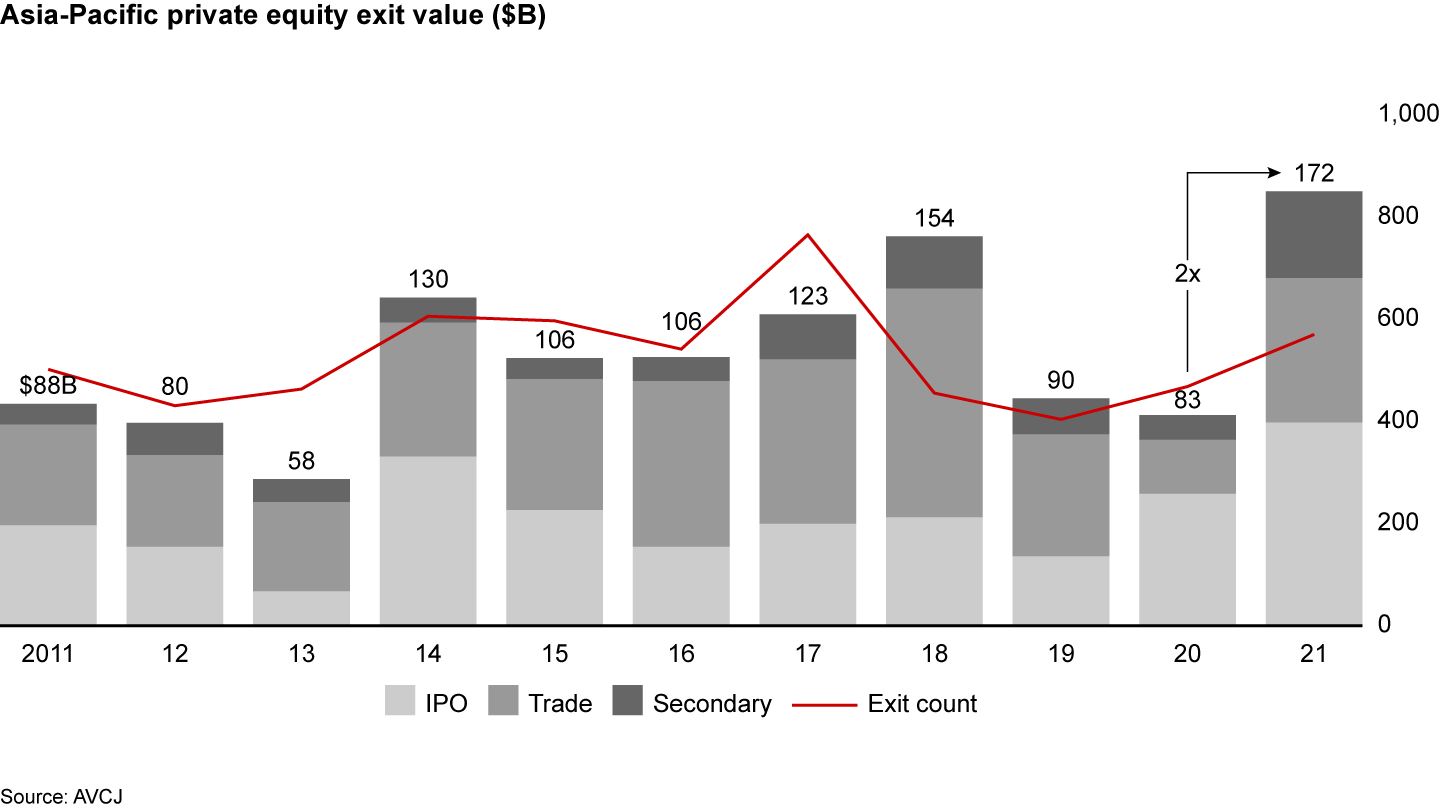
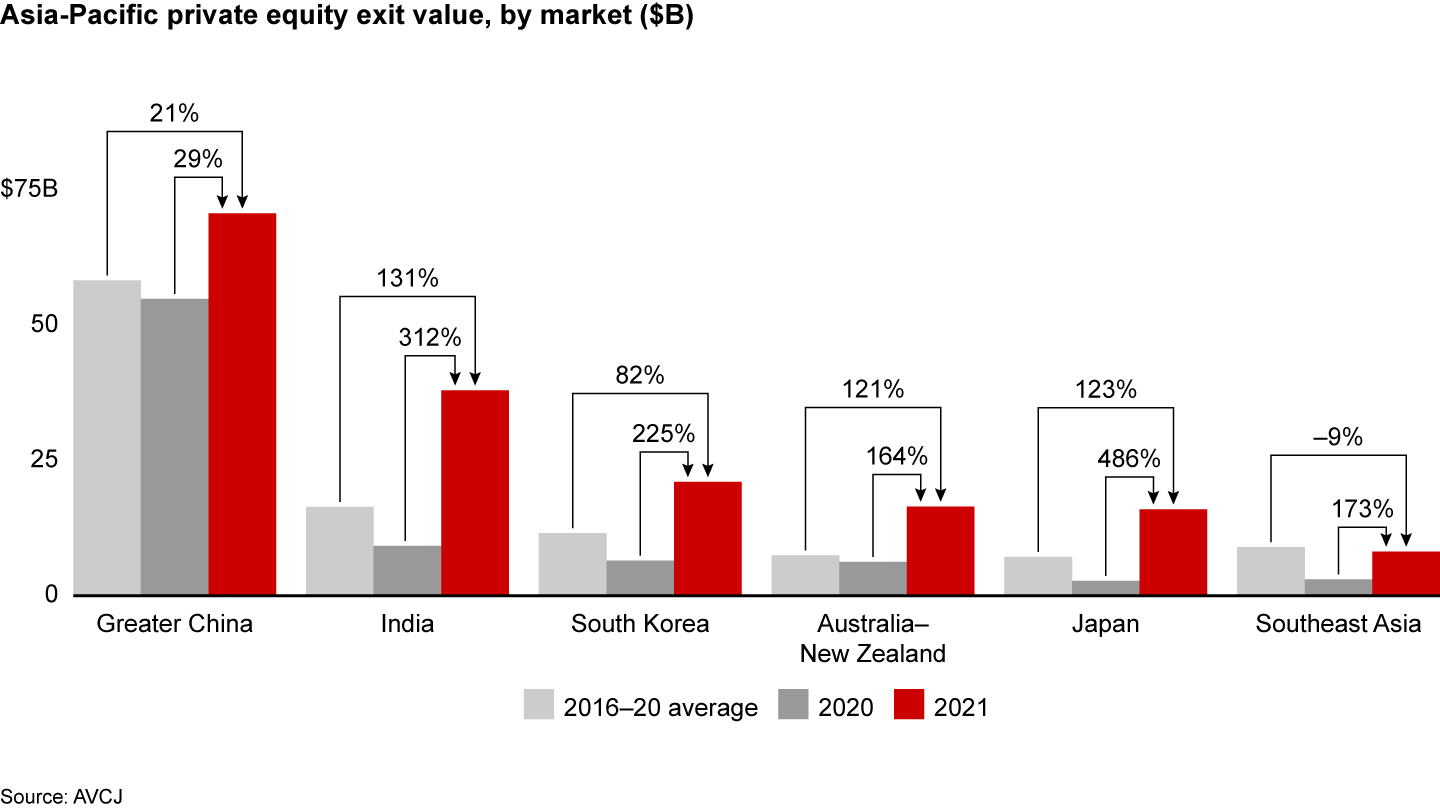
Not only did the exit activity gain strong momentum, the average exit size rose 38% over the previous five-year average. Exits rebounded across most of the region, and big-ticket megaexits fueled increases of 200% or more in exit value in India, Japan, and South Korea (see Figure 14).
Half of the GPs we surveyed said that the exit environment was less challenging than in 2020, and more than 60% saw at least some, if not lots of, attractive exit opportunities. However, 45% cited Covid-19 as the principal reason for less-than-ideal exit opportunities, down from 68% in 2020.
IPOs remained investors’ preferred exit channel, accounting for almost half (47%) of the overall exit market. But trade and secondary sales surged, given the lack of momentum in public markets that limited multiple expansion. In particular, China-based companies faced growing obstacles to listing on US stock markets, including increased disclosure requirements.
The top 20 exits by value in 2021 included eight trade sales (compared with 5 in 2020) and 4 secondary sales (2 in 2020). Trade sales include the $4.7 billion BillDesk deal. Top secondary market sales include the $3.5 billion Accordia Golf deal, the $3 billion Hexaware deal, and the $2.8 billion Tricor deal.
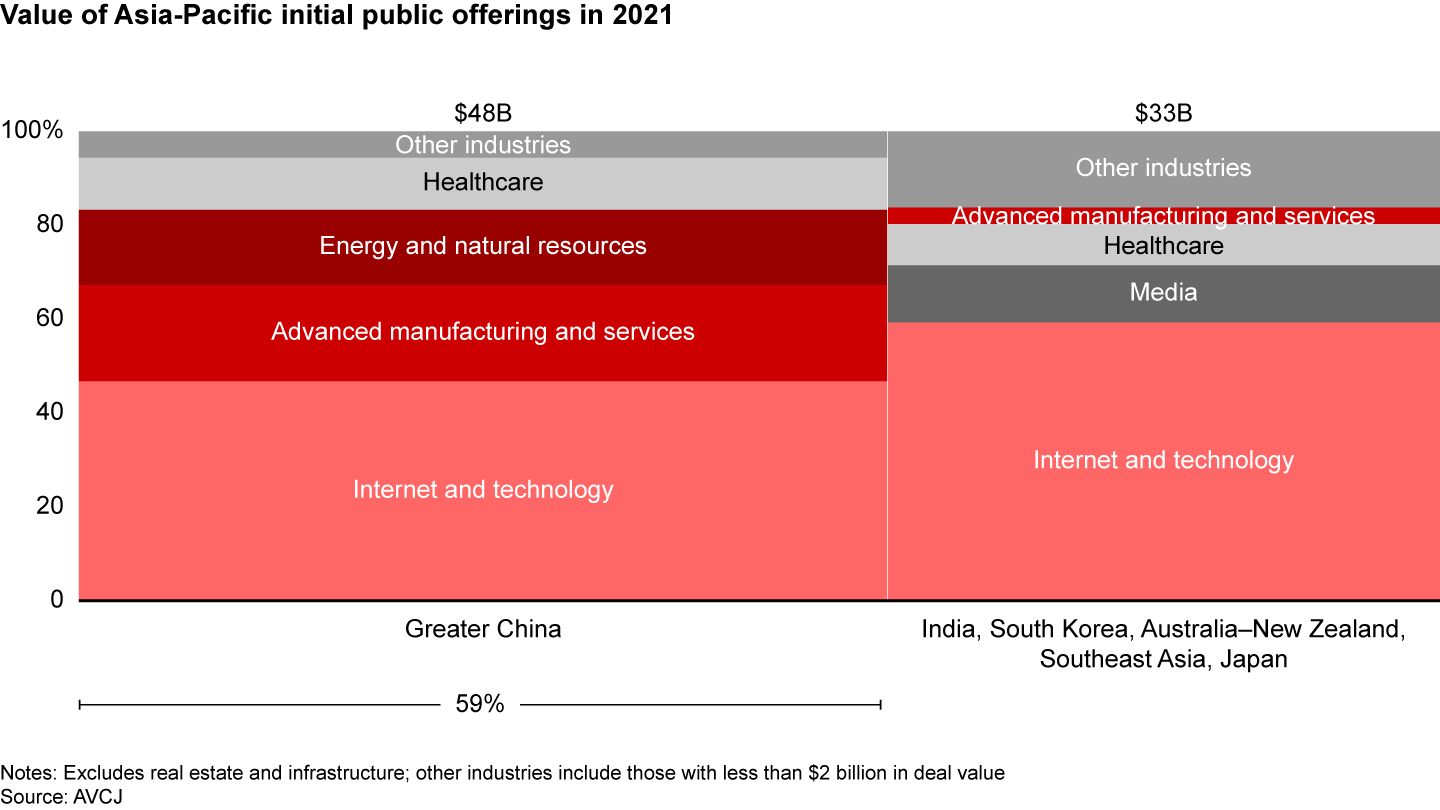
Greater China generated 59% of these IPOs, with mainland China and Hong Kong the main IPO destinations for Chinese companies in the second half (see Figure 15). Of all IPOs in Greater China last year, roughly 47% were Internet and technology companies.
However, China exits declined significantly in the second half of 2021, when the US closed its IPO channel to Chinese companies (see Figure 16). Weak stock markets in mainland China and Hong Kong contributed to an unattractive exit environment. China’s exit value plummeted 50% in the second half from the same period a year earlier. Policy uncertainty and poorly performing public markets left China unable to support the high IPO multiples required for a profitable exit. Those conditions could continue to dampen China’s exit market in 2022.
Other Asia-Pacific countries enjoyed a robust exit climate throughout 2021. Technology company exits were strong in India and Southeast Asia. India’s domestic stock exchanges achieved a record IPO value, fueled by looser listing requirements and strong liquidity.
Though exits rebounded this year, GPs are feeling pressure to do more. Many hold aging portfolios with significant exit overhang. The share of Asia-Pacific private equity portfolios with a vintage of greater than 7 years increased in 2021, with significant overhang in the 2015 to 2017 vintages (see Figure 17).
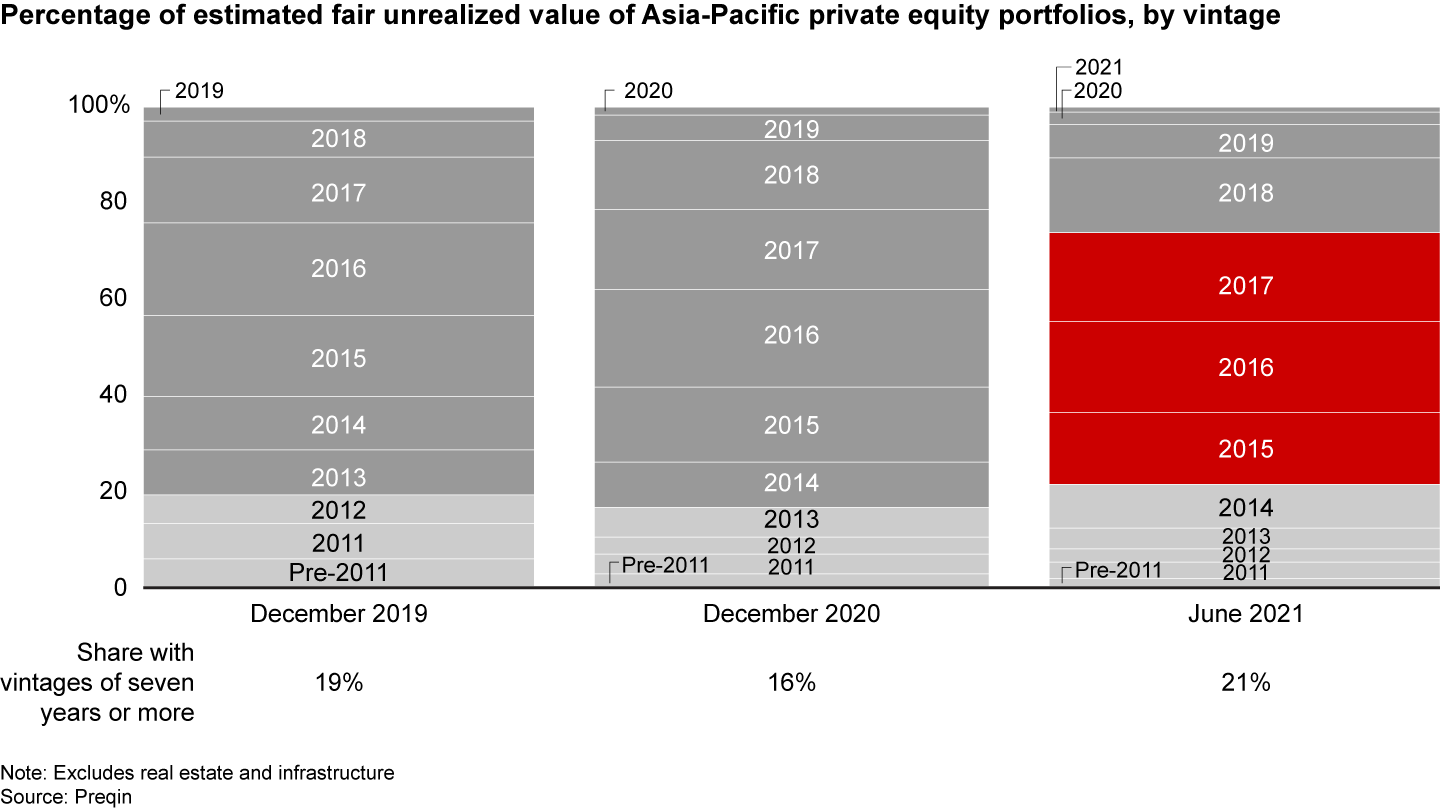
The exit trend in 2022 will continue to be affected by Covid-19 containment measures, the performance of public stock markets, and geopolitical constraints on IPOs.
Fund-raising revives slightly
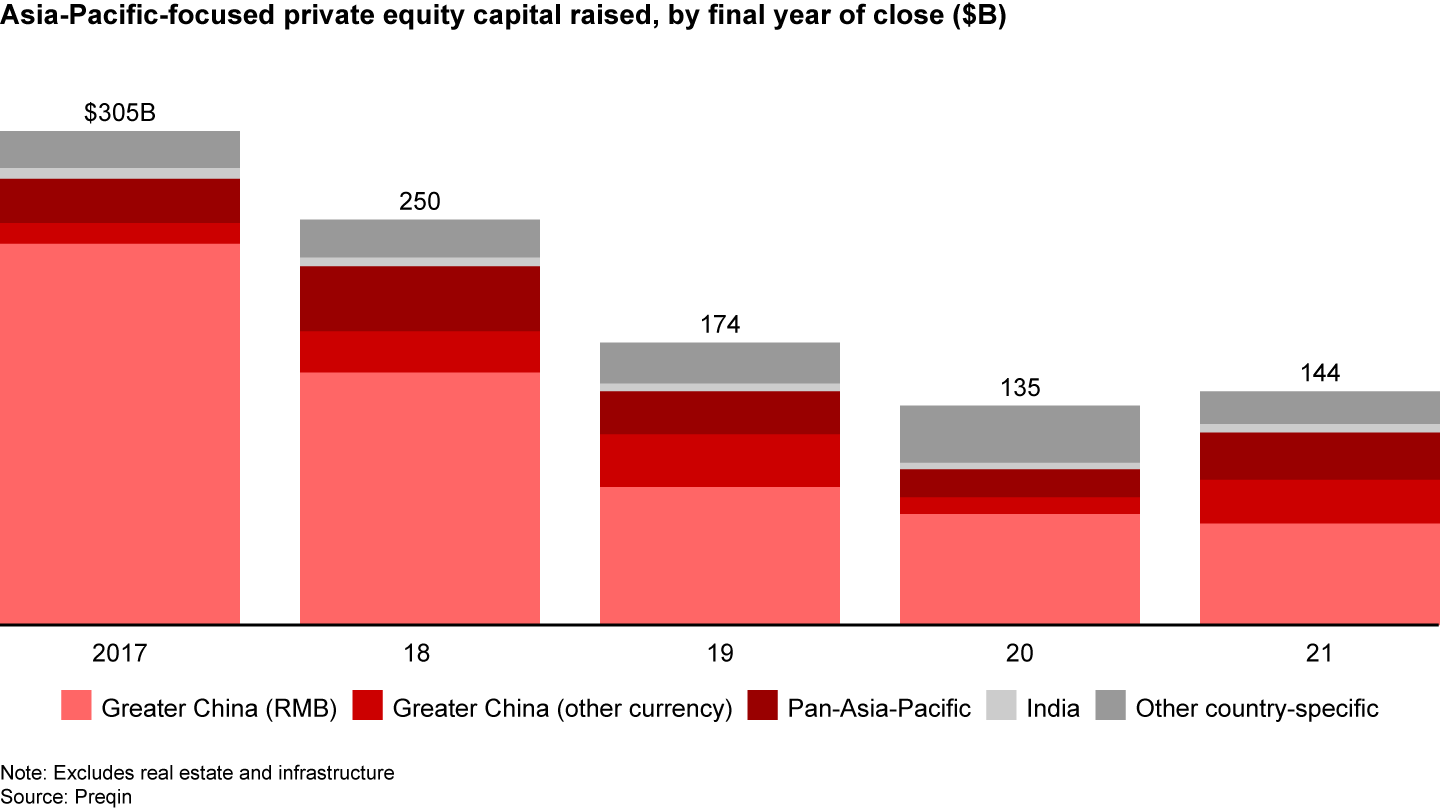
Following a 2-year slump in fund-raising, Asia-Pacific-focused funds raised $144 billion in 2021, up 7% over 2020, but still more than 50% below the 2017 peak (see Figure 18). The average fund size of $304 million was 62% higher than the previous year and 64% higher than the previous 5-year average. One key reason was a proliferation of megafunds of more than $1 billion. The value of megafunds was up 42% over the previous year, while the number increased 8%.
Four purely Asia-centric megafunds of more than $5 billion closed in 2021, compared with 1 in 2020. Those 4 include the largest ever Asia-Pacific-focused fund—KKR’s $15 billion Asian Fund IV. The National Green Development Fund, a Chinese government-guidance fund (GGF), closed at roughly $13 billion.
The number of smaller-sized funds (less than $500 million each) that closed in 2021 totaled 414, dropping almost 40% from 2020. Smaller funds were more vulnerable to shifting macroeconomic conditions and competition. Newer funds lacking a strong track record faced an additional challenge.
More than 40% of the GPs we surveyed believe that the Asia-Pacific fund-raising environment was easier in 2021, and two-thirds expect conditions to be the same or improve in 2022. However, GPs in Greater China diverged sharply from that view: 54% expect fund-raising to be more challenging in 2022, and none said it will be easier.
Pan-Asia-Pacific funds accounted for nearly 20% of total Asia-Pacific-focused capital raised in 2021, up 10 percentage points from the previous five-year average. However, the number of funds remained low, 10% of the total count, as large funds continued to get larger.
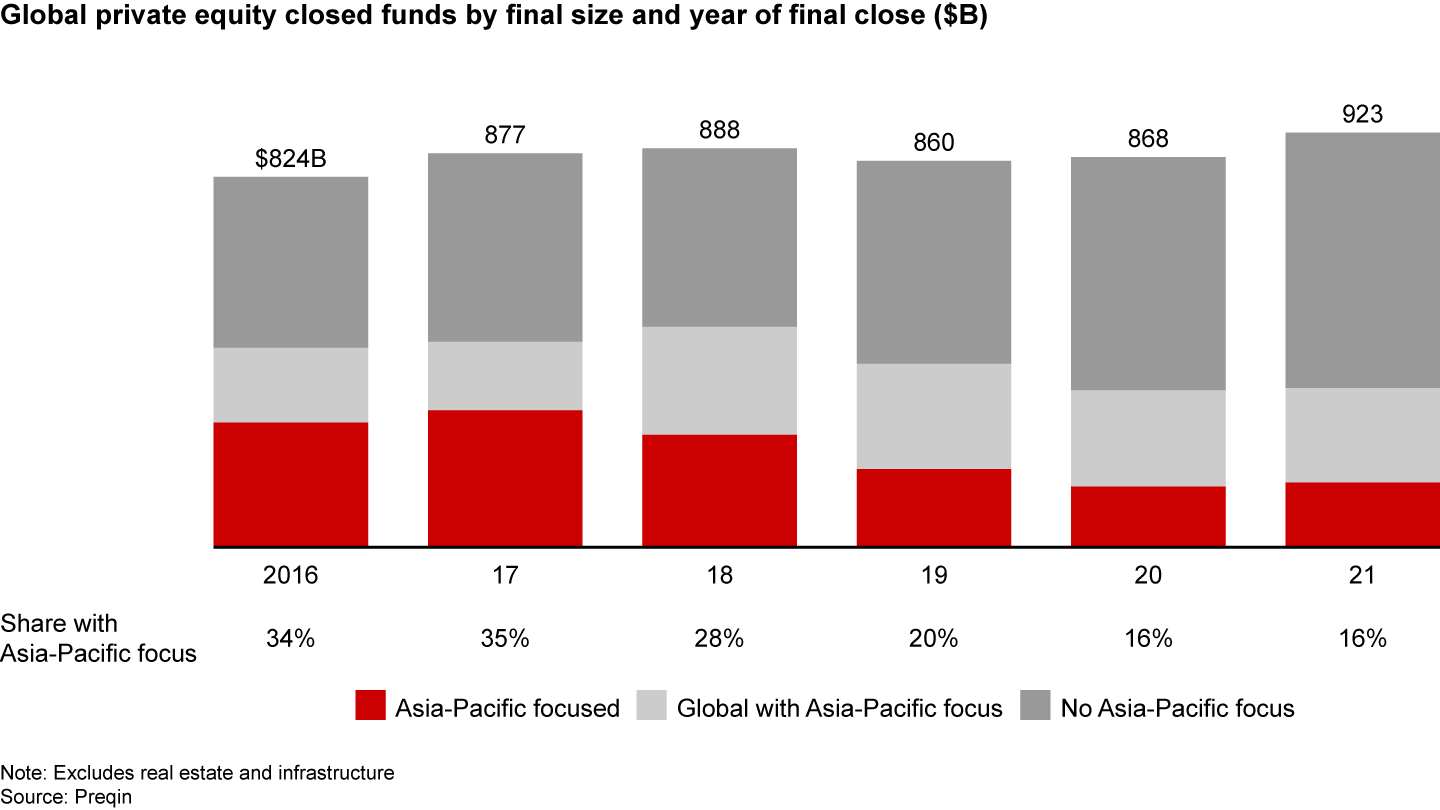
Global PE fund-raising totaled $923 billion, up 6% from both 2020 and the previous 5-year average. Purely Asia-Pacific-focused funds as a percentage of the global total was unchanged at 16% (see Figure 19).
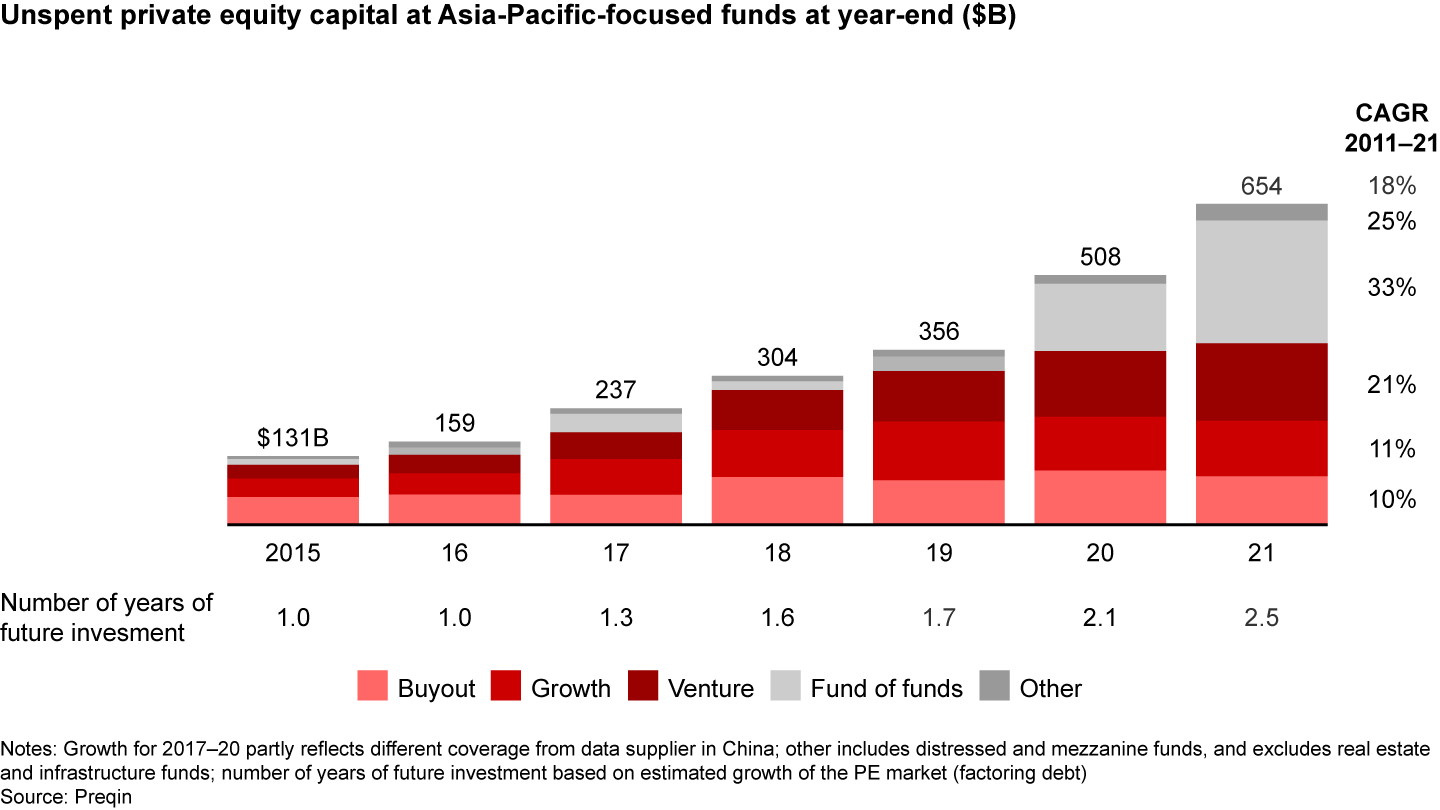
Despite a robust increase in exits, dry powder—total unspent private equity capital—at Asia-Pacific-focused funds rose by nearly 30% to a record $654 billion (see Figure 20). High valuations and Covid-related market uncertainty are the most important factors holding up deployment, but investors also face increased competition for high-quality deals.
Greater China-focused funds continued to dominate the market, accounting for more than 60% of overall Asia-Pacific-focused fund-raising in 2021. More than 40% of that sum was raised by China government-guidance or affiliated funds. These state-backed funds also accounted for about 57% of the overall value of megafunds, or those with more than $5 billion.
However, continued geopolitical tension and policy uncertainties in Greater China have triggered concerns in the global LP community. Fund-raising in the region doubled in the first half from the same period a year earlier, but plunged more than 50% in the second half (see Figure 21).
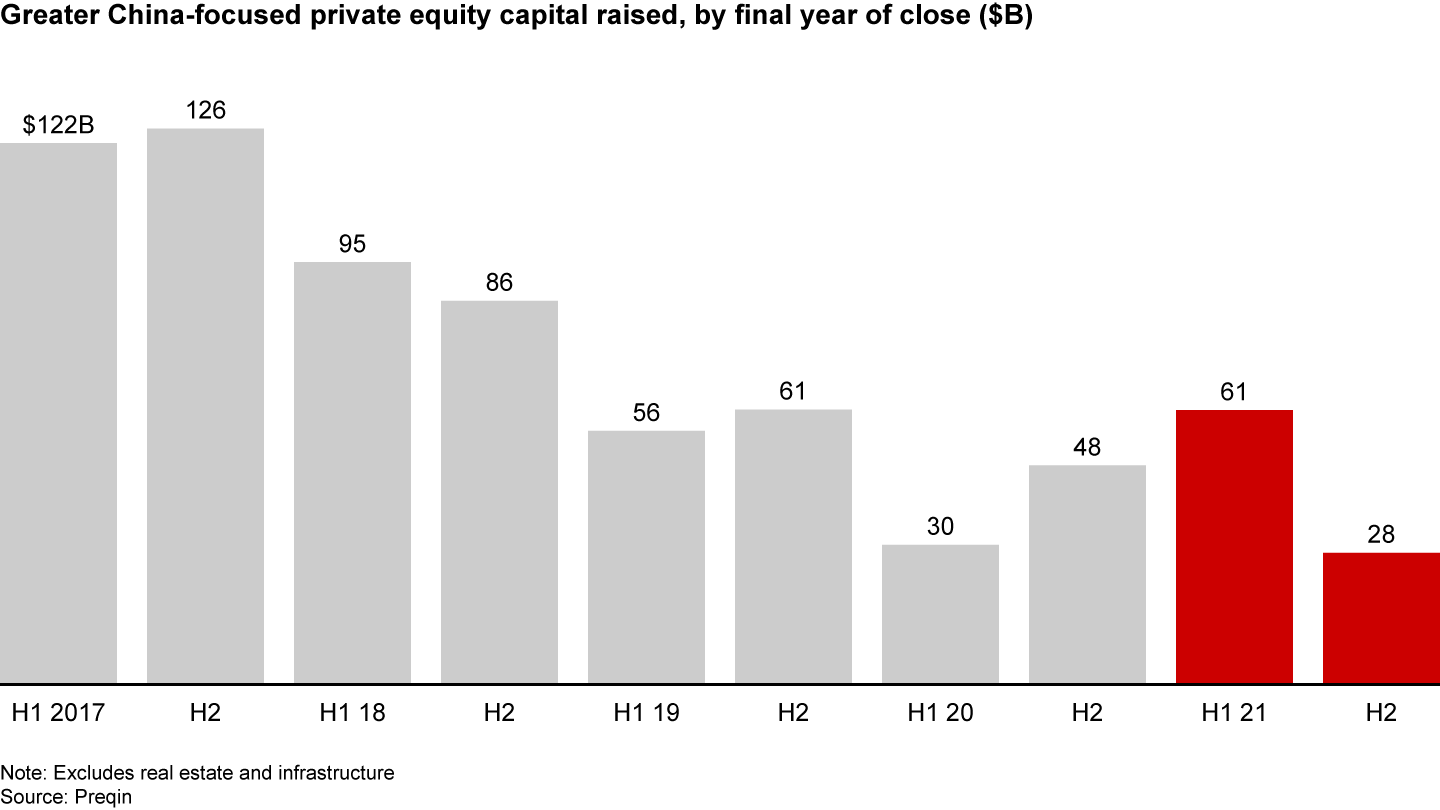
After China further tightened its control over private equity investment funds by introducing new supervision rules in January, GGFs are likely to continue dominating, especially the renminbi-denominated fund market.
The number of Asia-Pacific-focused funds closed in 2021 fell to 475, continuing a 5-year trend toward fewer but larger funds (see Figure 22). The average fund size rose to a record $304 million. And for the first time since 2018, funds on average exceeded their target size. For large, experienced funds (over $1 billion), the time needed to close a new fund declined significantly from the 3-year average. The percentage of large funds that met their target remained high at over 80% (see Figure 23). Larger regional funds with strong track records continued to be popular and win strong LP backing. Smaller or first-time funds faced more challenging conditions, given their limited track records and LP relationships. Only those with differentiated strategies and realistic targets on fund size were able to close on track.
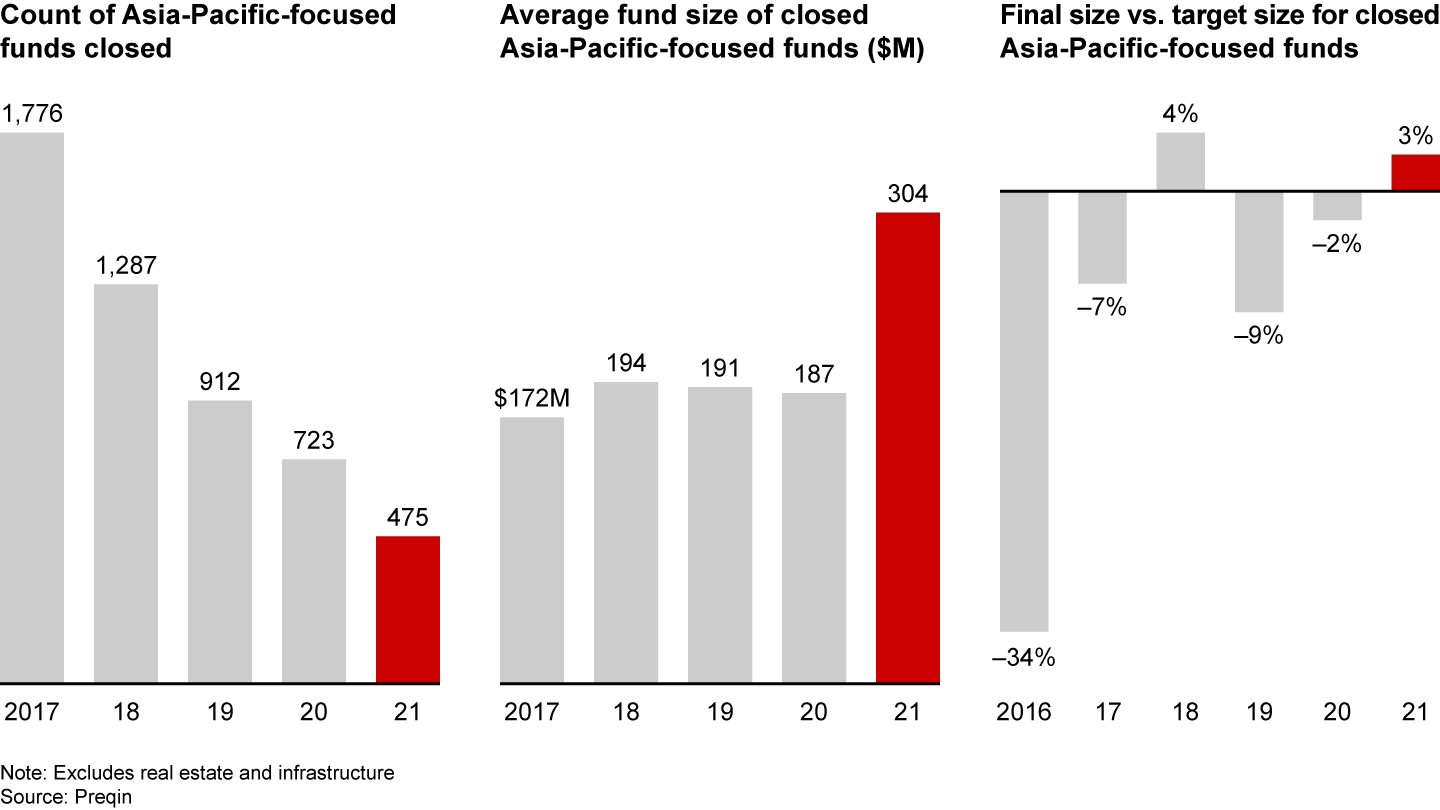
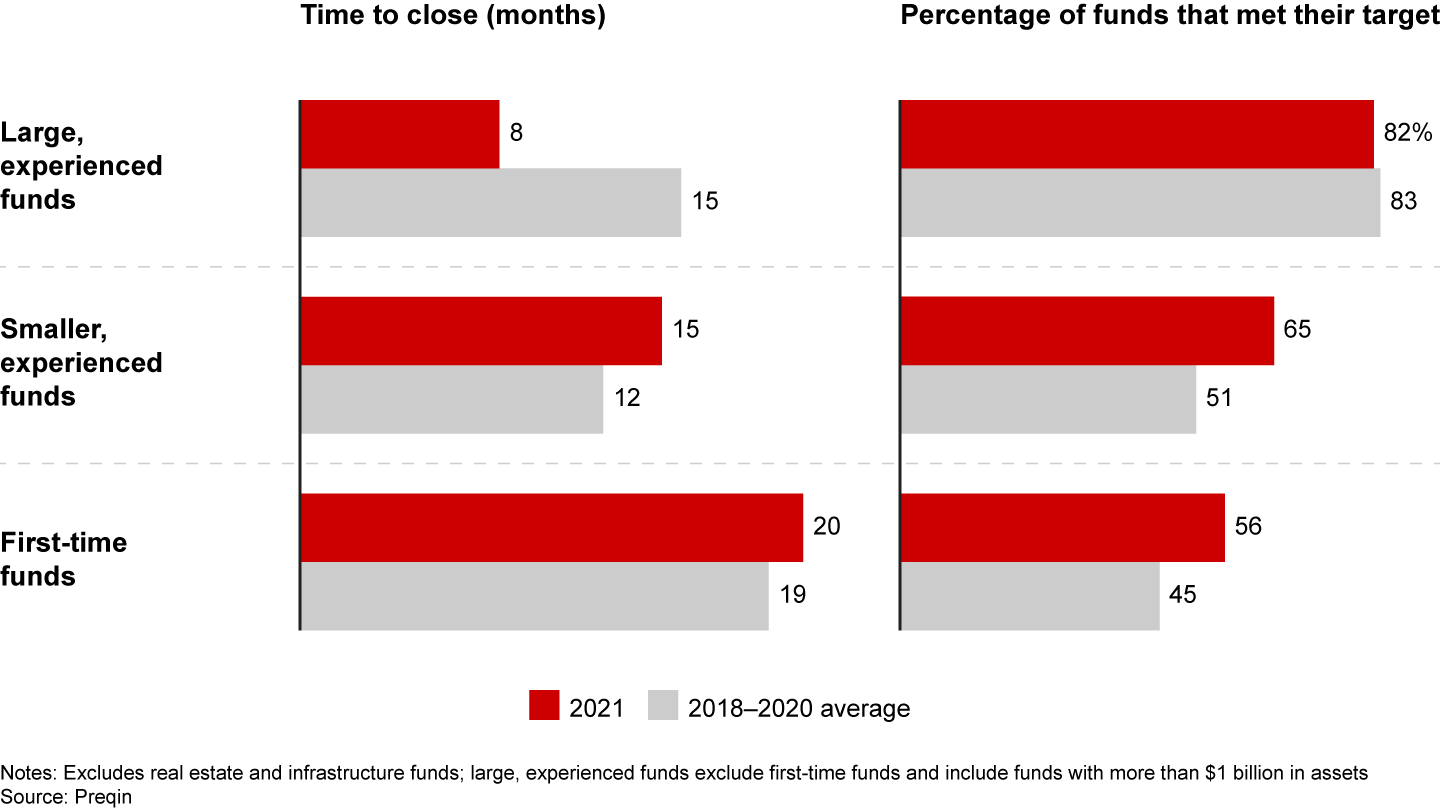
The Asia-Pacific fund-raising market bounced back as anticipated, buoyed by the closing of a few large funds. However, given geopolitical tensions and policy uncertainties, especially in China, established flagship regional funds are expected to continue garnering the lion’s share of future LP commitments. LPs’ cautious sentiment toward China is likely to divert some capital this year to India, the most comparable and second-largest PE market in the region.
More than 50% of GPs say competition is the biggest challenge in fund-raising. To thrive, younger and smaller funds need to find ways to differentiate themselves from their peers.
Returns: Steady increase
Despite a turbulent economic environment and continuing pandemic-related disruptions, Asia-Pacific PE returns rose to a 10-year high at 14.2% median net IRR, from 13.3% in 2020. Top-quartile funds again delivered robust returns well above expectations of 15% (see Figure 24). Private equity continued to outperform public markets over 5-, 10-, and 20-year horizons, according to Cambridge Associates (see Figure 25). But IRR was trending downward for the most recent vintages.
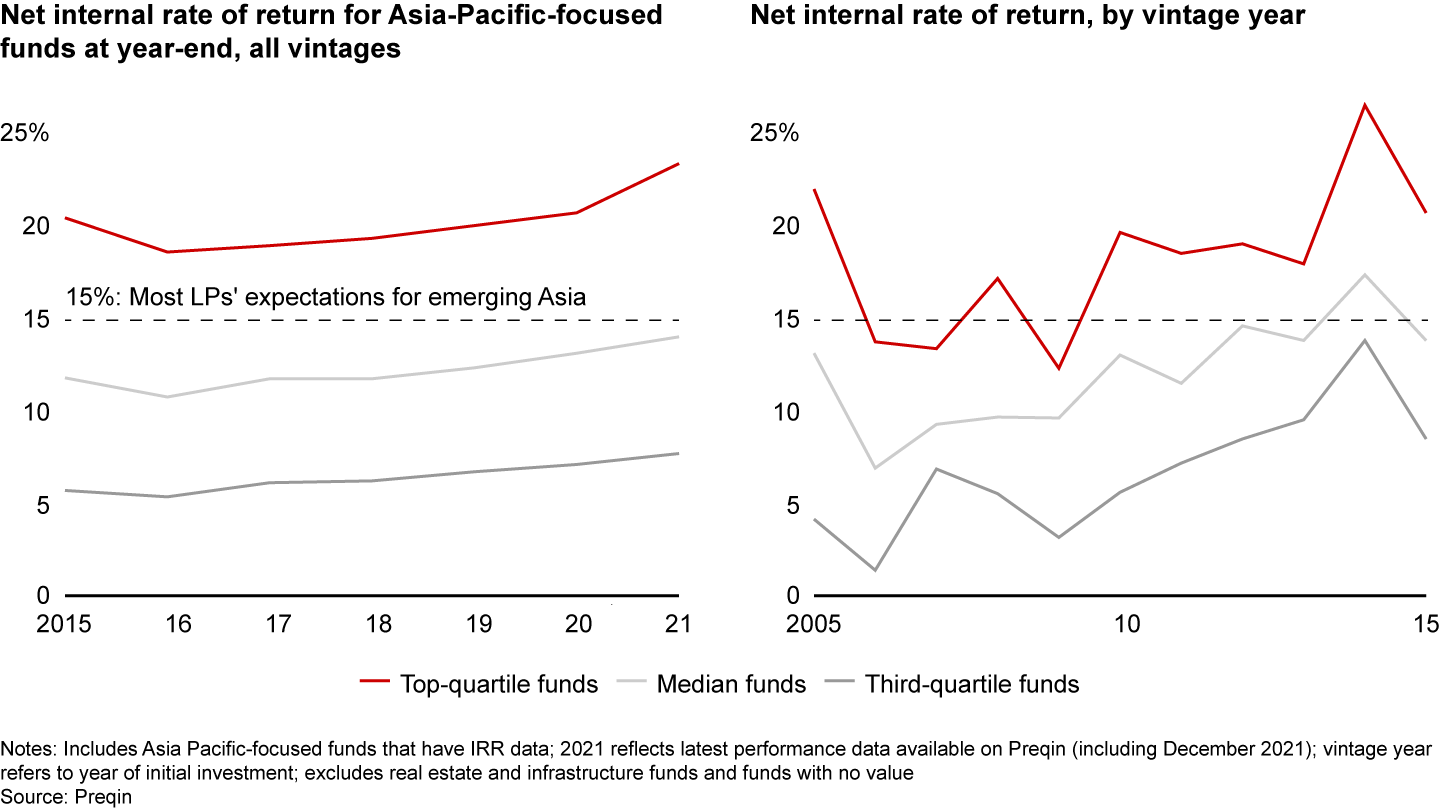
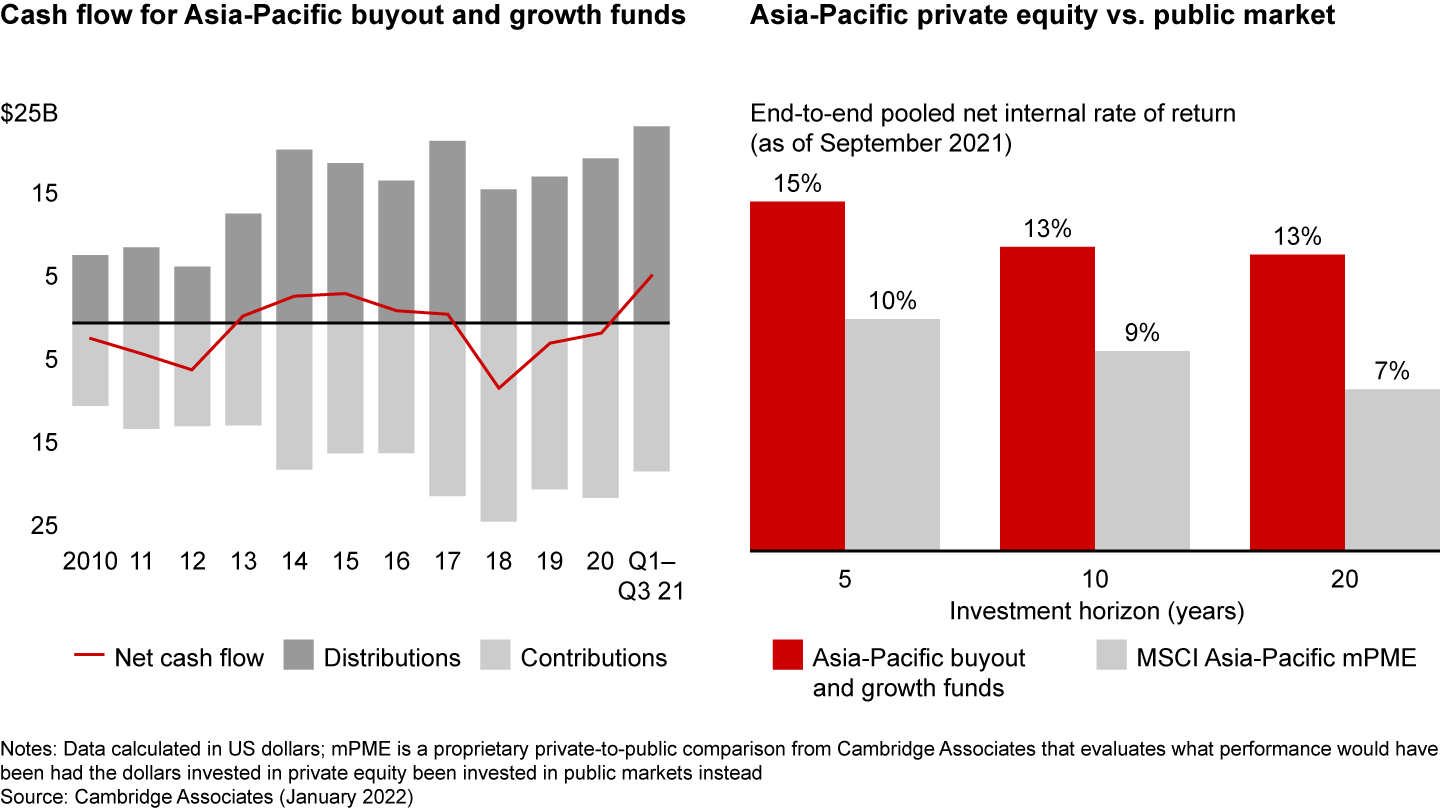
LPs’ net cash flow in the first three quarters of 2021 was positive for the first time in 4 years, a reflection of the improving exit environment. LPs will need to continue to focus on value creation to enhance their exit options and the value of their portfolios.
Nearly two-thirds of GPs said top-line growth was the No. 1 factor fueling returns on deals exited, the same share as in 2020, according to our survey (see Figure 26). And 74% expect top-line growth to remain the most critical force in the coming 5 years. At the same time, nearly 62% of GPs say cost improvement and capital efficiency will play a much greater role in generating returns in the next 5 years than they do today.
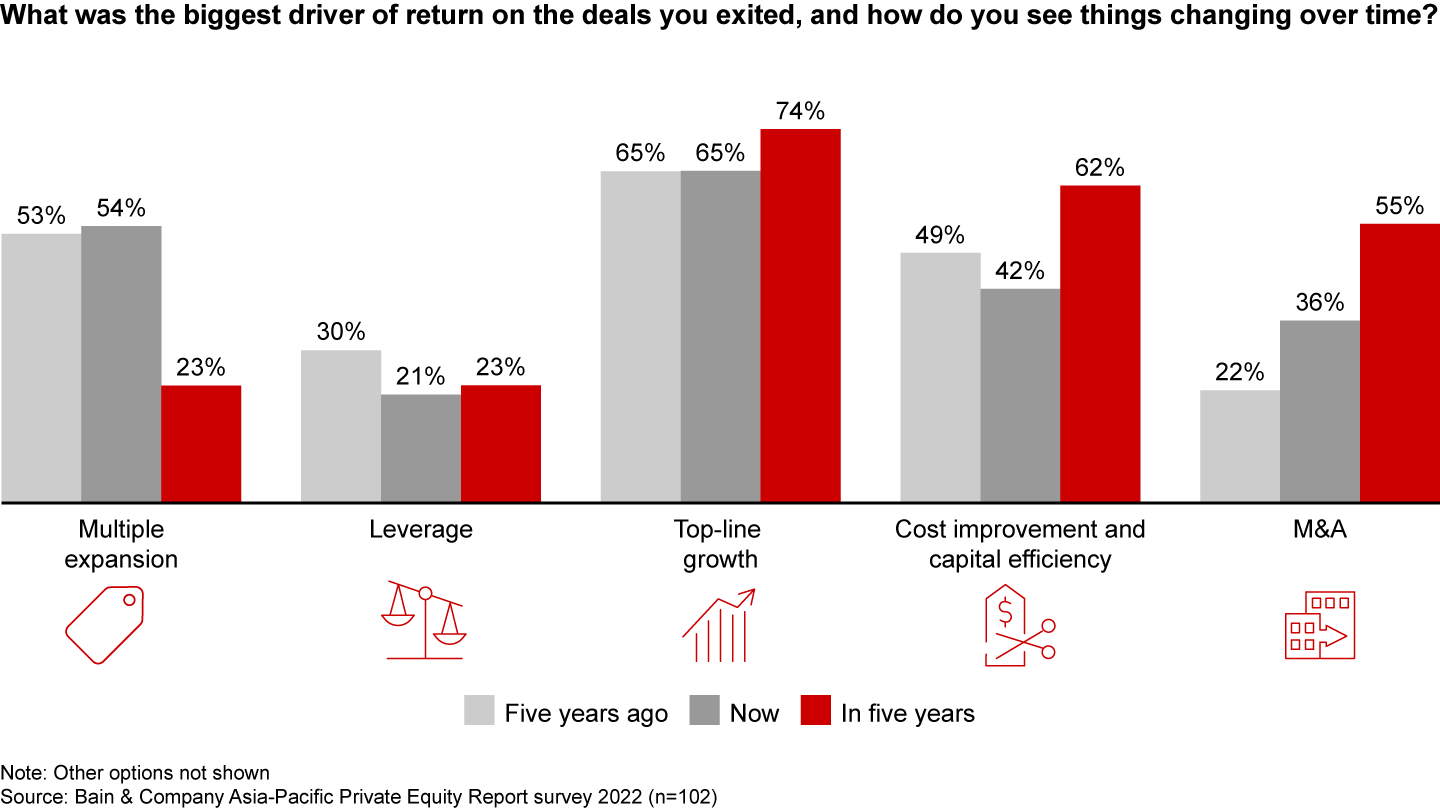
As competition for the best deals rises, returns will depend increasingly on GPs' ability to create value, deliver top-line growth, and improve costs. In 2021, 70% of funds we surveyed said they achieved margin expansion in many or most of their portfolio companies, up significantly from 54% the previous year. Seventy-eight percent of respondents generated top-line growth at many or most of their portfolio companies, on a par with 2020.
Bracing for more change ahead
The Asia-Pacific private equity market has proven resilient in the face of a shifting global economy and ongoing disruptions related to the pandemic. But there’s no way to know how war in Ukraine and other global challenges will play out. There are plenty of early signs that political and national security concerns are curbing international capital flows. With deal value at a record level and returns stronger than ever, the challenge for GPs will be maintaining healthy momentum on investments and exits, amid economic and geopolitical uncertainty. Several other factors could make 2022 even more arduous for fund managers, including strong macroeconomic headwinds, regulatory unpredictability, and increased competition.
Despite an increasingly complex environment, we see two broad themes linked to growing opportunity for private equity investors in the Asia-Pacific region. The first is a more integrated approach to due diligence. By evaluating the interdependencies between strategy and operations, a holistic approach identifies the most viable path to value creation. In turbulent times, when companies can no longer rely on expanding multiples, an integrated approach to diligence can help fund managers develop value creation plans with the greatest chance of success.
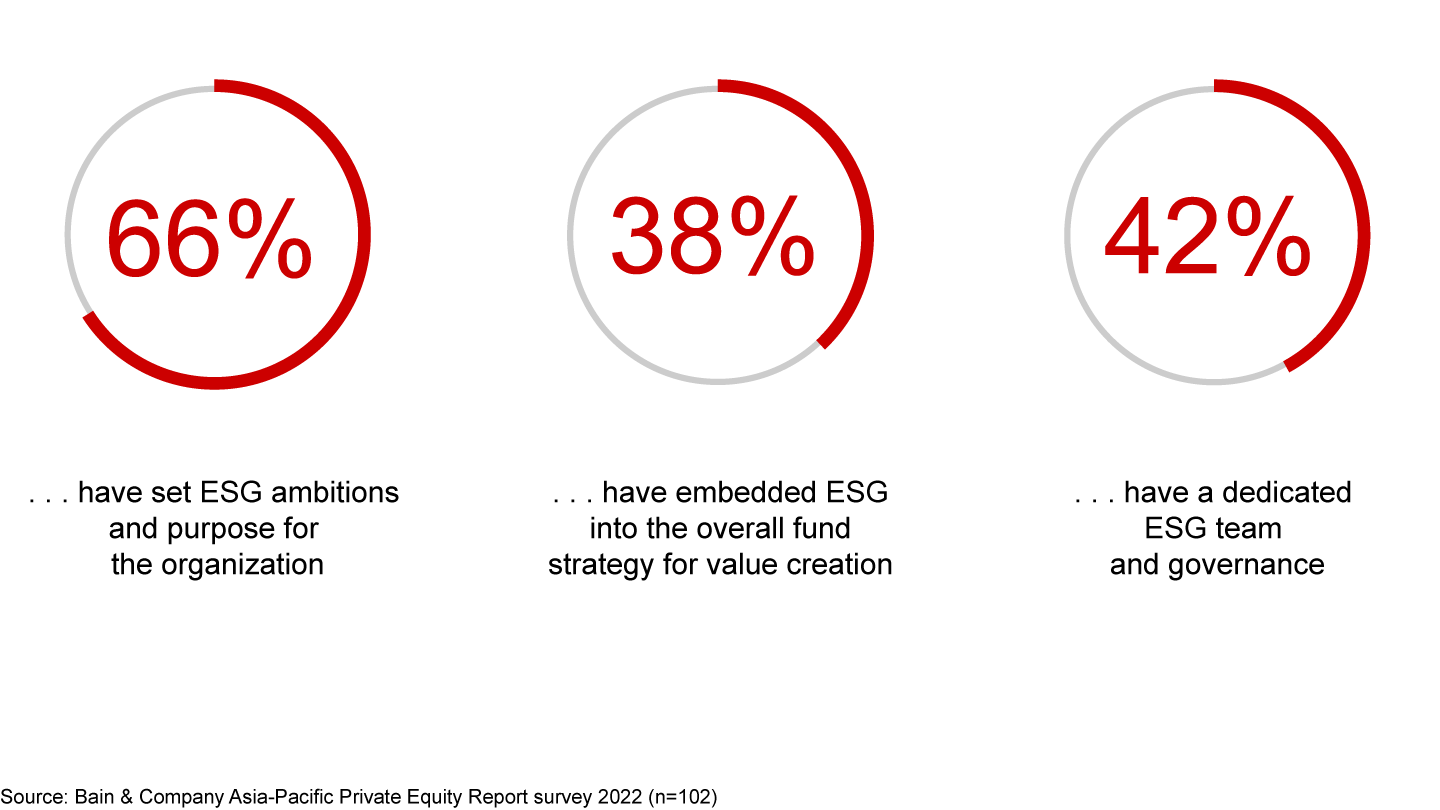
The second theme is growing pressure by governments, regulators, and investors to speed the shift to a sustainable economy—including transparent supply chains and sustainable products and processes. In a surprisingly short span of time, PE funds in the Asia-Pacific region have begun to consider ESG criteria as part of their overall ambition. Nearly 40% have embedded ESG considerations into their overall fund strategy for value creation. It’s a significant shift and a trend that will accelerate in the coming decade.

Finding value through integrated due diligence
Improving portfolio company revenues and margins hasn’t always been a top priority for Asia-Pacific-focused funds. But that’s changing rapidly. With multiples close to record highs and the pandemic casting a shadow over economic growth, returns for any deal that isn’t supported by real business improvement will likely come under pressure.
The best-performing PE funds use an integrated approach to due diligence to generate robust growth and margins. Integrated due diligence identifies a company’s full potential by creating a 360-degree view of a target’s prospects for growth and margin improvement. It’s the most effective approach for validating investment theses and building confidence in financial projections.
Integrated due diligence is the only way to understand how making changes to one part of the business will affect assumptions in another. Rather than simply asking, “What level of cost savings can we achieve?” the question becomes, “If we cut over here, will it compromise an opportunity to expand a business over there?” By considering key interdependencies between strategy and operations, integrated due diligence produces insights that a one-dimensional approach can’t reveal. Above all, it identifies the most viable path to new value (see Figure 27). In a downturn, when firms can no longer rely on expanding multiples to mask underperformance, that can create an invaluable competitive advantage.
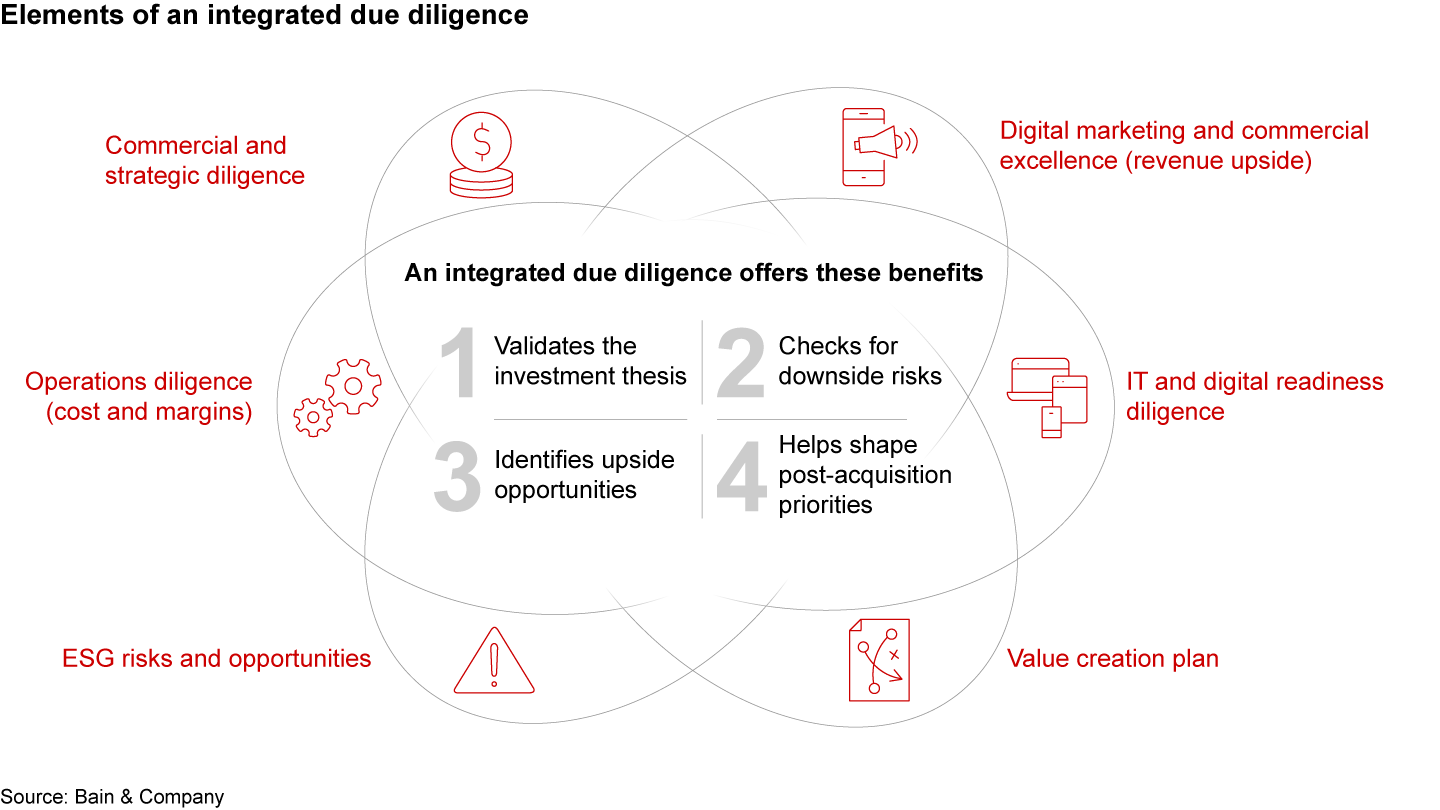
Bain research shows investors already evaluate several elements during diligence for most deals (see Figure 28). Sixty-two percent of investors in our 2022 Asia-Pacific Private Equity Report survey said cost and margin improvement was a very important part of deal theses in 2021, and nearly 40% said it was considerably more important than 3 years ago. Investors are also looking for opportunities to outpace market growth. More than one-third said gaining share in existing markets had become a more important thesis element over the past 3 years.
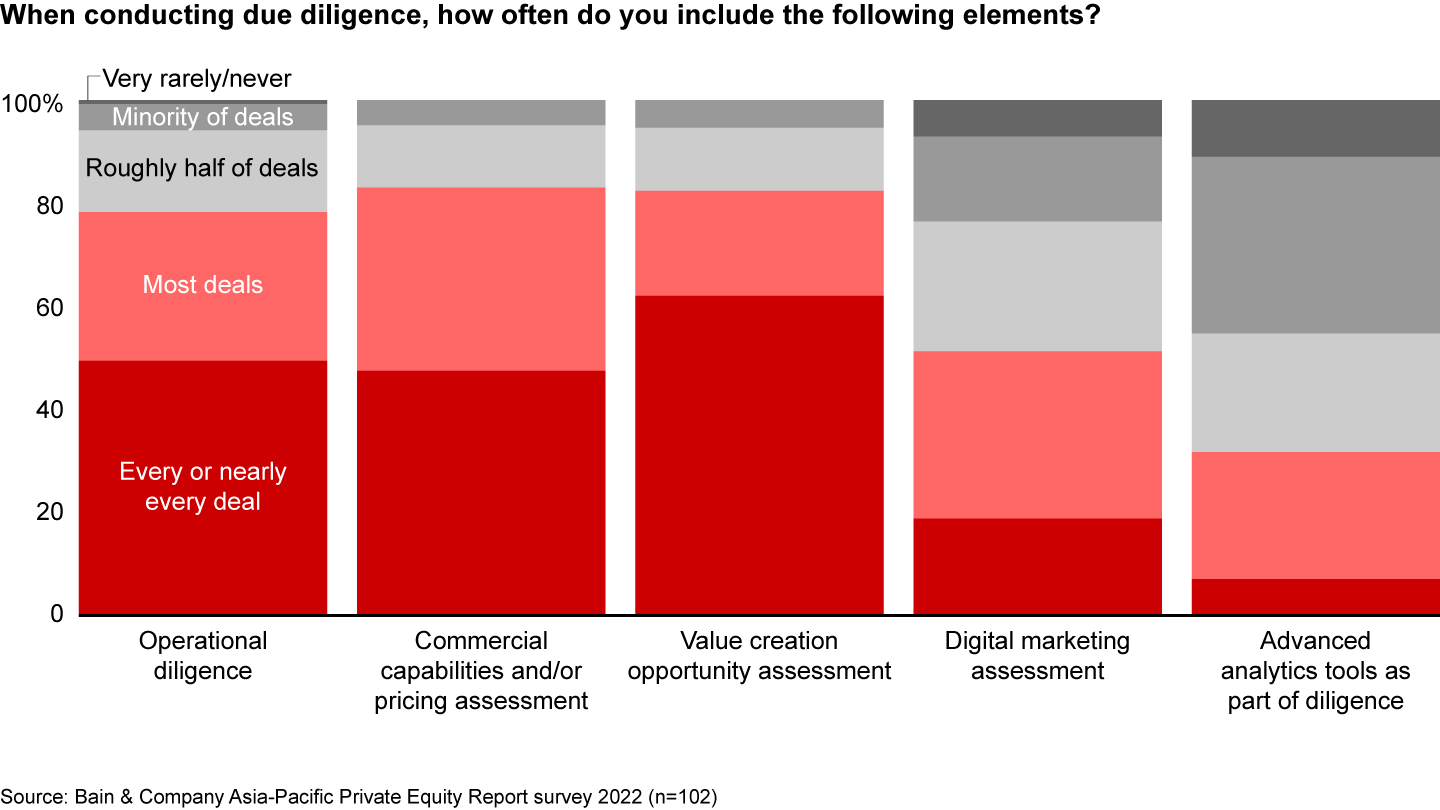
Operational due diligence
Fund managers investing in the Asia-Pacific region increasingly base their deal theses on improving operational efficiency and reducing costs. While cost reduction can deliver important gains, funds that focus too narrowly on operational efficiency often overestimate how much it will expand margins. In fact, an unrealistic margin improvement forecast is one of several warning beacons Bain has identified in deals that fail to provide positive returns.
Integrated due diligence considers cost and operational changes in a comprehensive business context, including market opportunity, competition, and commercial issues. That provides fund managers a more accurate assessment of potential value creation. By contrast, evaluating cost reduction in isolation often leads to an unrealistic value creation forecast. For example, pursuing a best-in-cost standing may involve sacrificing a best-in-class position that’s key to competitive differentiation and future growth. An integrated view allows fund managers to identify cost initiatives they can pursue in tandem with other strategic objectives.
Take the case of a global PE fund evaluating a mobile phone components supplier in Greater China. For the GP and his team, understanding the company’s relative cost position was crucial to the deal thesis. By examining the various elements that contributed to cost per unit, such as raw materials and direct labor, and assessing each stage of operations (cutting, polishing, and coating), the diligence team could identify exactly where the target had either a cost or production-yield advantage compared with competitors. For example, the target designed its own innovative production equipment, which gave it a cost advantage over larger-scale competitors. The detailed insights on the investment gave the committee more confidence in the target company’s competitiveness. It also affirmed the target’s ability to further reduce cost as it scaled and optimized processes.
Additional diligence findings reinforced the team’s understanding of the mobile phone company’s operational and cost position. When evaluating new growth avenues for component suppliers, for instance, the team became convinced that the company could gain share with key customers. The fund’s integrated approach to diligence also highlighted operational strengths that could help the company expand into adjacent market segments.
While integrated due diligence reinforced the deal thesis in this case, the same process may also challenge fund managers’ assumptions. For example, it may reveal that cost savings initiatives are unrealistic, or that the operational investment required to meet strategic top-line objectives adds costs and undercuts projected returns—also highly valuable insights.
Assessing digital capabilities
Top-performing funds increasingly assess IT and digital capabilities as part of an integrated due diligence. They recognize that a company’s digital savvy can be critical to both commercial and operational elements of the deal thesis (see Figure 29).
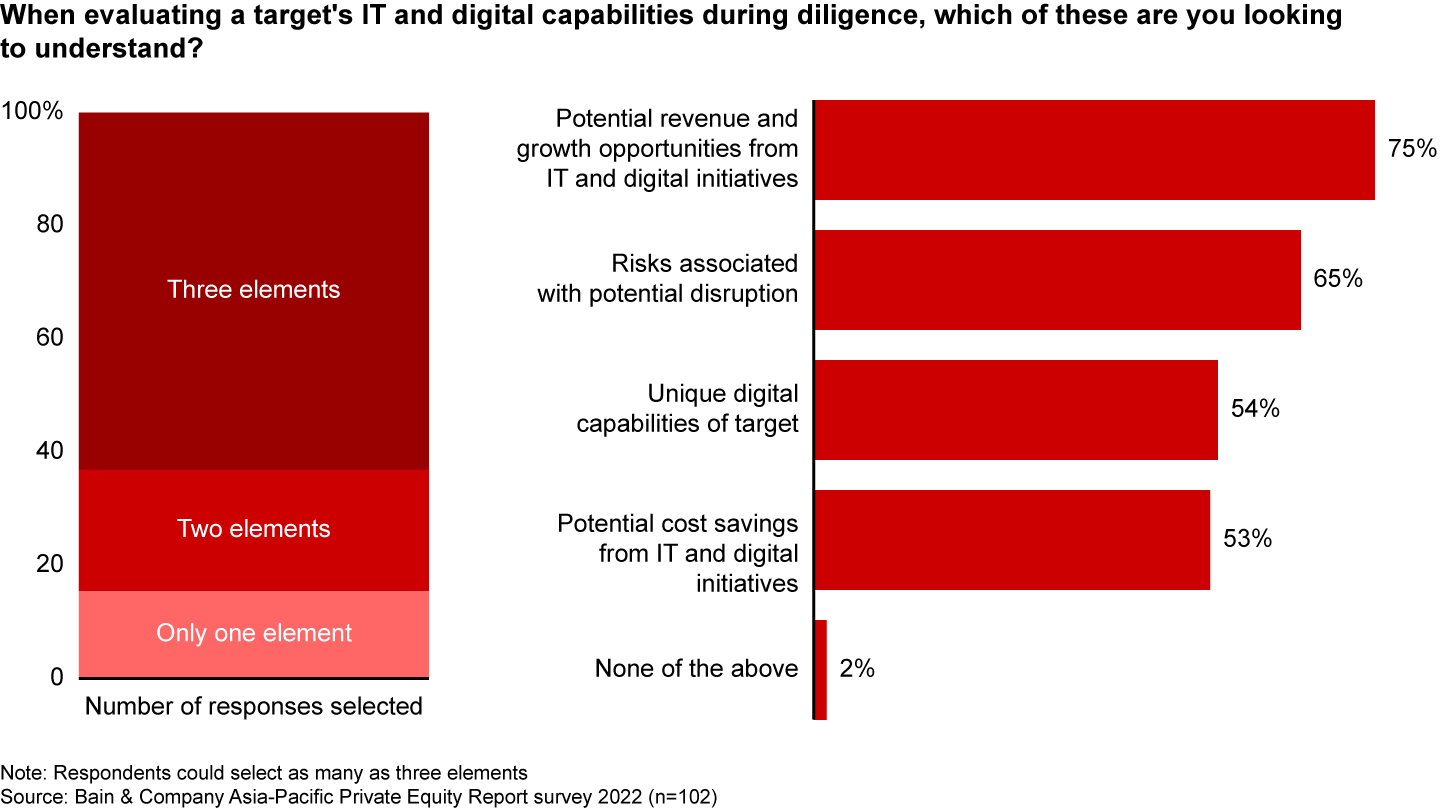
In fact, GPs need to know the target’s digital point of departure in order to assess digital-related value creation. Conducting a digital and IT assessment as part of integrated diligence gives investors a valuable additional perspective on a company’s potential.
Consider the experience of a global PE fund doing diligence on an Australian operator of activity-based entertainment centers that offered food and beverages. A digital assessment was a key part of the diligence. At the outset, the GP and his team were convinced the company was significantly differentiated from its competitors, but they were unsure if it was well-positioned for growth.
The team quickly determined that customer-centricity was instrumental to growth. By combining commercial diligence on performance with the digital assessment, the fund could identify three key areas to fuel growth: digital marketing and brand building, customer engagement, and loyalty programs. The next step involved creating prototypes of customer apps and mock-ups of the customer digital journey. Finally, the diligence team considered key business enablers and operating model improvements to accelerate change and build a customer insights function.
The fund considered the impact of these digital initiatives together with other sources of growth such as commercial optimization, for which digital initiatives were a key supporting element. By building this integrated view, the fund could reasonably assess how the digital initiatives would affect capital expenditures and operating expenses, and view them in a larger strategic context.
Integrated value creation plan
The insights gleaned from an integrated due diligence bolster confidence in the base case for increasing growth and profits. This approach is also better at identifying and quantifying value creation opportunities. In an increasingly competitive market, that advantage is becoming vital to winning bids and meeting target valuations. More than 80% of Asia-Pacific PE investors say they factor the projected gains from value creation plans into their bidding in many or most of the assets they evaluate (see Figure 30).
In our experience, many investors seek to estimate the potential increase in revenues and profit from value creation initiatives without creating integrated financial projections. Omitting this integrated view risks overestimating the upside and overlooking broader business implications.
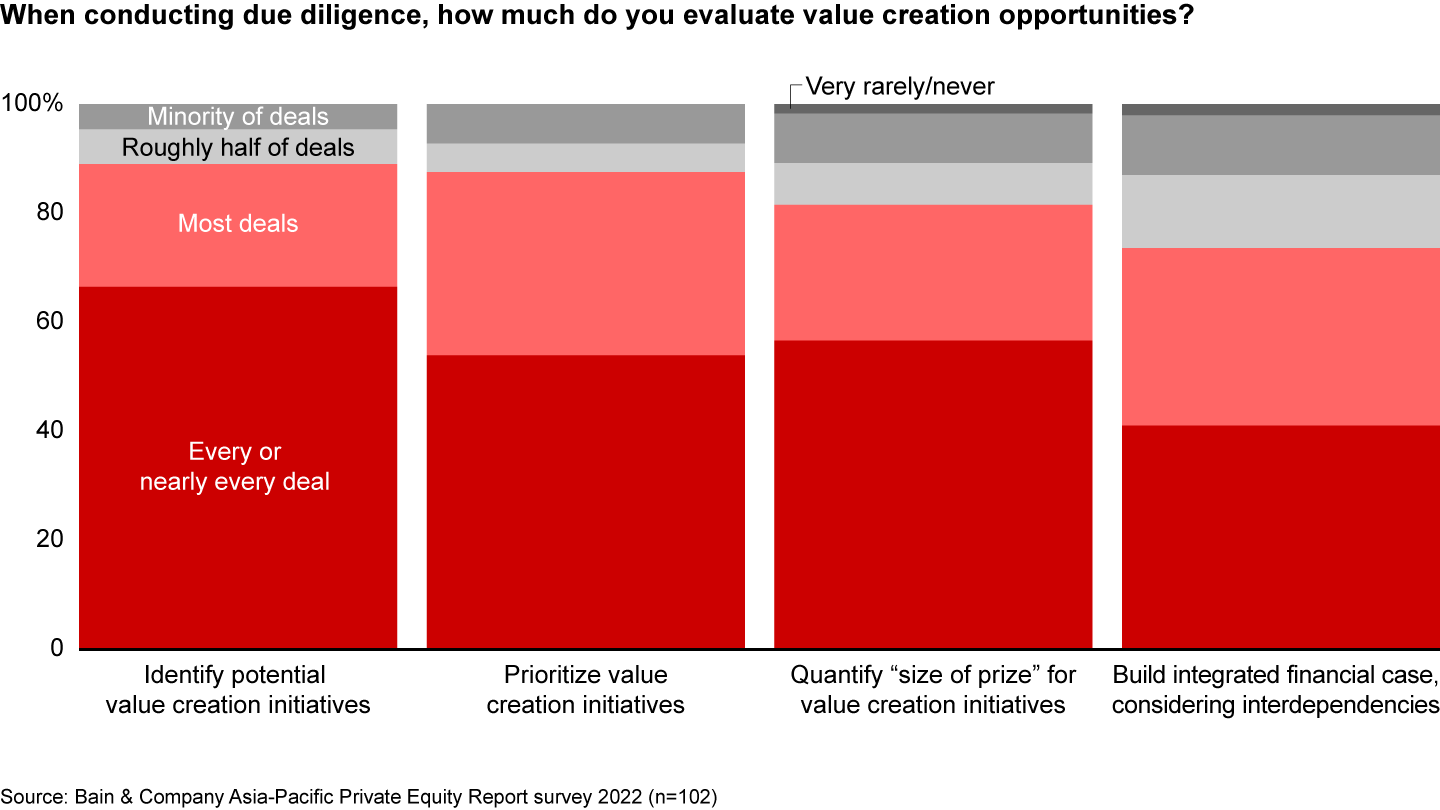
Finding value creation opportunities on paper may seem easy, but pressure testing them in an integrated diligence creates a far greater confidence in the deal thesis. It allows investors to focus on the few initiatives that really matter. It also helps answer the question, “Why haven’t they done that before?” An integrated diligence highlights important trade-offs and choices that management or the sell side may not have considered.
Consider the example of a local PE fund evaluating a retailer in Japan. As they started their work, the GP and his team believed that the retailer offered significant potential to create value. A holistic commercial and operational diligence confirmed their confidence with integrated top-line and bottom-line forecasts.
During the initial phase of diligence, the team drafted a list of value creation opportunities. Insights from the broader diligence and digital assessment enabled the fund to identify five high-priority sources of value creation. Three were critical to the deal thesis: new store openings based on geospatial analysis of retail white space and increasing foot traffic; product mix optimization; and the growth of an in-house e-commerce channel accompanied by digital marketing to enhance web traffic. The team also considered two additional initiatives in building an upside case—procurement optimization and store labor savings.
The diligence effort highlighted a realistic gain for each initiative, as well as critical interdependencies in building financial forecasts. For example, had fund managers viewed procurement savings in isolation, they would have assumed a certain potential for improving gross margins. These assumptions would, however, be sensitive to changes in product mix or retail channel. The integrated financial projection allowed the fund to consider the effect of other initiatives, including projected changes to the mix of channels and product assortment.
Similarly, when assessing optimization of the retailers’ own e-commerce website, they had to consider multiple factors—both positive and negative. A digital marketing campaign for the company’s own website clearly would increase sales on that channel. It also would improve brand awareness and perception, and could attract new and existing customers to physical stores. The integrated diligence also flagged two negative effects: the additional costs associated with optimization and the possible cannibalization of sales on third-party e-commerce channels. The combined input helped the fund more accurately estimate the potential gains from a digital marketing campaign and avoid the pitfall of overestimating the impact of a single initiative viewed in isolation.
Finally, an integrated due diligence helped the fund better understand the role of discount rates offered by the target on third-party websites. An initiative to eliminate these discount rates seemed attractive and achievable when benchmarked against best-in-class competitors, but didn’t look compelling in a broader strategic context. Interviews with stakeholders and analysis of past campaigns revealed that higher discount rates were a differentiator for the company on these platforms and current discount levels couldn’t be significantly improved.
For fund managers, generating value has become a more complex challenge. Most industries are undergoing rapid technological disruption, and as a result, shifting profit pools are creating new winners and losers. All these changes increase the likelihood that a company will need to alter its strategy, strengthen operations, and rethink its cost structure. Leaders who adopt an integrated due diligence approach will be a step ahead of the competition in identifying deals with the greatest potential and creating the value they expect.

ESG goes mainstream
For a growing number of financial investors around the world, sustainability has become the new digital. Like investments in digital technologies a decade ago, sustainability is fundamentally reordering priorities and strategies for businesses of all types. The 26th annual summit on climate change, COP26, in November 2021 galvanized governments and private organizations across the Asia-Pacific region to increase their commitments to a more sustainable economy. Many fund managers now view environmental, social, and corporate governance (ESG) criteria as a core consideration in investment decisions. That’s a 180-degree shift from a decade ago, when most viewed ESG as a niche consideration.
Research by Bain and the Institutional Limited Partners Association (ILPA) shows LP attitudes and action in 2021 reached a turning point, both globally and in the Asia-Pacific region. Worldwide, a solid majority of LPs now require their GPs to anchor ESG criteria in fund strategy and value creation plans. Seventy percent of LPs say their organizations’ investment policies include an ESG approach, and 85% of those have fully or partially implemented an ESG investment policy. In total, ESG considerations affect 76% of PE assets under management.
Momentum is accelerating partly because society is demanding action, but also because LPs increasingly believe that incorporating ESG criteria into a PE fund’s investment strategy improves its performance. In the Bain-ILPA survey, 50% of global LPs said applying ESG criteria to investments boosts valuation premiums. For this group of LPs, leading on sustainability and climate change helps solve pressing global problems while increasing returns.
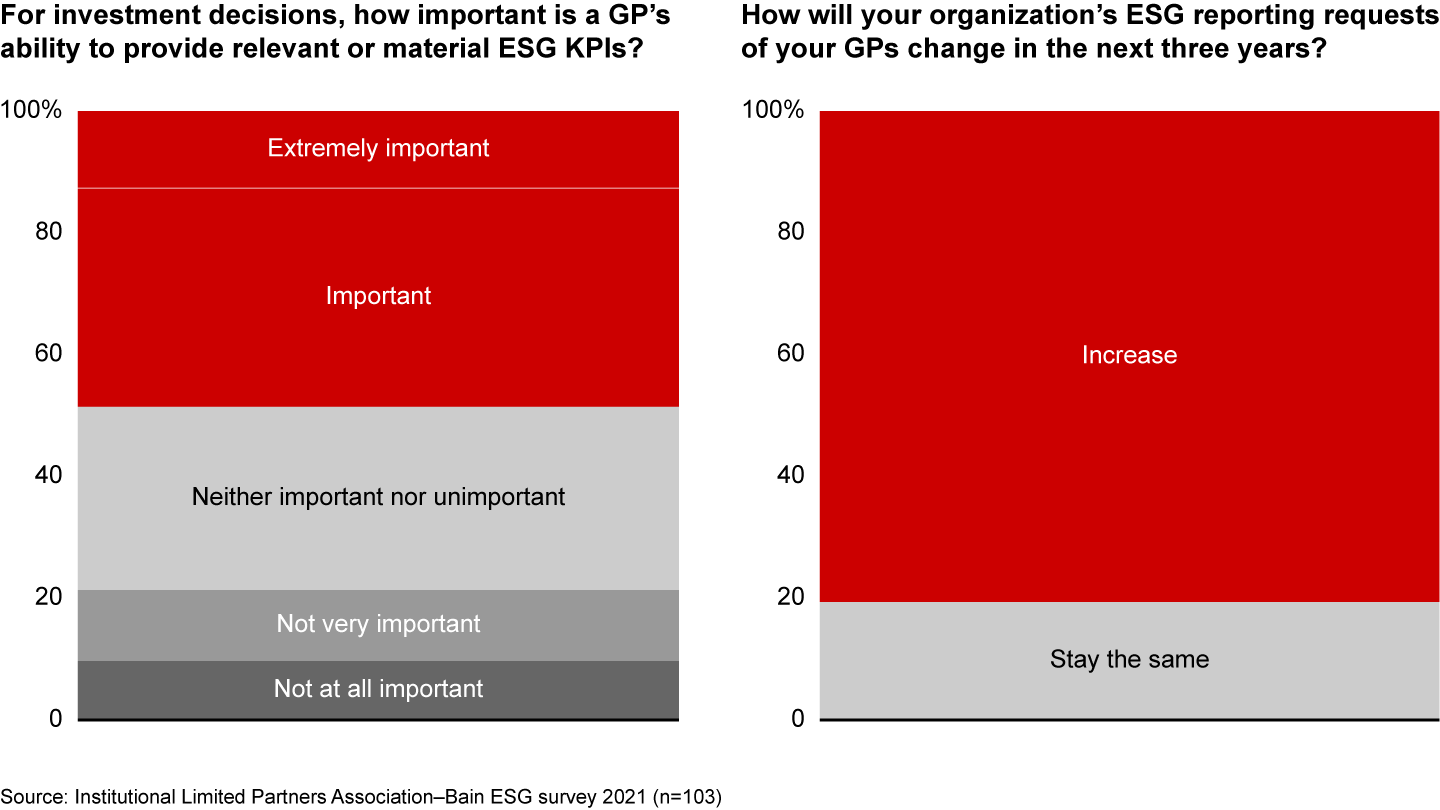
Global LPs are raising the bar for GPs, including those in the Asia-Pacific region. Two-thirds of global LPs avoid investing in funds at the bottom of the ESG performance scale, according to the survey. Nearly 50% think it’s important to evaluate GPs’ ability to provide ESG-related key performance indicators (KPIs), and more than 80% of LPs plan to increase ESG demands on GPs in the next 3 years (see Figure 31).
ESG as a core investment factor
In the Asia-Pacific region, ESG is now a top priority for governments, businesses, and the broader community (see Figure 32). Countries in the region have recently pledged carbon-neutrality targets and begun implementing roadmaps and policies in line with US and EU targets. Moreover, the ESG regulatory landscape in Asia is evolving rapidly, making ESG criteria an increasingly integral factor in investment decisions.
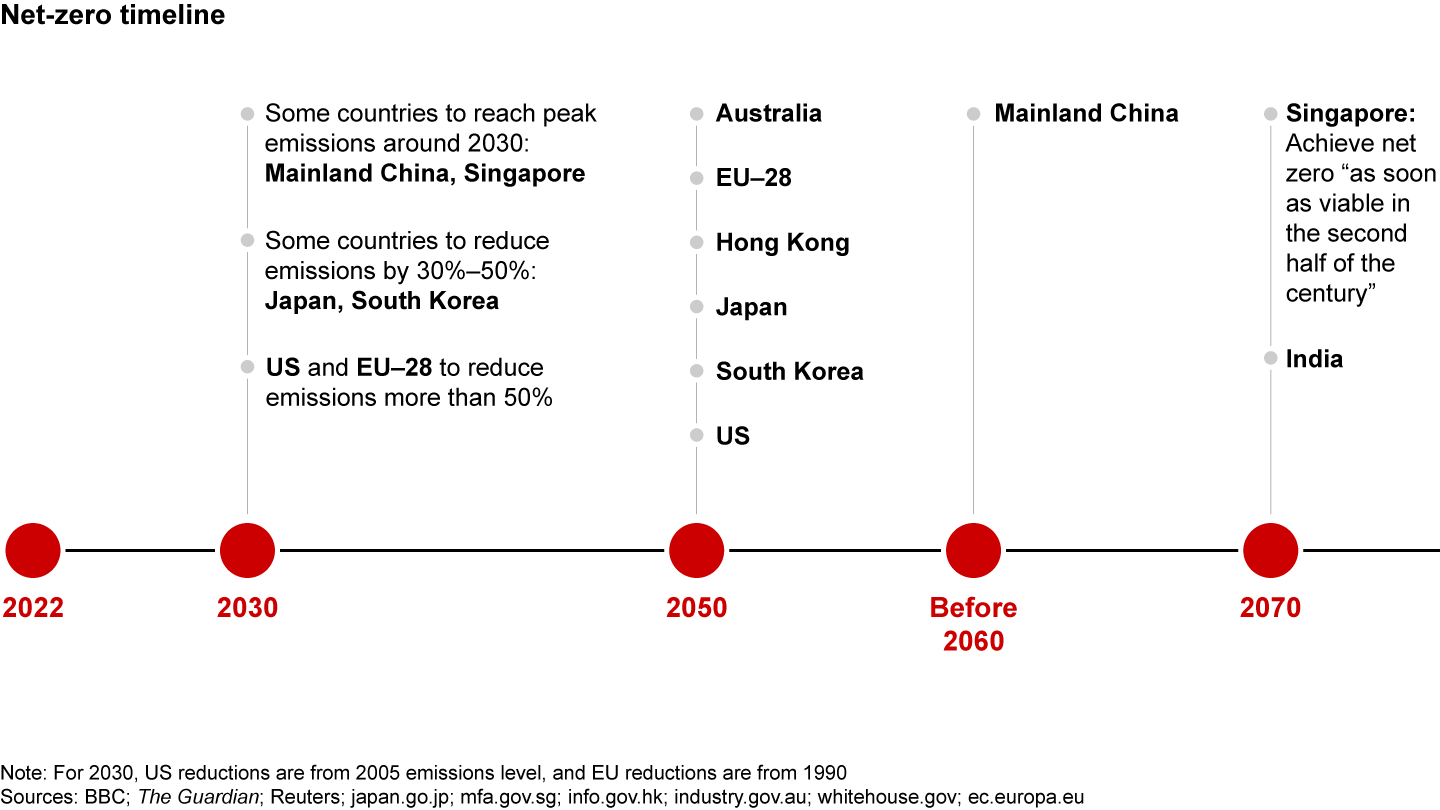
Over the past decade, governments throughout the region have implemented strict disclosure regulations for ESG data. Since 2020, for example, Hong Kong has required mandatory climate-risk reporting for all listed companies and pre-IPO ESG disclosures. In 2021, mainland China started requiring some companies to include a chapter on ESG disclosures in both annual and semiannual reports. And starting this year, India will require the country’s top 1,000 listed entities by market capitalization to submit a business responsibility and sustainability report.
As governments and regulators raise the bar on corporate transparency, many Asia-Pacific GPs are starting to build ESG principles into their funds’ investment strategy. Bain’s 2022 survey of Asia-Pacific GPs shows 57% plan to increase their ESG effort significantly in the next 3 to 5 years, compared with 41% in 2020 and 30% in 2019 (see Figure 33). Leading investors are using the global momentum to address climate change as an opportunity to shift from a narrow, carbon-only approach toward a more holistic ESG strategy. They’re going beyond compliance with regulations and seeking investments that will have a positive environmental or social impact while creating value.
According to the Bain-ILPA study, LPs see two key challenges when integrating ESG into the investment process. Almost 70% said it’s hard to quantify and monitor ESG performance, and around 50% point to the lack of harmonized reporting standards, which makes it difficult to set clear benchmarks. To surmount those obstacles, leading funds are defining their own approach to embedding ESG criteria in their funds and portfolios. Below we examine emerging best practices in embedding ESG principles throughout a fund’s investment strategy. Specifically, we explore how to operate better, invest better, and own better.
Operate better: Strategy design
It’s one thing to make a broad commitment to sustainability and sign on to ESG principles. It’s another to embed ESG in the full investment life cycle, from strategy and diligence to ownership and eventual exit. ESG tends to begin creating value in the medium term, and many funds are starting to see that approach pay off. In our experience, funds have shifted from viewing ESG as a risk management consideration to a value creation opportunity—and they’re embedding ESG in portfolio company strategy.
While almost all Asia-Pacific GPs we surveyed have taken some actions to acknowledge ESG principles in fund strategy, fewer than half have a well-defined ESG ambition, roadmap, and dedicated ESG team (see Figure 34). In our experience, organizations that fail to set clear ESG targets and translate them into a roadmap have difficulty identifying the right deals and adding significant value to portfolio companies.
Singapore-based investment company Temasek is a global leader in integrating ESG into investment strategy. At Temasek, ESG has evolved from an exploratory focus in 2015 to a core element of strategy, operations, and competitive advantage. The firm started by identifying the most relevant ESG risk factors in a target’s subsector, using material assessments to define the social and environmental topics that matter most to a business and its stakeholders. In 2017, Temasek’s focus switched from risk avoidance to value creation. But implementing the shift was a multiyear journey that included setting an ESG strategy, building a dedicated ESG team, and embedding ESG throughout the investment cycle.
To achieve its ESG ambition, Temasek invested heavily in management talent, including senior-level sustainability experts. It also trained deal teams and portfolio managers to be ESG experts in their sectors and make sure ESG is a priority throughout the organization. To underscore that goal, the CEO and senior managers regularly reiterate the fund’s ESG ambition.
Temasek has standardized the process of incorporating ESG considerations into investment decisions as it develops its strategy. The firm is evaluating an automated process to assess investments and seek value creation opportunities by continuously monitoring its portfolio. The company considers portfolio-level analytics a source of insight to augment its ESG strategy. Temasek is targeting several key areas to improve its ESG performance: decarbonization, diversity and inclusion, governance and anticorruption, and a circular economy aimed at recycling resources and eliminating waste.
In 2020, Temasek became carbon-neutral. The firm had introduced carbon price ($42 per ton of CO₂ emitted) to assess possible effects of climate transition and guide investment decisions. The leadership team is expanding sustainability-focused partnerships with investors and organizations, including a $600 million partnership with BlackRock to launch late-stage venture capital and early-stage growth funds for decarbonization, and a $150 million partnership with HBSC to establish a debt financing platform for sustainable infrastructure projects in Asia.
Invest better: ESG in diligence
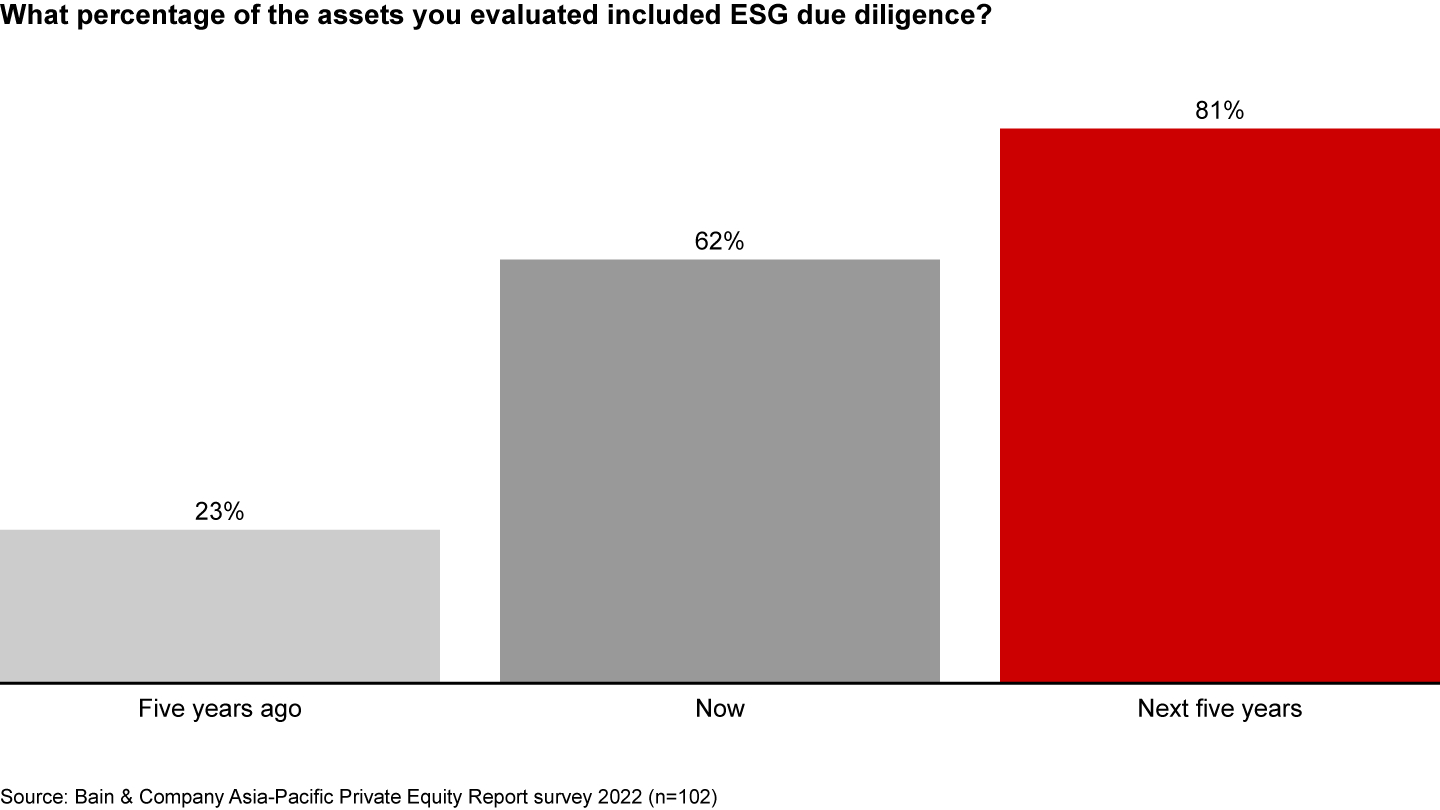
Of all the companies on which fund managers conducted due diligence in 2021, roughly 60% were assessed from an ESG perspective, a 40-percentage-point increase from 5 years ago. By 2026, fund managers expect that percentage to rise to 81% (see Figure 35).
The practice of incorporating ESG factors in diligence ranges widely from using a simple risk checklist to running a qualitative and quantitative assessment of potential upside and downside (see Figure 36). Best practice in diligence involves a dedicated ESG assessment alongside market, competition, and other evaluations—and a plan to create value after the acquisition. Currently, more than 80% of GPs do a red flag review, while fewer than 40% have a dedicated ESG module for diligence.
A three-step process can help GPs effectively incorporate ESG in diligence. The first step is a material assessment, which identifies the most relevant ESG risks in the target’s subsector. Amid the universe of ESG considerations, investors should prioritize the four to six factors that are most relevant to a particular industry and company. For each factor, diligence teams should examine the firm’s ESG maturity and sector trends, as well as potential disruptions in the target’s industry.
The second step in ESG diligence is benchmarking the company against its peers to identify best-in-class performance in the areas identified by the material assessment. The areas to measure include the company’s ESG commitment; ESG capabilities and reporting; historical ESG performance; carbon emission benchmarking; and diversity, equity, and inclusion. Other valuable sources of information are in-depth management interviews, including site visits, together with reliable, professional social network scraping and the target’s sustainability report.
Benchmarking ESG can be challenging because the data in some industries is either unavailable or fragmented and difficult to compare. EcoVadis, a leading global supplier of business sustainability ratings, addresses this problem by assessing ESG maturity and performance for a target’s peers and the overall industry, and identifying focus areas for diligence and catalysts for value creation.
The third step is setting targets and quantifying the potential gains from specific ESG initiatives and capabilities (see Figure 37). This includes identifying any risks or red flags that require immediate action. Leaders calculate the ESG value creation potential and determine the initiatives and capabilities needed to achieve it. Interviews with industry peers and pressure testing the management plan can help investors understand the kind of gains that the best companies are achieving.
Own better: ESG value creation in the portfolio
Leaders plot both defensive and offensive moves to make sustainability a source of competitive advantage. However, many GPs who have just begun considering ESG as an investment factor may not realize how much it can affect value creation. Only 29% of GPs say value creation is the main reason to pursue ESG. The majority embrace ESG principles primarily to comply with government regulations, mitigate risk, or adhere to LPs’ demands.
There are three approaches to generating value through a strong ESG focus, and they depend on the portfolio company’s profile. Firms often start with a rapid diagnostic as a precursor to a bolt-on blueprint or full value creation plan.
- ESG rapid diagnostic: A quick benchmarking of the company on key risk areas, based on available data. External experts pressure test the management plan and provide insights about strengths and gaps. Roughly half of GPs have done such diagnostics.
- ESG bolt-on blueprint: A complete benchmarking of risk areas followed by design of a strategic foundation for ESG ambition, including regulatory and customer trends and stakeholder inputs. Outline the initiatives for key risk areas and top-down value creation, then develop a plan to execute them. Complete cost estimates.
- ESG value creation plan: A full benchmarking to create a strategic foundation including detailed action plans for costs and benefits, targets, key performance indicators, and dashboards to monitor and implement actions. Value creation plans also focus on team mobilization, communications, and capability and organization building. Fewer than one-third of GPs have embedded an ESG value creation plan into the overall portfolio company strategy.
Decarbonization as an ESG cornerstone
While ESG is a broad theme that covers many topics, decarbonization is at the core of all ESG strategies. The recent COP26 meeting underscored this point. LPs and markets increasingly expect transparency and commitments toward decarbonization.
Leading PE firms are putting in place science-based targets to measure carbon emissions. In January 2021, the global investment organization EQT signed up for the Science Based Targets initiative, which helps companies set CO₂ goals in line with the latest climate science. EQT committed 100% of its portfolio companies to having their own science-based targets validated by 2030. Blackstone aims to reduce carbon emissions by 15% across all new investments within the first three years.
According to the Bain-ILPA survey, GPs often aren’t able to provide the relevant data on carbon emissions. More than 75% of GPs aren’t able to provide data on Scope 1 and 2 emissions (which measure greenhouse gases directly emitted by a company or by activities under its control, and indirect emissions from electricity used by the organization) all or most of the time, and fewer than 30% of GPs can provide data at the portfolio level on all principal adverse indicators (including greenhouse gas emissions or carbon footprint) all or most of the time. According to our 2022 Asia-Pacific GP survey, fewer than 10% of GPs have worked with external vendors that provide carbon footprint accounting and monitoring.
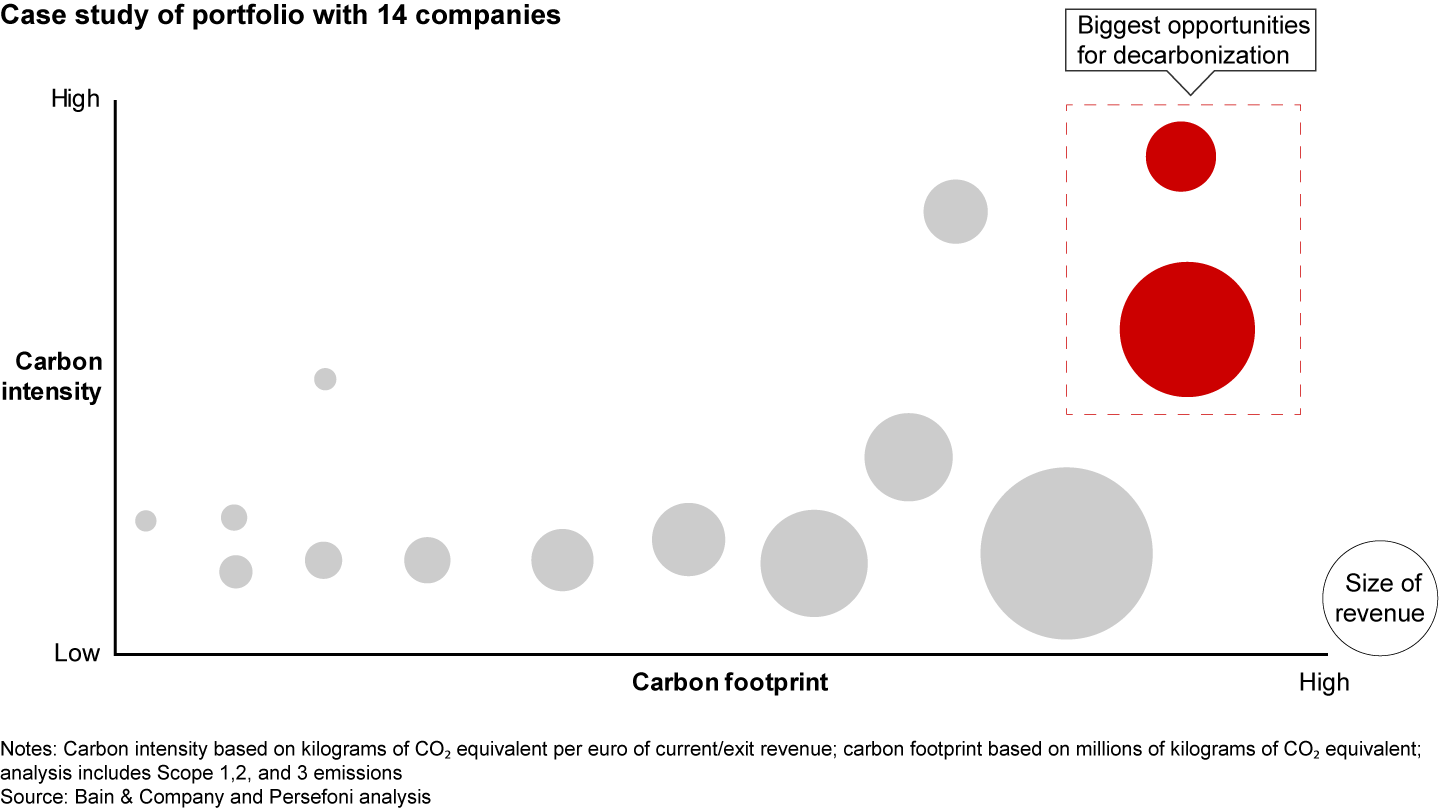
With COP26 pledges and targets, including Scope 3 emissions (which measure other indirect emissions related to the company), one no-regrets move for investors is to first conduct a preliminary assessment of their portfolio companies to understand the overall carbon footprint and the relative intensity among them. The next step is to help portfolio companies build the muscles they lack for long-term carbon accounting and management. Governments, regulators, and other stakeholders will increasingly require companies to include Scope 3 emissions as part of their carbon disclosure. Investing in automated carbon accounting capability will help them prepare for mandatory carbon reporting.
Some automated solutions for carbon accounting are starting to emerge on the market. Persefoni is a market-leading software-as-a-service platform that has a dedicated solution for private equity funds and their portfolio companies. The cloud-based application enables organizations to turn financial, operational, and supply chain data into certified carbon footprint data for use in LP disclosures or transaction and offering prospectuses. Portfolio companies also can use the platform for their internal carbon accounting and ongoing carbon footprint management.
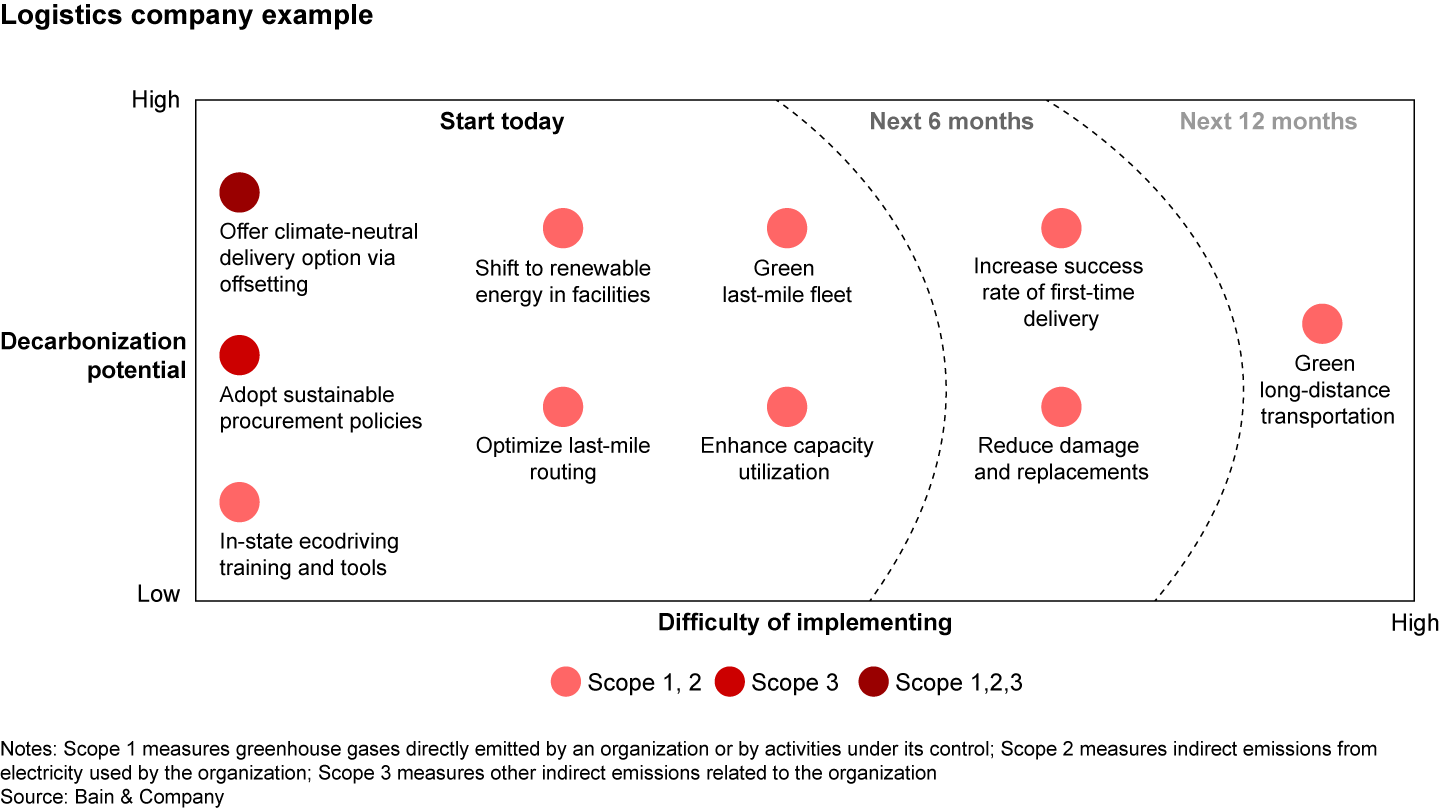
One leading global PE fund prepares auditable carbon footprint data using the Persefoni platform to manage its emissions and make strategic decisions on operations, supply chain, and decarbonization efforts (see Figure 38). The fund identified the biggest decarbonization potential in its portfolio and the reduction measures that would add the greatest value. That enabled it to prioritize its decarbonization efforts by the amount of impact. It also helped ensure that the portfolio companies could track value and decarbonization targets.
One Asia-Pacific PE fund applied a full-scope decarbonization strategy on a leading chemicals company based in Greater China (see Figure 38). The portfolio company’s decarbonization roadmap started with initial carbon accounting (Scope 1 and 2 emissions). A detailed benchmarking against industry peers highlighted opportunities to improve energy efficiency and clean energy usage.
The leadership team mapped out the relevant regulations and policies, including carbon emission trading and chemical sector targets. It then assessed upstream energy supply, such as the rising share of wind and solar power. Finally, it plotted downstream customer requirements, including future targets for Scope 3 emissions and potential disruption based on new technology.
The fund focused on maintaining top-line growth at the chemicals company and implementing decarbonization initiatives. It assessed the financial implications of different scenario targets and the required resources for existing business units as well as developing a new unit to develop green H2. Finally, it laid out a 10-year roadmap to reach its decarbonization goals.
ESG already has begun to significantly shape the private equity industry. In the coming decade, the transformation will accelerate. Leaders are taking bold steps now to ensure they’re on the front line of change. They’re pioneering the way forward, embedding ESG in diligence and portfolio value creation—a path that will improve sustainability and generate financial value.
Whether funds are at the beginning of the ESG journey or further down the road, we see three no-regrets actions that GPs can take now to prepare for a new era.
- Clearly articulate the firm’s overall ambition for ESG, backed by quantified metrics to track progress, and put in place the operating model to deliver it.
- Develop the deal team’s capabilities to assess ESG risks and opportunities for every potential deal, in screening, diligence, and value creation planning.
- Evaluate your current portfolio for the greatest opportunities and risks from ESG, then develop a roadmap to realize the value and mitigate risks. Setting a decarbonization agenda is a way to make quick, tangible progress.


