Rapport
 }
}
Executive summary
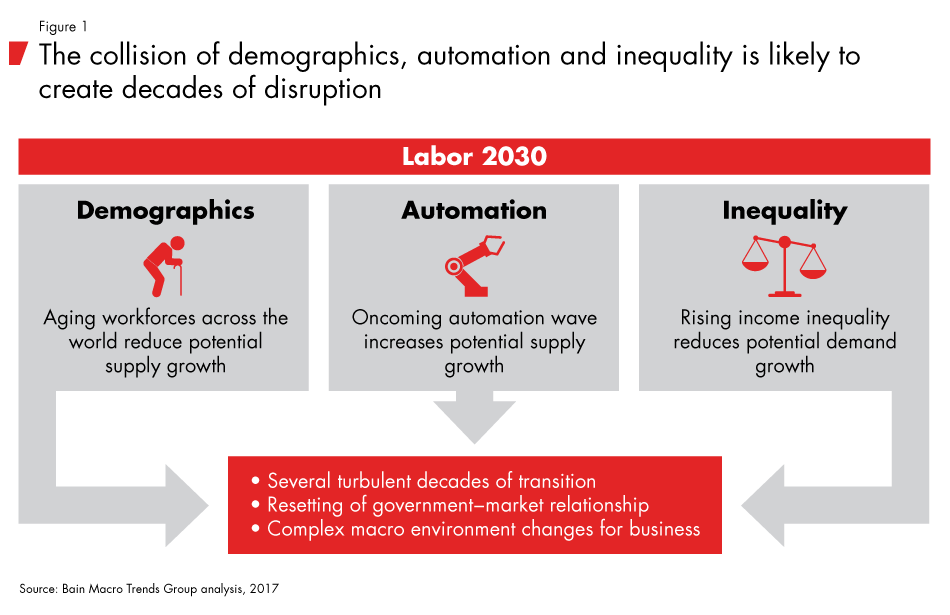
Demographics, automation and inequality have the potential to dramatically reshape our world in the 2020s and beyond. Our analysis shows that the collision of these forces could trigger economic disruption far greater than we have experienced over the past 60 years (see Figure 1). The aim of this report by Bain's Macro Trends Group is to detail how the impact of aging populations, the adoption of new automation technologies and rising inequality will likely combine to give rise to new business risks and opportunities. These gathering forces already pose challenges for businesses and investors. In the next decade, they will combine to create an economic climate of increasing extremes but may also trigger a decade-plus investment boom.
In the US, a new wave of investment in automation could stimulate as much as $8 trillion in incremental investments and abruptly lift interest rates. By the end of the 2020s, automation may eliminate 20% to 25% of current jobs, hitting middle- to low-income workers the hardest. As investments peak and then decline—probably around the end of the 2020s to the start of the 2030s—anemic demand growth is likely to constrain economic expansion, and global interest rates may again test zero percent. Faced with market imbalances and growth-stifling levels of inequality, many societies may reset the government's role in the marketplace.

Macro Trends Insights
Demographics, automation and inequality could dramatically reshape our world in the 2020s and beyond. Our insights discuss how executives can prepare for the new global economy.
The analysis and business insights in this report can help leaders put these changes in context and consider the effects they will have on their companies, their industries and the global economy.
Chapter 1 explores the impact of aging populations and the end of plentiful labor. The baby boomer generation powered a long but temporary surge in labor force growth. Now this group is moving into retirement, and labor force growth is slowing. That, in turn, imperils growth.
Chapter 2 examines how automation may solve one problem by increasing productivity and powering growth but creates another by potentially eliminating millions of jobs and suppressing wages for many workers.
Chapter 3 looks at how rising inequality could threaten growth. Demographic shifts combined with the next phase of automation will increase income inequality from already high levels. Middle- and low-income families are likely to be hit hardest, putting downward pressure on consumer spending and growth.
Chapter 4 traces how developments are likely to unfold in the turbulent 2020s. Investment in new automation technologies should fuel a period of robust growth. When it tapers off—sometime around the end of the decade, based on our estimates—growth is likely to become severely demand constrained.
Chapter 5 considers the outlook if governments intervene more actively in the marketplace to address economic imbalances. Their options include tax, labor market and regulatory interventions. The manner and likelihood of such interventions will vary greatly from country to country.
Chapter 6 focuses on the practical business implications of these trends for leadership teams, including the need to adjust to a macro environment that veers between extremes.
We call the coming period of upheaval "the Great Transformation" and define it through 10 interlocking themes, including the changing ages and stages of life, the rise of platforms and post-globalization in geopolitics. Our research indicates that the depth and breadth of changes in the 2020s will set apart this transformation from many previous ones.
Introduction
By 2030—little more than a decade from now—the global economy will likely be in the midst of a major transformation. Companies and investors grapple with changing conditions constantly, but our research points to an unusual level of volatility in the decades ahead. To understand why, we look at the three major forces that will shape the 2020s: demographics, automation and inequality. These forces are already in motion and set to collide.
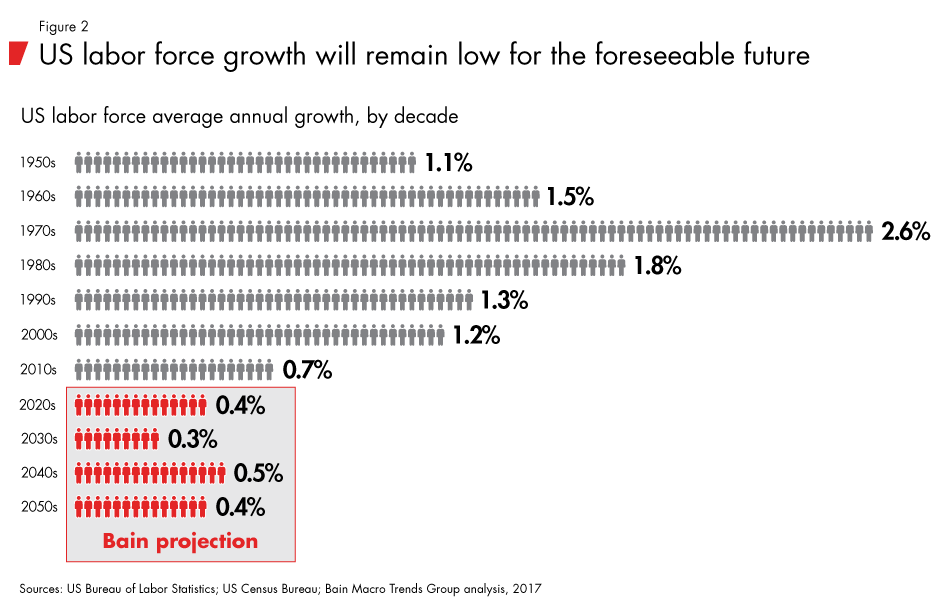
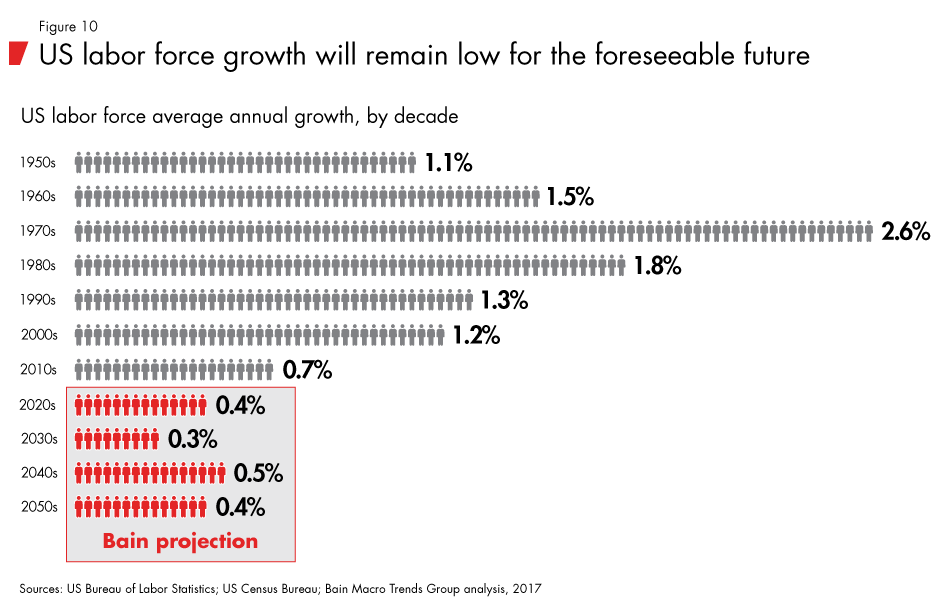
The majority of the world's workforce is aging rapidly. We forecast US labor force growth, for instance, will slow to 0.4% per year in the 2020s (see Figure 2). That major demographic shift is bringing an end to the abundance of labor that has fueled economic growth since the 1970s. Thanks to longer and healthier lives, many people are working well into their 60s and beyond, but the trend toward later retirement is not likely to offset the negative effects of aging populations.
As the total size of the labor force stagnates or declines in many markets, the momentum for economic growth should slow. If it does, governments will face major challenges, including surging healthcare costs, old-age pensions and high debt levels. On the plus side, the lagging wages of mid- to lower-skilled workers in advanced economies should benefit from the simple economics of greater demand and lesser supply. But demographics is not the only force in motion.
The next phase of automation has begun, and it will accelerate in the years ahead. Faced with a rising scarcity of labor, companies and investors are likely to draw increasingly on automation technologies, which, in turn, would boost productivity. But to grow, economies need demand to match rising output. Our analysis shows automation is likely to push output potential far ahead of demand potential. The rapid spread of automation may eliminate as many as 20% to 25% of current jobs—equivalent to 40 million displaced workers—and depress wage growth for many more workers.
The benefits of automation will likely flow to about 20% of workers—primarily highly compensated, highly skilled workers—as well as to the owners of capital. The growing scarcity of highly skilled workers may push their incomes even higher relative to lesser-skilled workers. As a result, automation has the potential to significantly increase income inequality and, by extension, wealth inequality.
For countries entering the 2020s with a relatively low level of income inequality, where demand growth does not already constrain supply growth, the widening divide may be easier to manage. But the two largest economies in the world—the US and China—have levels of income inequality at or near their historic peaks. Automation will likely further raise inequality.
If automation rolls out slowly, workers who lose their jobs will have more time to adjust, retrain or simply retire out of the workforce. A slow pace would avoid an abrupt spike in investments for newly automated capacity and create a relatively gentle push and pull between the need for more output capacity (due to unfavorable demographics) and more output potential (due to increased automation). In this scenario, the world economy would muddle through the shift to a more automated economy with lackluster growth but also less disruption. But a slow transition flies in the face of data on the quickening pace of technological adoption over the past half century. It assumes a sluggish pace not seen for a hundred years or so, since farming automation triggered the industrialization of the workforce in the West.
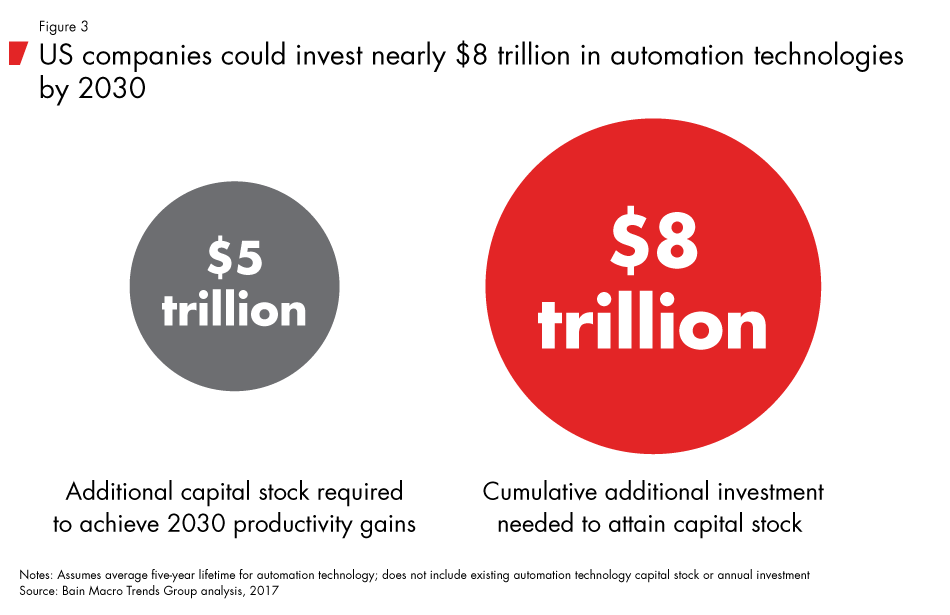
By contrast, a moderately more rapid rollout over 10 to 20 years would trigger a massive investment surge, up to an incremental $8 trillion in the US alone, based on our estimates (see Figure 3). Much of the added output potential would be directed back toward meeting investment demand, pushing overall growth rates back up to levels seen in the 1980s and 1990s.
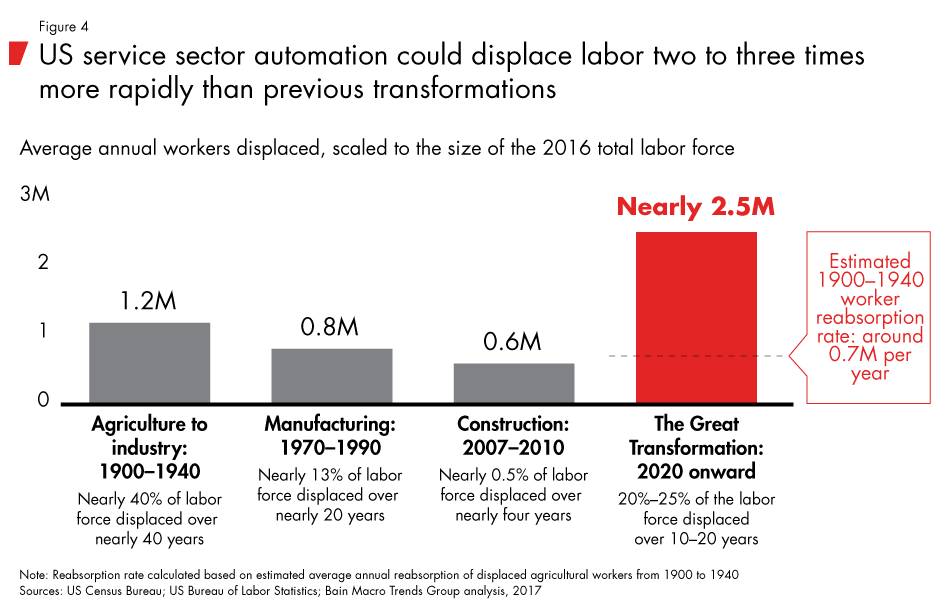
But rapid automation of the US service sector, for example, could eliminate jobs two to three times more rapidly than in previous transformations (see Figure 4). As the investment wave recedes, it may leave in its wake deeply unbalanced economies in which income is concentrated among those most likely to save and invest, not consume. Growth at that point would become deeply demand constrained, exposing the full magnitude of labor market disruption temporarily hidden from view by the investment boom. Over time, the interplay of these three major forces may produce an apparent contradiction—a dramatic surge in output potential that ultimately leads to stagnation.
What happens beyond that potential pivot is open to speculation. Optimists argue that the clear pattern of history is that creating more value with fewer resources has led to rising material wealth and prosperity for centuries. We see no reason to believe that this time will be different—eventually. But the time horizon for our analysis stretches only into the early 2030s, about 15 to 20 years from now. Relieving the imbalances causing the stagnation in that time period means changing the pattern of income distribution somehow, shifting income toward those inclined to spend rather than save. Many options exist, and different countries will choose different paths. But historically, governments confronted with serious economic imbalances often have opted for a more active role in reshaping market-based outcomes.
Our base-case scenario points to a radically changed business environment in the 2020s and beyond. Many large forces will be moving at once. Interest rates, for example, may dart upward during one phase and then fall back toward zero in the next. Some household segments may do fine for a while and then rapidly slip into distress—similar to the experience of the US middle class in the years up to, and right after, the global financial crisis. The impact on any given country will differ based on its distinct economic, social and governmental structures. Similarly, industries will face a different array of challenges based on their particular value chains, labor forces and national governments.
Business leaders, investors and heads of organizations and institutions will need to look beyond traditional targets and goals and develop the ability to adjust to a changing and volatile macroeconomic environment. That may require new performance metrics, planning techniques and even organizational structures.
Adaptability requires agility and speed. But equally important will be the strength to absorb sudden shocks and resilience to missteps and unforeseeable challenges along the way. Leadership teams that start thinking now about shifting resources to build resilience will be better able to navigate the broad arc of the coming transformation and cope with increased volatility as the forces of demographics, automation and inequality collide.
Some key implications follow.
Be wary of following market momentum—volatility will increase. The crosscurrents of multiple macroeconomic forces will ebb and flow at different times, making it dangerous to assume that signals indicate stable opportunities. Trends that had longer trajectories up until now, such as falling interest rates or even growth itself, may reverse course far more rapidly than in past decades. Companies can prepare for such shifts by making resiliency a high strategic priority and actively managing and monitoring macro risks.
Middle-class markets are likely to erode. Many consumer-facing businesses design and market goods based on a three-tier household model, including a small upper-income tier, a small lower-income tier and a broad middle-income tier. Pressure on the middle class may favor a primarily two-tier structure, with upper-income households representing roughly 20% and lower-income households making up the remaining 80%. This change would trigger a dramatic shift in the way that companies segment goods and services markets within and across these tiers.
Expect an interest rate speed bump. Interest rates are likely to rebound upward (potentially rapidly) in the next decade before dropping back toward historical lows, making capital management for businesses and capital preservation for investors more challenging. Since the 1950s, interest rates have tended to rise or fall gradually with patterns in one direction or the other, lasting decades. An environment of volatile interest rates would expose companies and investors to a greater risk of being caught with exposures pointing in the wrong direction.
Automation could fuel a 10- to 15-year boom followed by a bust. The next wave of automation investment will create many opportunities but will grow increasingly perilous as it builds momentum. Companies may feel competitive pressure to invest in automation technologies, similar to the way they felt compelled to create global supply chains in the 1990s and 2000s. But to avoid being caught on the wrong side of the investment cycle, businesses and investors will need to pay greater attention to monitoring their risk exposure as the investment cycle progresses.
Highly skilled, high-income labor will grow increasingly scarce. The pace at which displaced workers retrain and migrate toward higher-skilled jobs will likely be too slow to alleviate shortages. The challenge for companies will be attracting, growing and retaining highly skilled talent and maximizing worker's productivity by rethinking how their businesses are structured.
Baby boomer spending growth will peak in the 2020s before tapering. Compared with previous generations, baby boomers will extend the period of high-income earning and spending by about 10 years. The sheer size of this generation means there are considerable market opportunities for most goods and services, including big-ticket items such as housing and transportation. But growth based on this demographic shift will become more concentrated among the top 20% of households.
More government in more places is likely. Faced with rising inequality, governments are likely to become more interventionist, using higher taxes and regulation to manage market imbalances. Governments may expand their role in the marketplace, similar to what was seen in the West between the end of World War II and the early 1980s, by shifting resources as well as becoming a direct buyer of goods and services.
Intergenerational conflicts will potentially rise, drawing in businesses. As retirees and the working-age population battle for resources, businesses may become indirectly involved. Businesses, management teams and even shareholders may add their voices to the conversation about government transfers as they grapple with existing pension obligations, the scarcity of highly skilled workers, social pressure to address job losses and declining incomes among mid- to low-skilled workers.
What follows in the body of this report is the extended narrative of the collision of demographics, automation and inequality. How these major macroeconomic trends play out depends on many variables, and their combination and interdependencies add to the complexity of forecasting a likely scenario. Based on deep analysis, Bain's Macro Trends Group constructed an integrated scenario—a base case—for how these many moving parts could come together. We also discuss some alternate possibilities in subsequent chapters, recognizing that technology and innovation have produced unexpected outcomes over the past century. Chapter 6 covers some practical implications for businesses and investors looking to adapt to the volatile macroeconomic environment ahead.
Chapter 1: The era of plentiful labor is ending
The majority of today's business leaders take abundant labor for granted. Their careers have spanned an era of rapidly expanding global labor pools—an anomaly that is now ending. Three temporary developments converged in the 1950s to create the fastest labor force growth in modern history: the coming of age of the baby boomer generation, women's entry into the workforce, and the integration of China and India into the global economy. But shifting demographics, combined with technological and social changes, point to dramatically different labor market conditions in the coming decade.
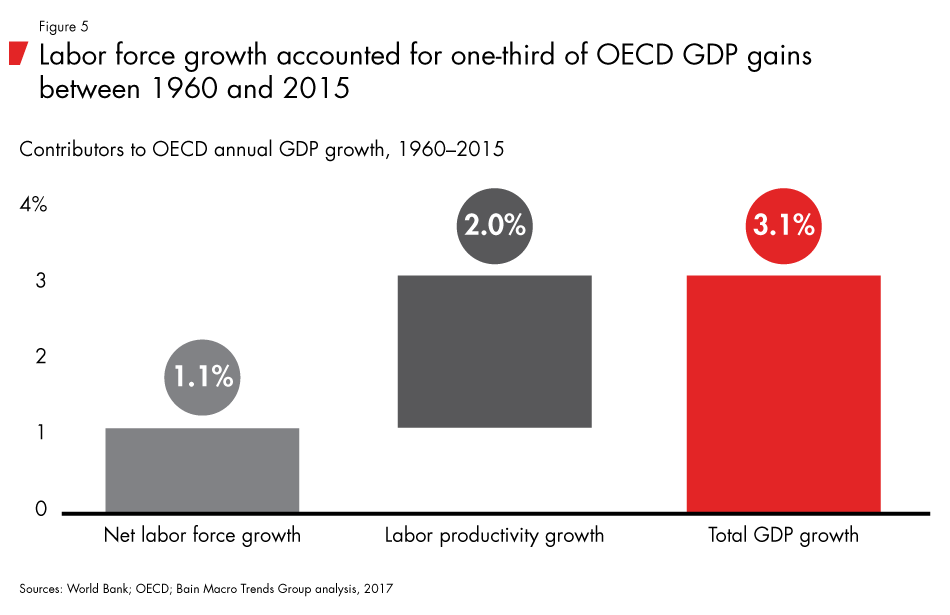
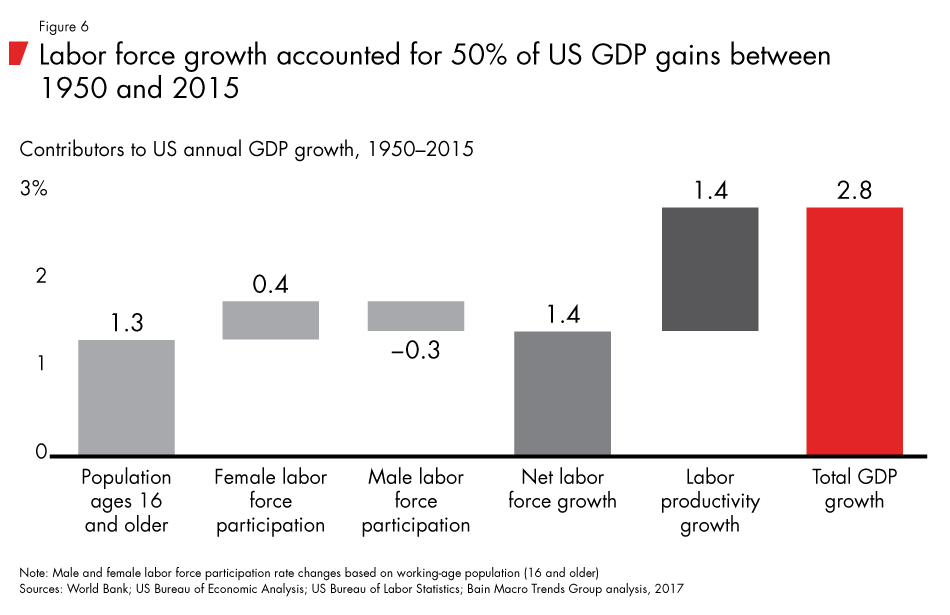
Labor force growth and labor productivity growth form the two halves of the equation that determine overall economic output growth. Labor productivity growth without the kicker from labor force growth can create an overall macroeconomic climate of stagnation—Japan's lost decades are a good example of this phenomenon. Between 1960 and 2015, one-third of total output growth among OECD member nations was due to labor force growth (see Figure 5). In the US, labor force growth comprised half of all output growth from 1950 to 2015 (see Figure 6).
But the three factors that created this powerful lift to growth—women entering the workforce, the opening of China and India, and the baby boomer generation—are now largely mature, and their positive boost to macro conditions is now fading. In 1950, for example, 35% of prime working-age women in the US were employed. That number increased to 50% by 1970 and 75% today. In OECD countries, about 43% of women were working in 1960, and that figure rose to about 73% by 2016.
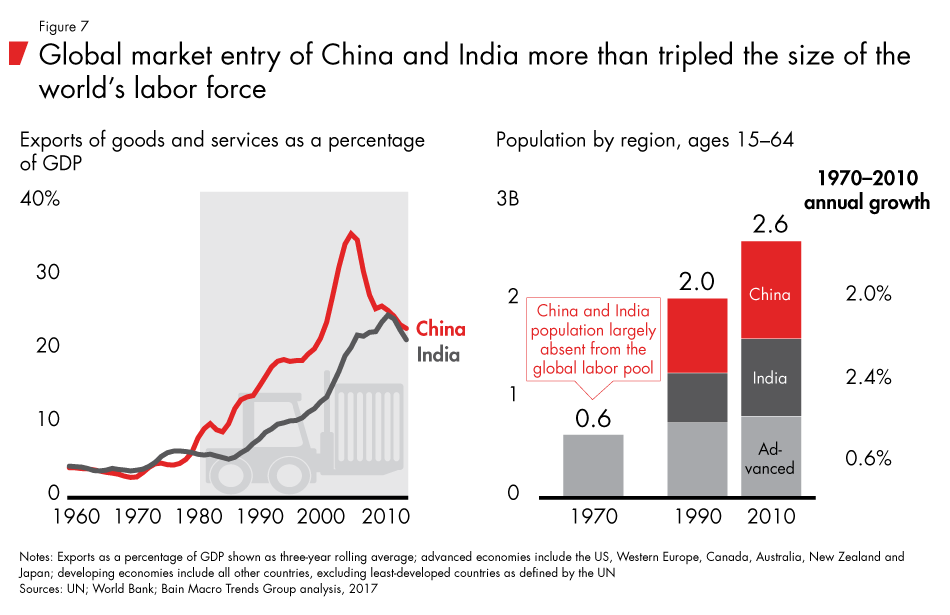
The early 1970s marked a major turning point in the development of the global labor market. Warming relations between the US and China set in motion the opening of China to the global economy. The Chinese labor force, along with India's, added 1.3 billion new workers to the global labor pool between 1970 and 1990 and powered the acceleration in the global trade of goods and services (see Figure 7). This phenomenon made the labor forces of China and India available to other countries through the export of locally manufactured goods.
Aging baby boomers
The biggest force powering the decades-long expansion of labor pools was the entry of the baby boomer generation into the workforce. Born in the 19 years following the end of World War II (1946–1964), baby boomers came of age as the full effects of antibiotics and vaccinations led to plummeting childhood mortality rates but before the mass introduction of birth control led to the declining birth rates now prevalent in developed and developing countries.
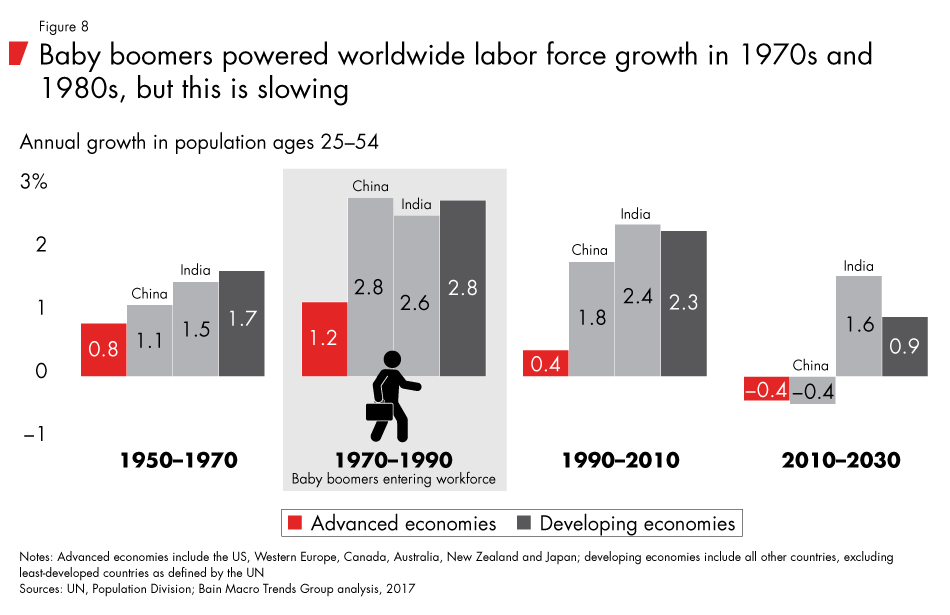
As baby boomers entered the workforce in the 1970s, nations around the world benefited from a demographic dividend. US labor force growth in the 1970s was 2.6% per year vs. 1.5% just one decade earlier. Advanced economies' growth rates rose to 1.2% per year in the 1970s and 1980s. China saw a near trebling of labor force growth rates, to 2.8% per year, in the 1970s and 1980s compared with 1.1% per year for the prior decades.
However, the sheer number of baby boomers around the world entering the workforce at the same time started a dramatic swelling of the labor pool that is now ebbing as baby boomers age into retirement (see Figure 8). Only parts of south/southeast Asia and Africa don't share this generational pattern. But these regions face other challenges in attracting large inflows of foreign investment and are unlikely to cushion the coming demographic debt.
Longer and healthier life spans have convinced many baby boomers to defer retirement, helping offset slower labor force growth. Thirty years ago, life expectancy at birth among OECD nations was 73.5 years. By 2015, it had risen to 80.3 years. Already, effective retirement ages have started to rise, a trend we expect to continue (see the sidebar "Life span expansion will slow").
At the same time, however, the cohort in their late teens and 20s study longer and enter the workforce later. That trend offsets the effect of delayed retirement. The reason is clear: The costs of economic adulthood, especially education and homeownership, have risen relative to incomes—65% to 70% higher in 2013 than in 1970, according to our estimates. We expect the slowdown in young people entering the workforce to continue for at least the next two decades (see the sidebar "The five ages and stages of life").
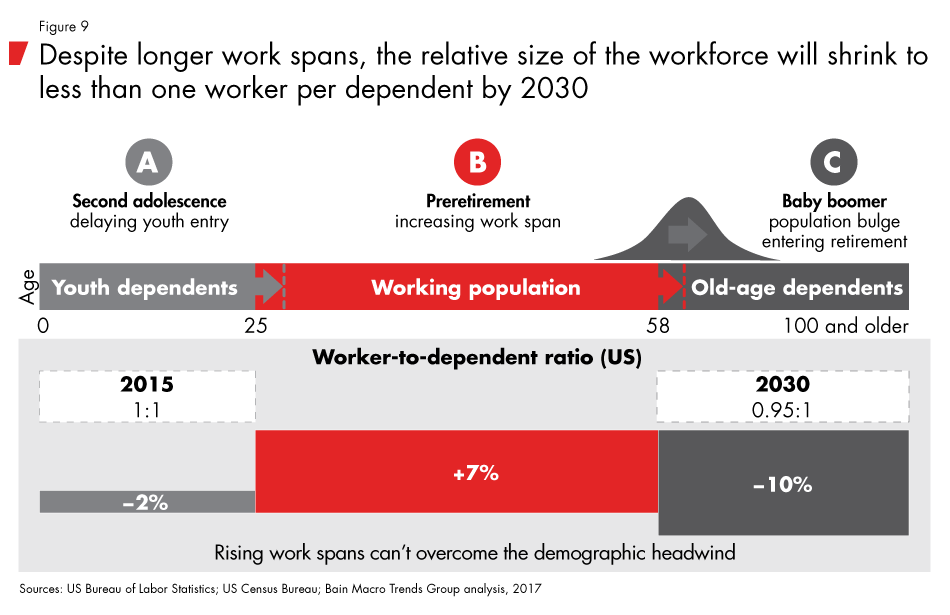
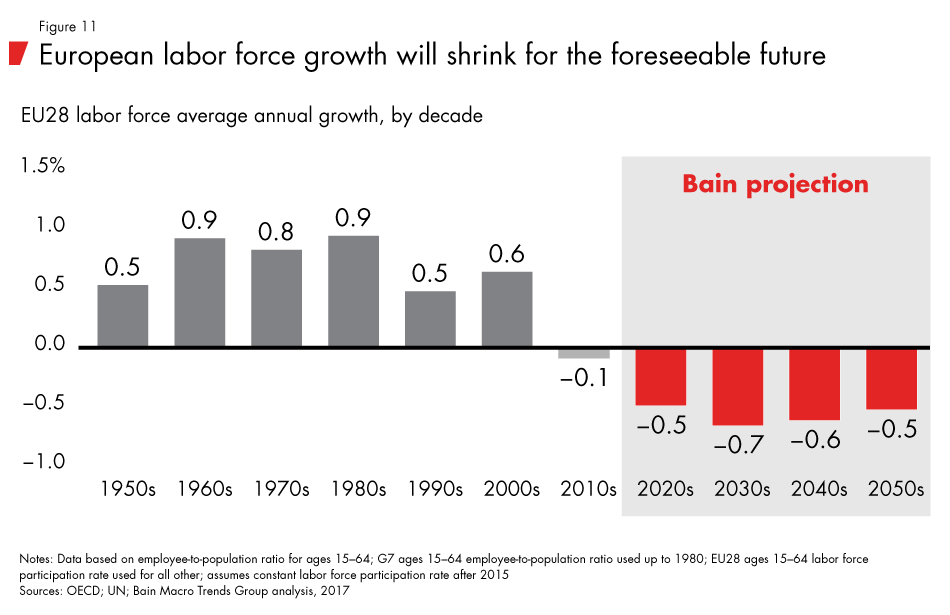
The net result of these trends—namely, older workers delaying retirement, younger workers delaying entry into the workforce and baby boomers moving into retirement—does not alleviate much of the global deceleration in workforce growth or, by extension, the rate of sustainable global growth. In the coming decade, the population of those age 65 and older will grow faster than the working-age population in OECD countries for the first time in history, leading to overall dependency ratios falling below 1:1 in some markets (see Figure 9). Labor force growth will slow to a crawl in the US, while Western Europe will experience outright shrinkage (see Figures 10 and 11).
$5 trillion GDP growth gap
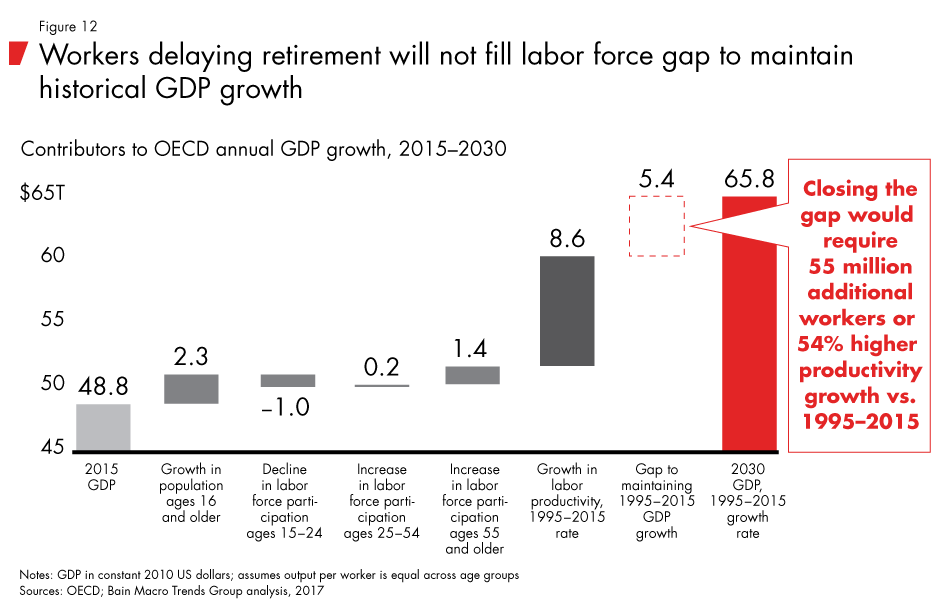
Bain Macro Trends Group analysis indicates that deceleration in labor force growth in OECD countries could result in a $5.4 trillion GDP shortfall by 2030 (see Figure 12). Historic labor force growth rates would have contributed $8.6 trillion to GDP growth over that period, but slower labor force growth will produce only $2.3 trillion. Increased labor participation of workers age 55 and older will add back $1.4 trillion, but that figure is offset by $1 trillion due to the declining participation rates of younger workers. In total, changes to labor force growth contribute $3 trillion, leaving a $5.4 trillion growth gap that can only be closed by a sharp increase in the productivity growth rate. China's situation is even more imbalanced due to its one-child policy. The combination of a baby boom followed by a baby bust will abruptly diminish China's labor pool and could aggravate labor scarcity.
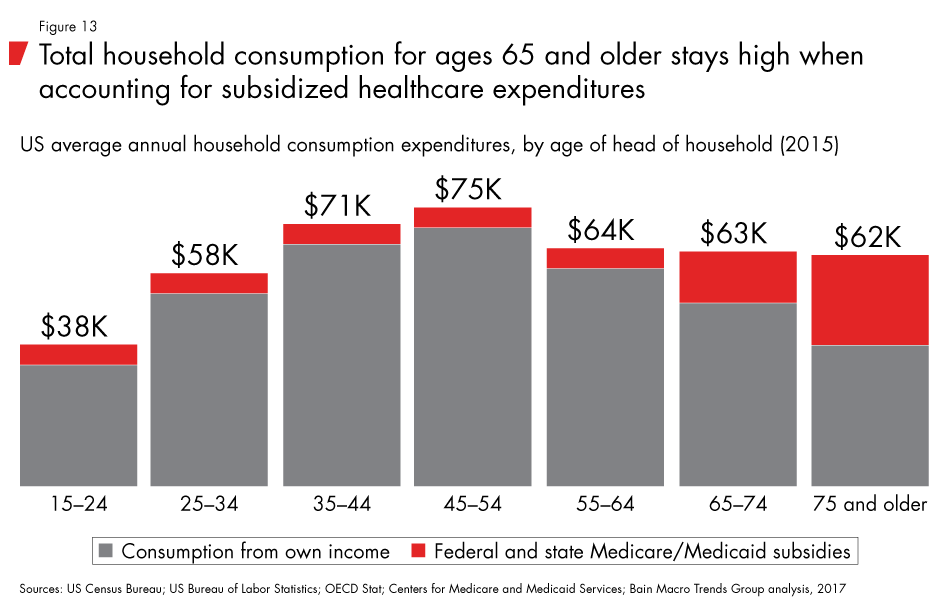
While the quantity of goods and services produced is likely to slow in the coming decade due to demographics, demand growth should remain robust. Older households generally consume more than they produce, making up the difference through financial savings. When we take into account off-the-books spending through public health systems such as the UK's NHS or Medicare in the US, households 75 years and older consume nearly as much as households headed by a 35-year-old, albeit in very different categories (see Figure 13).
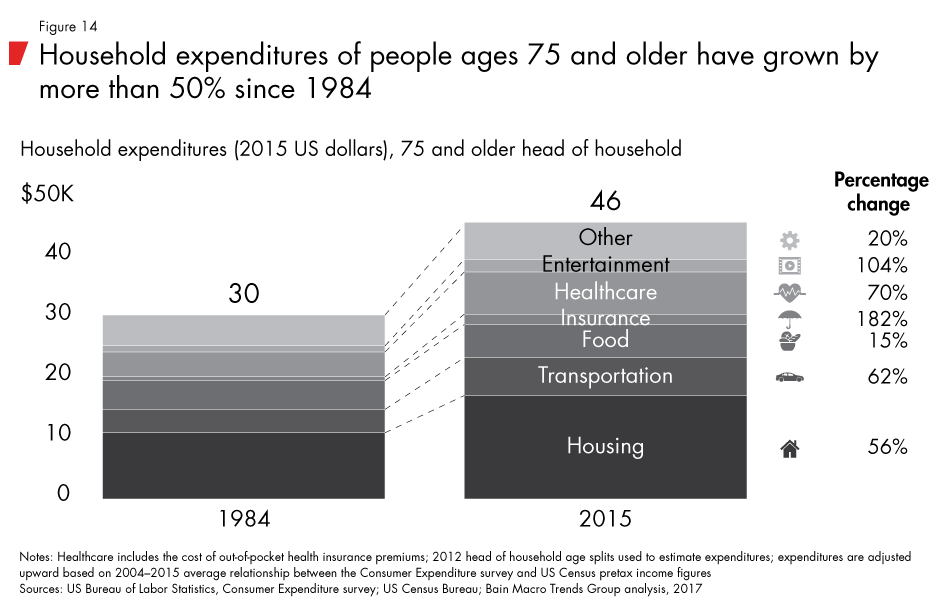
In addition, older households are spending more in absolute terms due to longer, healthier life spans. Between 1984 and 2015, households in the US headed by a person age 75 years or older increased spending by more than 50%. Out-of-pocket healthcare costs were a major component of the increase, but so were housing and transportation, illustrating a much broader range of products and services consumed (see Figure 14).
Risk to the financial system
For capital markets, the increased spending by an aging population could spell trouble. As people retire, they will be liquidating savings en masse. Financial savings are only backed by the real output potential of the economy, so the practical consequence for capital markets is likely to be too much capital drawdown chasing too little real capacity. Until now, the dramatic inflation of financial assets vs. the size of the real economy has masked the coming challenge posed by insufficient real growth to meet future obligations (see the Bain report A World Awash in Money).
But as baby boomers begin using assets and pensions, the large-scale liquidation of financial assets could lead to a drop in their value. One risk here is that guaranteed private or government pensions that similarly relied on financial asset inflation to meet future obligations will become highly strained or could break, especially at subnational levels of government.
Countries will have limited policy options to alter demographics at a national level and increase output: These may include increasing the supply of labor through increased immigration, incentives for more female workforce participation and improving workers' skills to raise their productivity. But given the breadth and scale of the demographic imbalances, these levers are unlikely to meaningfully offset declining labor force growth at the global level.
Good news for workers?
A shrinking labor pool should be good news for younger workers—scarcity raises their market value. And in the near term, this may be true. The immediate challenge for business over the next few years will be attracting and retaining workers, especially highly skilled ones who already are scarce. Employers will need to enhance existing incentives with higher wages, flexible work arrangements and more attractive corporate cultures. The declining cost of distance—the cost of moving raw materials, labor and finished goods—will allow many companies to offer employees the option of working remotely (see the Bain Brief "Spatial Economics: The Declining Cost of Distance"). Businesses that have not already done so may feel compelled to offer millennials a higher purpose to work—a sense of mission beyond shareholder value alone (see the Bain Brief "The Firm of the Future").
But the mid- and low-skilled workers that form the vast majority of the workforce—and the bulk of the middle class in most advanced economies—face at least a decade of disruption as new automation technologies begin to transform many industries and the world of work.
Chapter 2: Rising productivity solves one problem but creates another
Rising productivity offers the best hope for reversing the slowdown in global output growth resulting from demographics. But fully offsetting lower levels of labor force growth across the OECD will require productivity growth that is 54% higher than the 1995 to 2015 pace.
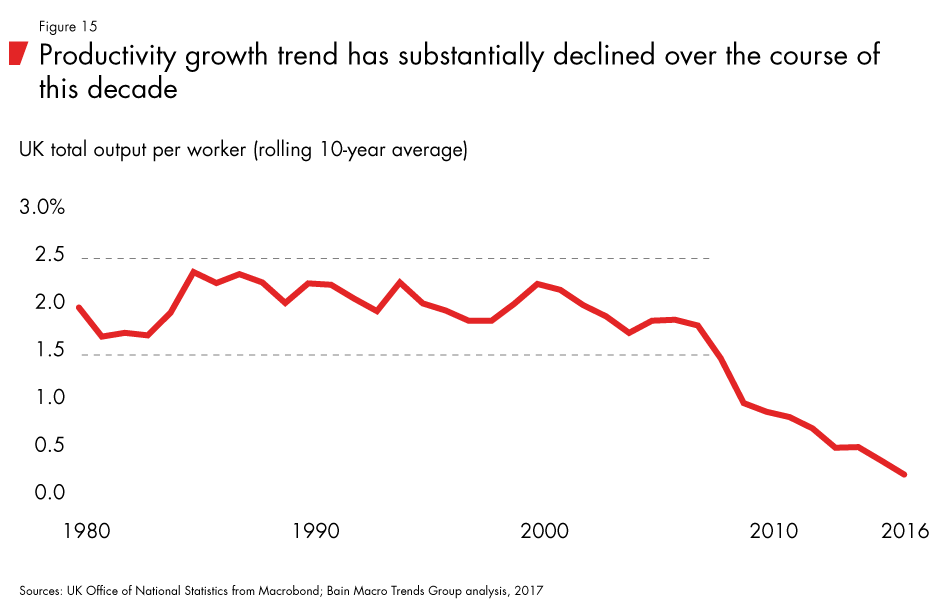
Growth in labor productivity—measured as output per worker—was relatively stable in advanced economies from 1980 up until the mid-2000s. However, since 2008, it has steadily declined to nearly zero (see Figure 15). Across the entire OECD, the same basic pattern holds: stable labor productivity growth of about 2% per year from the early 1980s up until 2008 followed by a sharp deceleration to about 0.7% on average this decade.
Some of the faster-growing emerging-market economies, especially China, have enjoyed extremely high growth in output per worker for several decades. Much of this impressive growth in productivity was a catch-up phase as emerging economies rapidly assimilated capital and global best practices. China's important contribution to global labor productivity growth will likely fade much as it did in Japan and South Korea when those economies moved past the catch-up phase. India remains a potential wild card for additional catch-up growth, although differences in its national governance and economic model make it unlikely to replicate the compressed growth that China experienced.
Though there are many theories attempting to explain this productivity deceleration, labor productivity will tend to decline when labor is plentiful, making capital investments less necessary. Labor productivity will also decline if workers are shifting toward sectors in which fewer capital options are available to improve their productivity. Both have been at work.
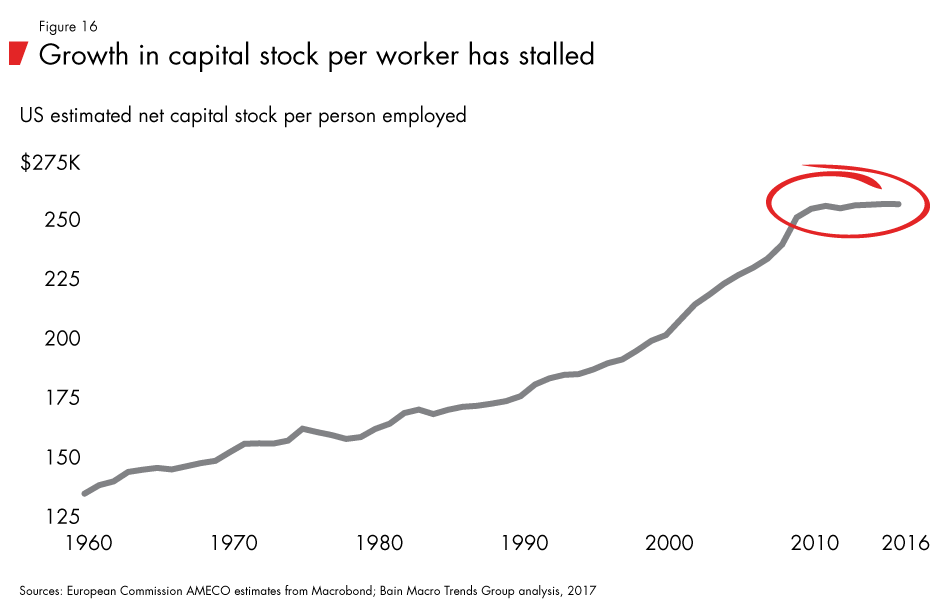
After the global financial crisis, the amount of capital deployed per worker (capital stock) stopped growing, most notably in the US but also in other countries, including the UK and Germany (see Figure 16). Without an increase in capital per worker, worker productivity won't rise significantly. The very low level of growth we see today—0.7% per year in the OECD—is essentially the slow crawl of progress with no additional boost from capital. In addition, labor became even more abundant—double-digit to high-single-digit unemployment rates were the norm across most large economies. But as labor becomes scarcer, companies will tend to invest more in labor-saving capital.
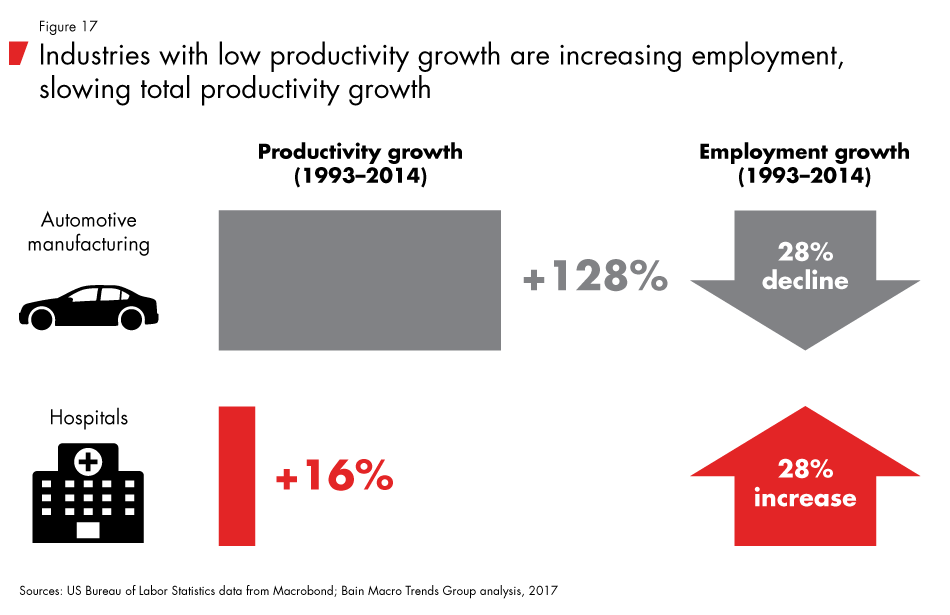
The shift to a service-led economy moves a large percentage of workers out of high-productivity growth industries into low-productivity growth industries. Take two contrasting examples in the US—the fast-growing healthcare industry and the auto manufacturing industry. Between 1993 and 2014, auto manufacturing output per worker increased by 128%. Over that same period, output per worker in hospitals increased by just 16%. In contrast, employment increased 28% in hospitals, while it declined by about the same amount in auto manufacturing (see Figure 17). Capital investment in auto manufacturing supported high labor productivity growth. While the overall quality of medical care in hospitals may have increased over time, it remains a field in which human touch is highly intensive, with fewer options for capital investment to boost labor productivity.
New technologies and innovation can create extraordinary jumps in material wealth and standards of living. They also generate surges in productivity growth. We expect the era of technological innovation in the coming decades to result in a sharp increase in productivity as automation replaces or extends human labor.
The Bain Macro Trends Group has analyzed a range of technologies at or near commercialization, including humanoid service robots, collaborative robots (cobots), drones, artificial intelligence and machine learning algorithms. These technologies will transform primarily the service sector of most advanced economies and some emerging economies. Based on our analysis, the rapid spread of automation will collide over the next decade with the demographic changes discussed in chapter 1, creating disruptive changes throughout the global economy.
Waves of automation have reshaped the economy throughout history. Agricultural automation freed farmers to migrate to factories, and industrial automation allowed factory workers to move into the service sector. Each time, the impact of automation on workers played out in three steps. First, by boosting productivity, automation reduced the need for workers in a given sector. Second, the relative cost of the goods produced by automation fell, increasing overall material standards of living. Third, as automation reduced the resources needed for producing one set of goods, those resources migrated elsewhere, increasing the production of other goods. This simple pattern has recurred many times, including the move from farm to factory and smaller instances such as the automation of bank teller services by ATMs. Despite some of the more dire predictions of "the end of work," over the long term, we see no reason to believe that automation of the service sector will depart from the historical pattern.
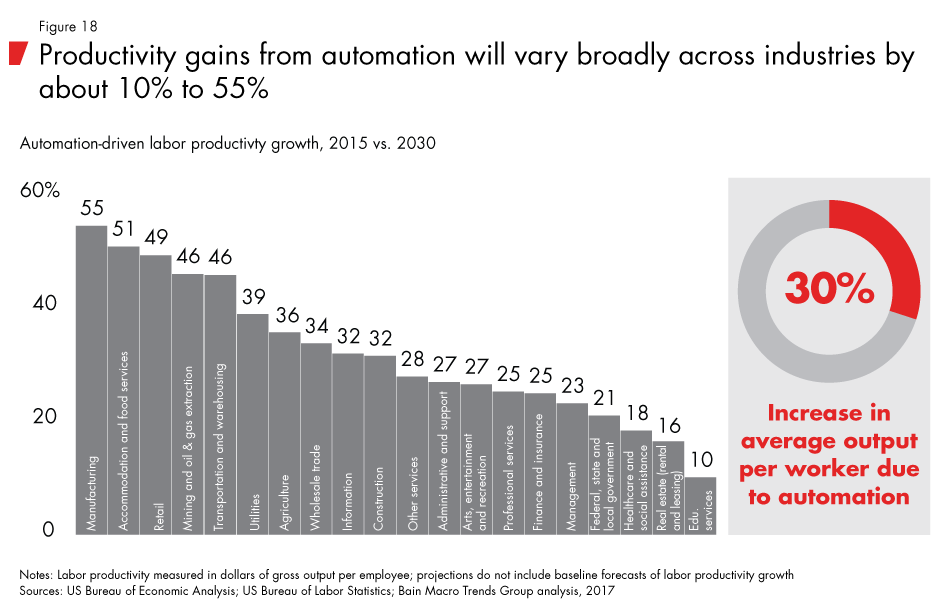
We estimate that by 2030 these technologies could increase labor productivity by an average of 30% compared with 2015, with rising impact over time. This step-change improvement varies considerably by industry and ranges from relatively modest levels in healthcare and educational services to substantial impact in industries such as food service, retail, transportation and warehousing (see Figure 18).
The impact of that change on annual growth rates depends on how quickly the change occurs. Productivity growth may range from as low as 0.6% per year to as much as 4.5%, averaging 2% to 3% per year. Even in a delayed scenario in which industries adopt automation more gradually through 2040, labor productivity gains from automation would still average more than 1% a year. That 1% growth would be more than enough to offset the demographic headwinds discussed in chapter 1 and possibly enough to push growth rates above those of the past two decades.
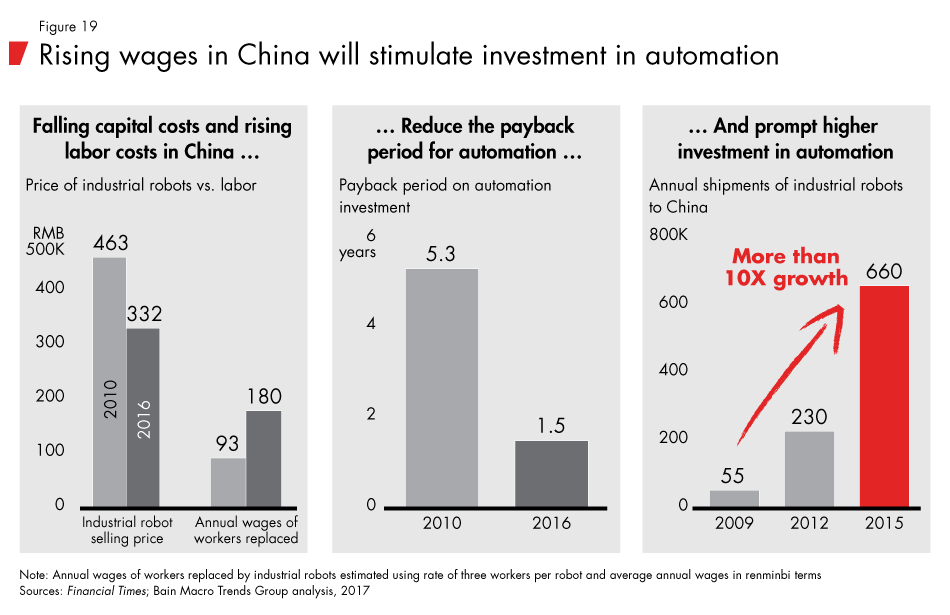
The declining cost of robot dexterity will unleash the next round of manufacturing automation. Machines based on first-generation automation technology, including industrial robots, were massive, bulky and often dangerous. They were also unsuited to high-dexterity tasks such as assembling the tiny parts of a smartphone. In 2010, the estimated payback period in China for replacing workers was about 5.3 years. By 2016, the combination of falling prices of robots and the rising cost of human labor had dropped the payback period to 1.5 years. By the end of the decade, it may fall to less than one year (see Figure 19).
The Taiwanese contract manufacturer Foxconn, China's largest employer with 1.3 million workers in sprawling plants, is a bellwether for the coming automation shift. The changing economics of automation has already led Foxconn and other Chinese manufacturers to heavily invest in next-generation robots. In one factory, Foxconn was able to replace 60,000 factory workers, or 55% of the total workforce, with robots last year.
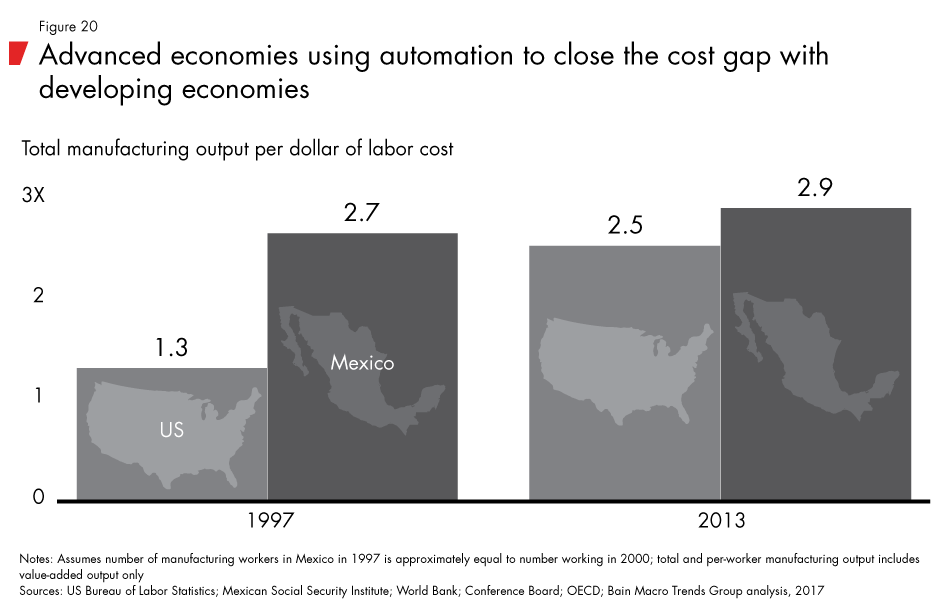
The impact of manufacturing automation on different geographies depends on many factors and is not the direct focus of this study. But it is worth noting that advanced economies are investing in automation to close the labor cost gap with emerging markets. In 1997, the manufacturing value added per dollar of labor was twice as high in Mexico vs. the US. By 2013, that gap had shrunk to less than 15% (see Figure 20).
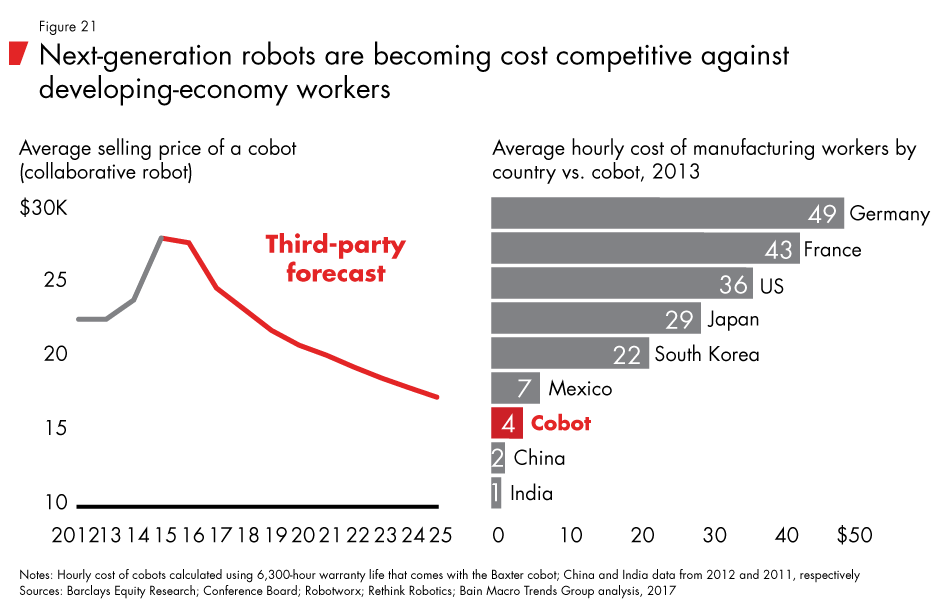
Cobots, which sit alongside humans to enhance labor productivity in manufacturing, are an example of how companies are closing the cost gap. These helper robots cost less than one-quarter the price of traditional robots, and by 2013, they were already cheaper than human workers in every advanced economy and most developing economies. By enhancing the productivity of their human counterparts, automation will likely make manufacturing costs attractive closer to home shores (see Figure 21).
Cobots and other high-dexterity innovations are particularly disruptive because they also may be deployed in many parts of the service sector as yet untouched by major productivity-enhancing automation. Based on our research, humanoid robots are likely to reach commercialization early in the next decade based primarily on the rapidly declining cost of robotic dexterity for service applications—the key obstacle to adoption today. Replicating the dexterity and precision of human hands is relatively expensive. In 2011, the Asimo robot by Honda wowed audiences by being able to pick up a thermos, unscrew the lid, and pour tea into a paper cup without spilling it or crushing the cup. The action was impressive though slow—barely matching the dexterity and speed of most five-year-olds.
Today, a set of robotic arms can fully staff a bar and mix drinks to spec on a cruise ship full of thirsty guests. Within a few years, we expect continued cost reductions will make a strong business case for the automation of many tasks in restaurant kitchens and bars. Already, high-dexterity service robotics are being experimentally deployed in settings ranging from food preparation to assisting in hospitals and nursing homes. Even less-dexterous robots and drones are being used as hotel bellhops to escort guests to their rooms, as waiters shuttling food to tables and even delivering hot pizzas to a customer's doorstep.
While engineers and companies are still experimenting with new automation technologies, they largely share a common set of hardware and software capabilities that will support a wide range of commercial uses. These capabilities include the range sensing required for an autonomous or assisted-driving car, spatial navigation used by camera-toting drones, image and voice recognition for online applications, and machine learning and artificial intelligence for document analysis and fraud detection.
Analytical, administrative or clerical service sector jobs with highly repetitive or rule-based tasks are surprisingly easy to automate. Artificial intelligence assistants can read and write emails and schedule meetings. Others can take in sports data and write natural-sounding articles to post on websites, doing at least the low-level creative work and freeing human writers to write more complex and interesting stories.
Automation is also likely to eliminate some well-paid service sector jobs. Law firms already are deploying algorithms to scan legal documents in lieu of highly educated and highly paid junior lawyers. In financial services, start-ups are focusing on automating tasks that are labor intensive—and therefore expensive—such as mortgage loan processing.
Financial services companies are rapidly automating investment analysis—a relatively well-paid occupation. In particular, hedge funds have been developing machine learning systems that perform the work of thousands of analysts at inhumanly fast speeds.
The migration to e-commerce is just automating retail services—replacing an entire suite of human functions from the floor salesperson or cashier with a web-based storefront and a payments-processing app.
Higher productivity but fewer jobs
While higher productivity is generally positive—it enables companies and economies to do more with less—any big jump in productivity can be highly disruptive and initially can take a heavy toll on employment.
To analyze the potential scope of job losses in services, we built on the work of other researchers, especially the Oxford University study examining detailed job activities scored along a gradient as more easily automated vs. not easily automated. Because their research, in turn, was based on highly detailed US Bureau of Labor Statistics analyses, our quantitative estimates focus specifically on the US. However, the results are likely to hold true in most other advanced economies and some developing ones.
Our analysis concludes that the coming phase of automation could eventually eliminate up to 50% of all current jobs. The job activity analysis only suggests the potential of technology to replace humans with hardware and software. It does not take into account the actual market conditions that would lead businesses to automate all work that could be automated. To arrive at an estimate of the likely impact of automation, we looked at the market context within which it could happen, considering four major factors: job scarcity; the impact of automation on the overall cost of a product or service; whether companies were likely to redeploy cost savings into higher profits, higher wages or lower prices; and finally, the impact of lower costs and prices on demand growth.
Using these four factors, we segmented the entire US labor force into distinct categories. In all, we looked at more than 16,000 combinations of industries and jobs. We used a balanced sample of more than 130 individual industry and job categories in detailed case studies ranging from nursing assistants and flight attendants to insurance underwriters and management analysts. This method enabled us to calibrate our findings based on what level of automation is possible and probable given technological progress in the next decade and beyond.
Labor market disruption
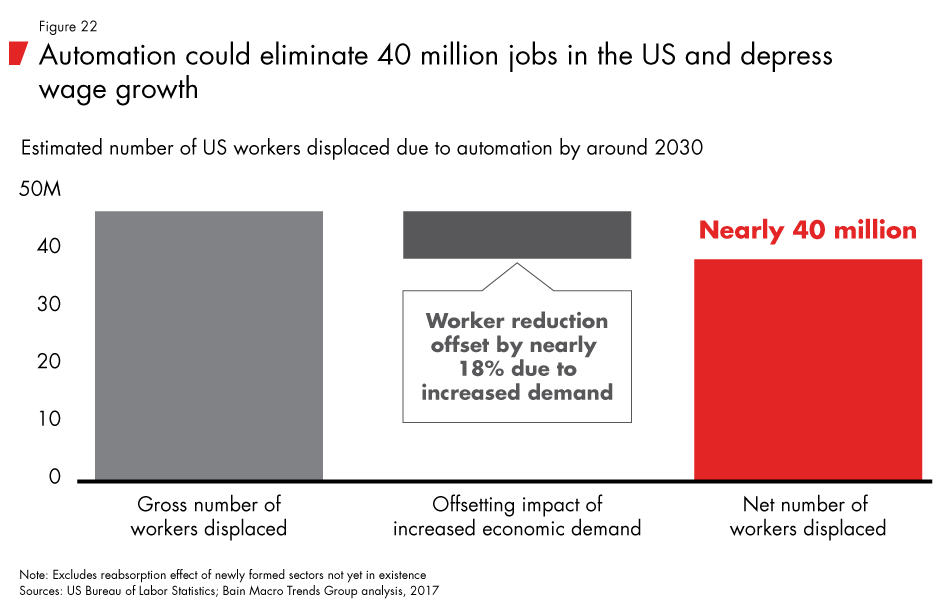
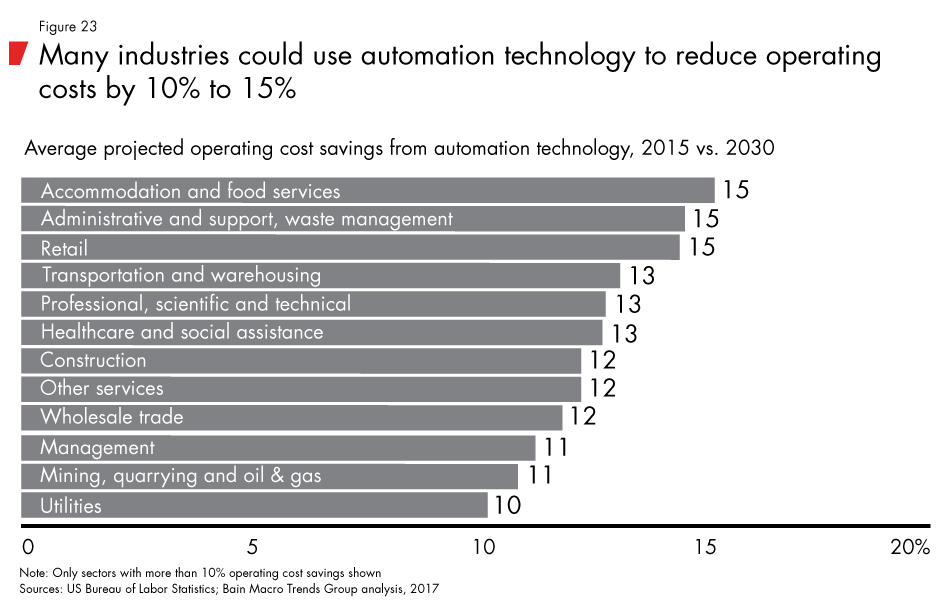
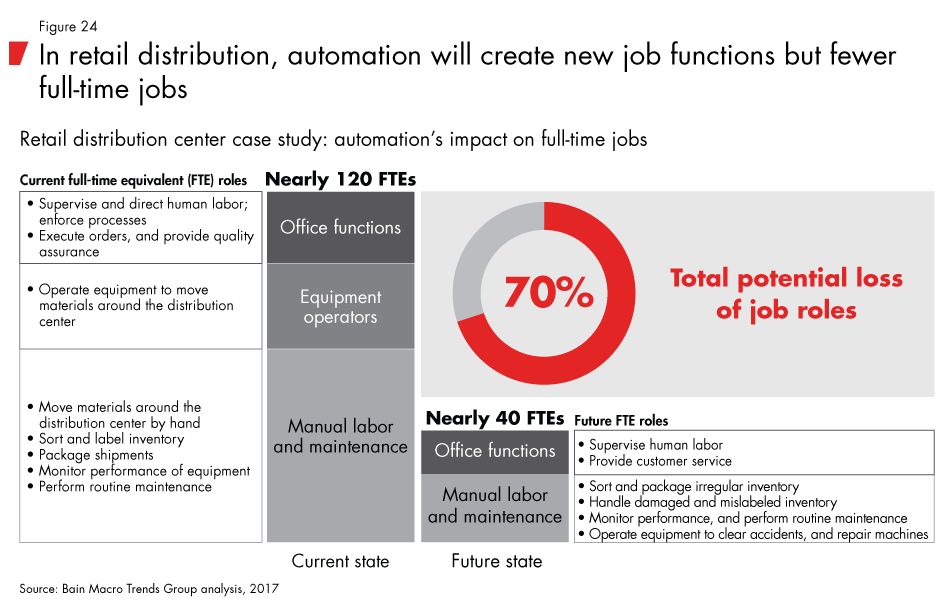
By 2030, employers will need 20% to 25% fewer workers, equivalent to 30 million to 40 million jobs in the US (see Figure 22). Automation technologies will affect each industry and occupation differently. In some cases, lower costs resulting from automation combined with high demand for goods or services may add back jobs in a given industry. Many sectors will be able to lower operating costs by 10% or more, including some of the largest service sector employers such as retail trade and food service (see Figures 23, 24 and 25). At lower prices, we will see increased demand for some products, which will offset some displacement. Without it, the total reduction in employment would rise to nearly 30% of existing workers, or almost 50 million workers in the US. To put these numbers in context, during the Great Recession, US employment fell rapidly from its peak in January 2008 to its trough in February 2010 by nearly 9 million jobs, or 6.3% of total employment.
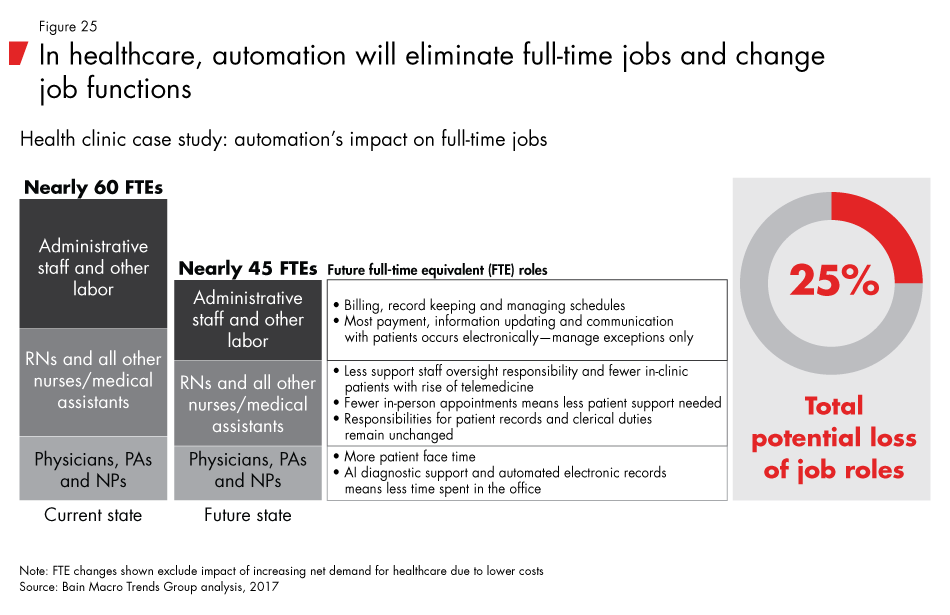
The full impact of automation likely won't play out until after 2030 because cheap labor will continue to be available in some sectors and some businesses will be slower to adopt automation. However, in some sectors, automation may put downward pressure on wages long before workers are displaced. For example, the introduction of self-service kiosks and smartphone-based ordering technology in quick-service restaurants is likely to place a ceiling on order-taking wages at the point which it becomes cheaper to automate than employ a human order taker. As long as wages remain below that point, employment levels will be unaffected by automation, but wages will be firmly capped. Our analysis shows approximately 80% of all workers will be affected in the coming decades by some level of wage stagnation, displacement or a combination of the two (see Figure 26).
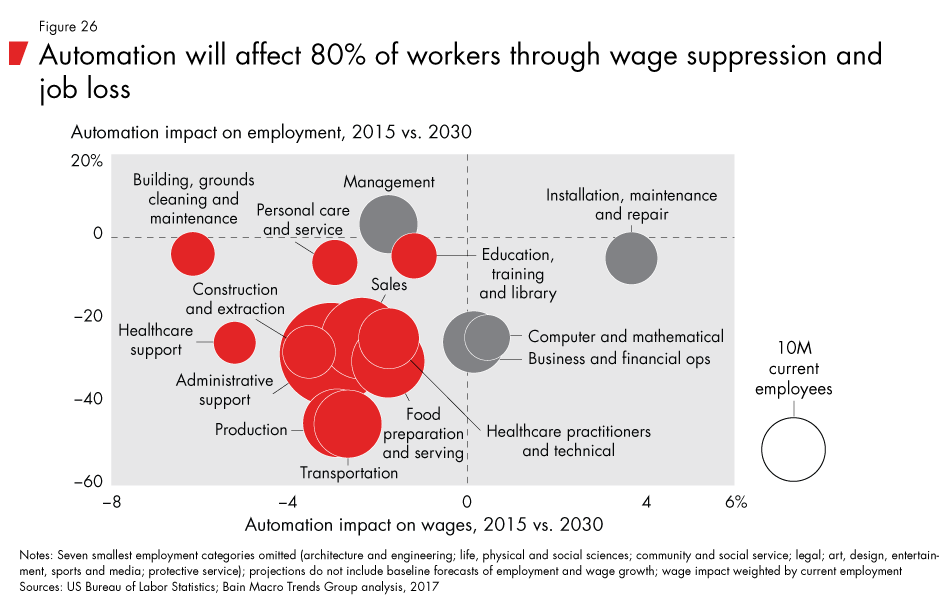
The impact of these effects is likely to vary even within the same job category. The combination of job type, industry and geography will determine the ultimate impact on wages and employment. While we have sought to model this set of factors with the available data, our projections are intended solely as a general framework to understand the scale and scope of potential changes. Many jobs have survived automation, despite predictions that they would disappear. Banks still employ bank tellers, for instance, although their roles have been redefined away from just counting cash and checks.
Finally, our analysis does not take into account additional third-order effects such as the introduction of new job categories. Social media marketing manager, for example, was hardly a job category 10 years ago; today it is among the fastest-growing fields. Automation will certainly create some new job categories—robot repair technician comes to mind—that will grow rapidly. However, given the magnitude of disruption in our base-case scenario, we do not believe new job categories will temper the degree of labor force disruption in the 2020s.
The speed of change matters
When seeking to gauge potential disruption, timing is everything. A large transformation that unfolds at a slower pace allows economies the time to adjust and grow to reabsorb unemployed workers back into the labor force. Under that scenario, the natural demographic cycle in the labor market—the entry of new workers and the exit of retiring workers—also helps rebalance the workforce toward new roles and away from declining occupations.
While the pace of technological change is arguably accelerating, we have seen no evidence yet that the rate of human adaptation to jarring economic dislocations has improved. If anything, the experience of the two recent US recessions points in the opposite direction—an aging labor force is becoming less able to learn new skills and find work. The demographic outlook for the next decades suggests that the labor force's speed of adjustment to disruptions might actually worsen.
Our analysis suggests that the pace of labor force displacement in the coming decade could be two to three times as fast as during other big transformational periods of labor automation in modern history (see Figure 27). In trying to estimate the coming dislocation, we looked at the peak movement from agriculture to industry and the movement out of manufacturing into services.
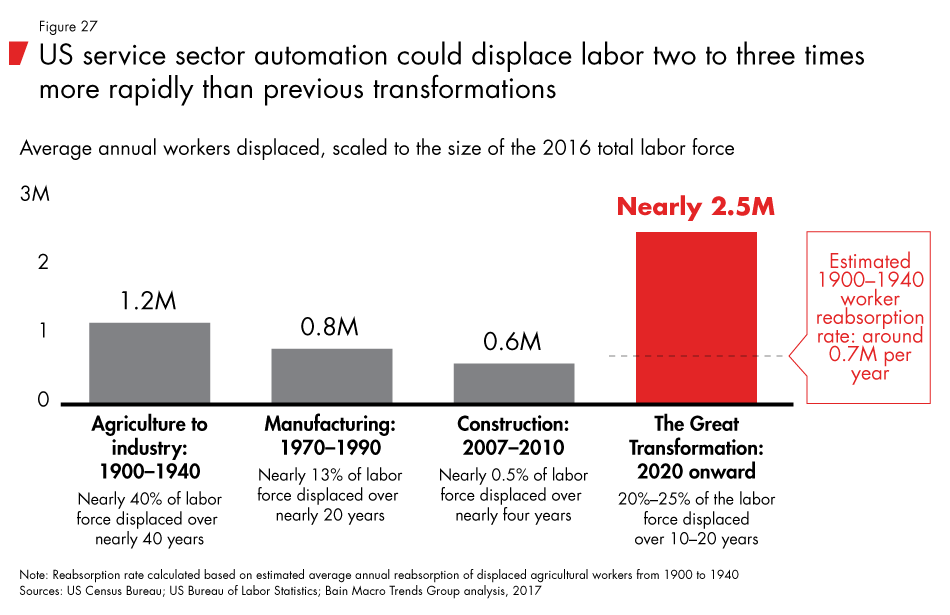
We expect the magnitude of workforce change in the 2020s to match that of the automation of agriculture from 1900 to 1940. However, the transition of farm workers into the industrial sector was spread out over four decades. In the case of the automation of manufacturing, the impact was over a shorter time period (roughly 20 years), but the share of labor force in manufacturing jobs was relatively small in the US. Investment in automation is likely to proceed moderately faster than agricultural automation or manufacturing automation unless other forces act to impede its progress, and it will affect a larger percentage of the total workforce.
The tension between the push to offset slowing labor force growth with automation and the pull to slow automation's rollout to prevent massive disruption will play out over the next 10 to 20 years. But once the first companies begin deploying new forms of automation, others are likely to follow suit rapidly to stay competitive.
The base-case scenario
Based on the magnitude and speed of change, our base-case scenario could result in about 2.5 million jobs per year lost or not created because of automation. Previous transformations provide an interesting comparison. The automation of agriculture transformed national economies and disrupted labor markets, culminating in the Great Depression. But if that event occurred today, scaled to the current population and labor force, it would displace 1.2 million workers per year. The rate of reabsorption from the automation of agriculture was about 700,000 workers a year.
Contrary to popular notion, the absolute number of workers in agriculture actually changed very little during that period of automation. Rather, change happened slowly enough that younger entrants to the workforce were steered into new jobs—the children of farmers moved to cities to work in urban factories. In effect, employment in agriculture was frozen in place for a generation while the rest of the economy rapidly grew around it. Despite this fairly optimal scenario—one that mitigated the full disruptive force of agricultural automation—the historical record indicates that this period was tumultuous for those working the agricultural industry and other fields experiencing large-scale displacement.
The automation of manufacturing in the 1970s concentrated on a narrower subset of industries, and the equivalent rate of jobs lost now plus those not created in the future would have been about 800,000 workers a year scaled to current population and labor force. Even today, the negative economic effects of this transition linger in the Rust Belt region of the US and areas of Western Europe.
We also looked at the ability of the US construction sector to bounce back and reemploy laid-off workers after the housing bust of 2007 to 2010. The scope was relatively small, but the effect was highly accelerated: Employment in the sector shrank by an average of 600,000 workers a year over four years, and it has taken about seven years of economic growth to reabsorb those workers. Though this is arguably cyclical job loss rather than a secular transformation, it indicates the challenge of reabsorbing displaced workers in a short time span.
Historical comparisons suggest tackling massive job loss from automation—including the eradication of entire job functions that are not replaced in the future—will be a serious macroeconomic and social challenge for most advanced economies. The common thread will be that disruption will have highly uneven impacts.
Local market differences may mitigate or exacerbate the disruption. For example, economies that have a high focus on building automation should be able to benefit from the capital investment cycle that automation will trigger. Countries with rigid labor markets may experience a slower pace of change and less disruption, but they may suffer from lagging competitiveness and productivity. Countries with highly flexible labor markets and effective mechanisms for shifting workers from one sector to another may be able to weather the transition with fewer ill effects. Fast-growing economies will likely have an easier time reemploying displaced workers.
Across geographies, the decline in manufacturing costs due to the next level of industrial automation is likely to negatively impact large exporters that compete based on lower labor costs.
In the industries hardest hit by automation, some of the remaining workers may be more productive and better off financially. For example, in food service, automation that reduces the number of waiters and waitresses in a restaurant by using machines to deliver food and clear tables could also increase the amount of tips per server of those who are not displaced (in markets where tipping is the norm). And as some elements of their work are automated, servers will be able to focus on providing customer intimacy and connection as part of an enhanced frontline role.
Automation may also lower the cost barriers to entrepreneurship. Online media has essentially automated away the newspaper delivery job and replaced it with a wireless or fiber-optic connection—just one of many changes in the migration from print to online media—but it also has lowered the cost of targeted advertising for local businesses that might otherwise have struggled for visibility. Now entrepreneurs can use social media postings, targeted search engine ads and email newsletters to launch businesses at a fraction of the marketing budget previously required.
The industrialists, engineers, inventors and businesspeople who are creating automation technologies and investing in them will be among the many to benefit from the change. Some of the multibillion-dollar companies of 2030 may be forming today as pioneers in the coming wave of automation.
Yet, the growing gap between the majority of workers who suffer automation's negative impact and the highly skilled few who benefit from it is likely to increase income inequality dramatically. Over time, an unchecked rise in income inequality risks choking off economic growth.
Chapter 3: How inequality threatens growth
Income and wealth inequality have been growing for decades and have now reached or exceeded historic highs in many countries. The rise has been most pronounced among the Anglo-American countries and China. But even in countries such as Japan and Sweden, the general direction of inequality has been up (see Figure 28). Demographics and automation are likely to exacerbate these trends.
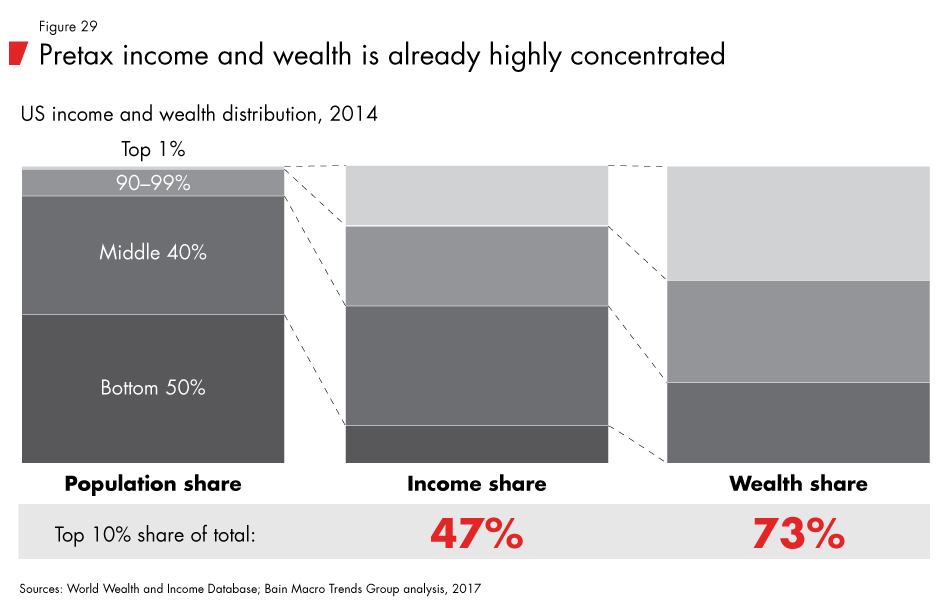
In the US, the share of pretax national income going to the top 10% of income earners stayed around 45% from the earliest records going back to 1913 until just before the start of World War II. After the war, it dropped to around 35%, until the 1980s, when it commenced the climb to its current level of 47% (see Figure 29). The UK followed a similar track, dropping from about 38% before World War II to a low of 28% in 1978, followed by a run-up to nearly 43% just before the global financial crisis. Sweden's Nordic model of democratic socialism shows the same pattern, albeit to a different degree. The top 10% received 22% of national income in 1982 before levels rose to nearly 31%. Japan's data also illustrates the trend despite its reputation for relatively more equal distributions; data does not exist prior to World War II, but the level of pretax income going to the top 10% is 41% to 43%, up from 30% to 35% in the 1950s through 1970s. Finally China, where no hard data exists prior to 1978, started the 1980s with about 27% of pretax income going to the top 10% and experienced a steady rise to a present level around 41%.
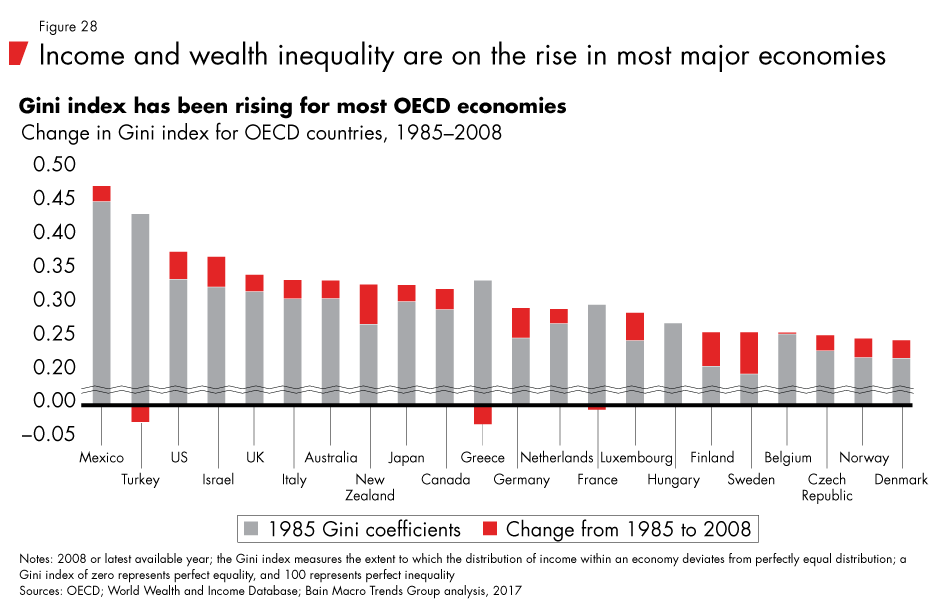
Data on the share of wealth for the top 1% and 10% of households shows the same basic patterns. Taken at a global level, the top 1% worldwide have increased 6 percentage points of share since the global financial crisis—from about 44% of global wealth to more than 50%. While there are obvious linkages between wealth inequality and income inequality—there is considerable overlap among those who are in the top brackets for wealth and top brackets for income—our focus is primarily on the context and future for income inequality, since income (essentially cash flow) impacts the macro environment most directly.
Inequality has many possible causes, including demographics, technological change and government policy. Our analysis focuses exclusively on the incremental impact of demographics and the next wave of automation and their potential consequences for the macro and business environment.
Demographics' impact on inequality
Aging populations typically increase wealth inequality because older households tend to have higher levels of accumulated wealth relative to a younger household at a similar socioeconomic level. Between 1983 and 2013, the peak years of household wealth advanced by about 10 years. Most of that shift came from the top 20% of income earners. While not directly tied to income inequality, shifting wealth inequality tends to shift income inequality in the same direction.
This form of inequality is arguably a less pressing societal challenge because it is transient. The bulge of baby boomers in high-wealth and high-income years vs. millennials in low-wealth and low-income years creates the mathematical basis for rising inequality. By itself, it does not stem from a lack of social mobility, and it should pass over time. But other causes of rising income inequality can be problematic. People with higher incomes enjoy a longer period of wealth accumulation because they tend to live longer and healthier lives.
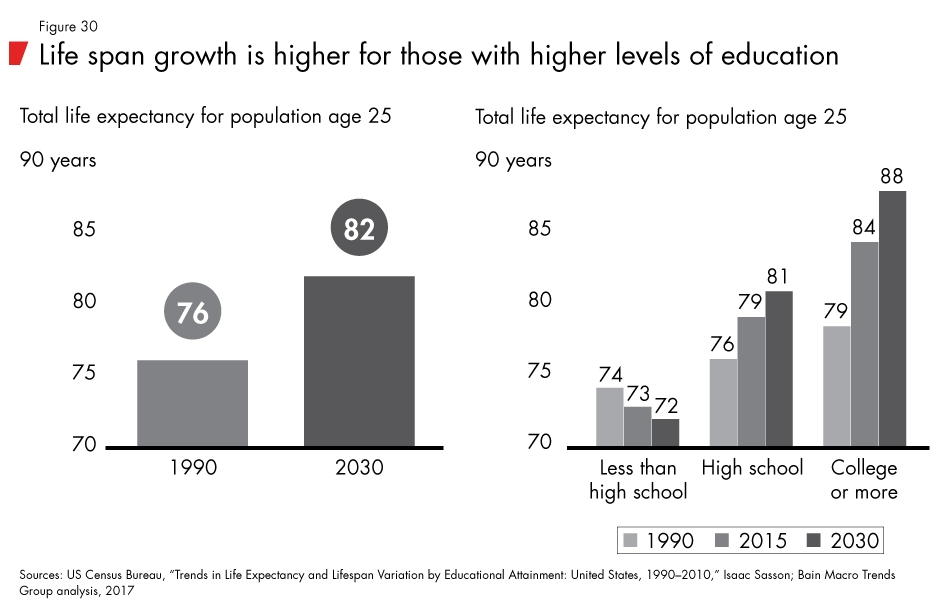
Between 1990 and 2015, the life expectancy for a 25-year-old in the US with a college degree or higher increased from 79 years to 84 years; for a 25-year-old American with only a high school degree, it increased marginally from 76 years to 79 years; for those without a high school degree, it actually declined from 74 years to 73 years. By 2030, the life-expectancy gap between an American with a college degree or higher vs. one without a high school degree is expected to widen even further, to 16 years (see Figure 30).
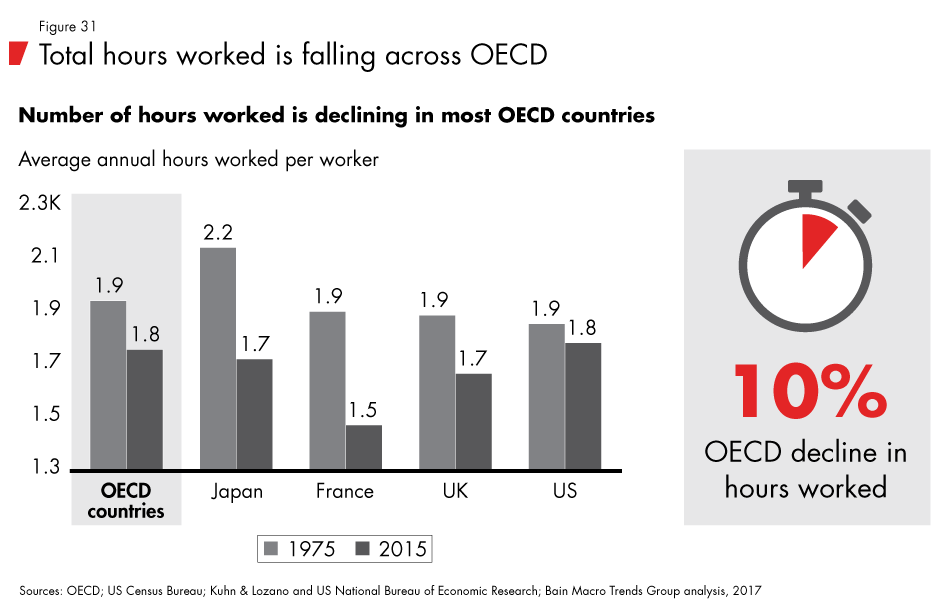
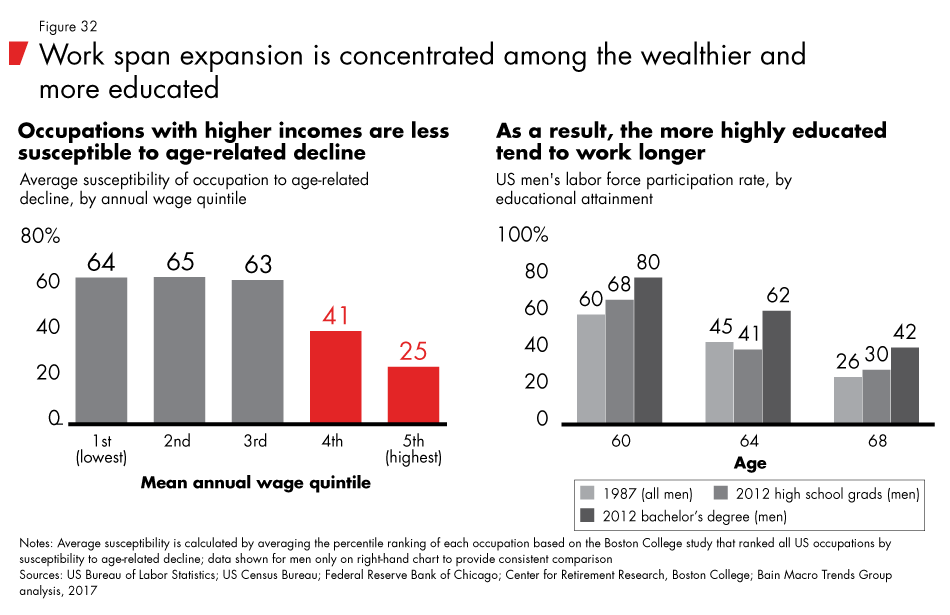
Living longer can lengthen the total span of working years and wealth accumulation. While overall hours worked are declining across the developed world (see Figure 31), the labor force participation rate for US men age 64 in 2012 was 21 percentage points higher for male college graduates vs. male high school graduates.
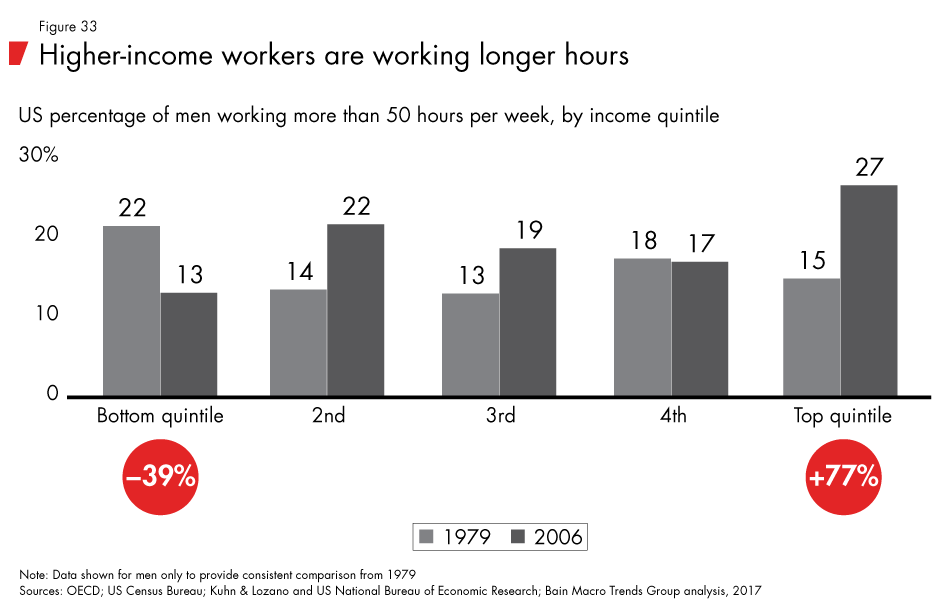
Higher-income workers are more likely to be in occupations in which physical decline is less of an impediment to working into one's late 60s or early 70s. Those in the bottom three income quintiles face a 64% chance of suffering an age-related decline in ability to work, for example, while those in the top quintile of income face only a 25% chance (see Figure 32). This divergence has resulted in higher-income workers working 77% more hours in 2006 vs. 1979, while the bottom 20% of income earners have seen a 39% decline over that same time period (see Figure 33). Because the main share of workforce growth will come from 55- to 74-year-olds over the next decade, the income inequality effect of demographics will become more pronounced.
Although we have focused this analysis on the US, a study by the US National Institutes of Health looking at life expectancy at age 65 for various educational levels found a similar, albeit smaller, effect in 10 Western European countries. The least-educated cohorts of Western European males at age 65 had the same life expectancy as their American counterparts. As in the US, life expectancy among different segments of the population in Europe diverged between the 1970s and 1990s primarily because life spans improved for the most advantaged.
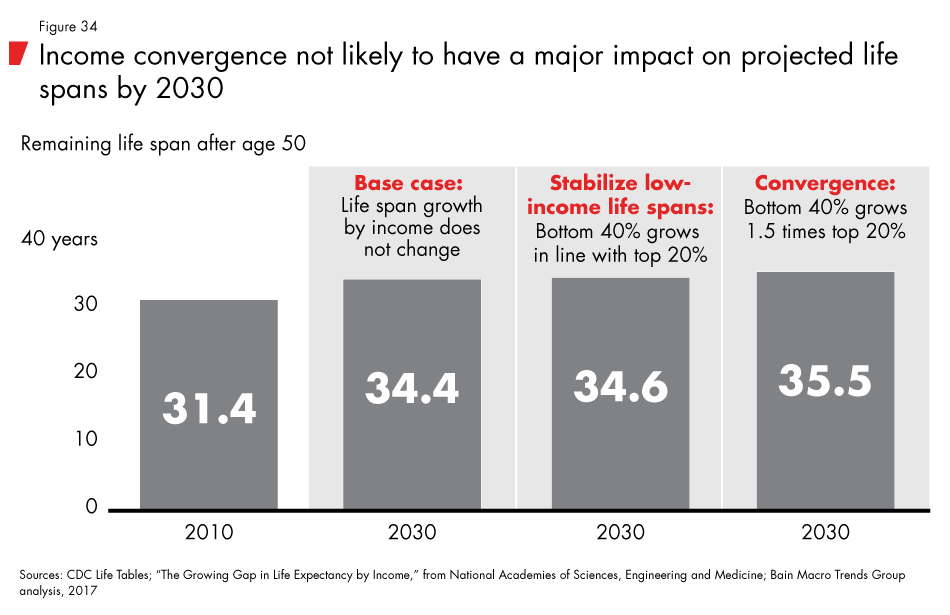
The cost of healthcare treatments that extend healthy life spans and working years (and access to that healthcare) change over time. While some cutting-edge treatments today may be limited to the wealthy, broad access to antibiotics and vaccines in the middle of the last century (among other basic advances) had dramatic effects on early-age mortality. Infant mortality in the US declined 52% between 1930 and 1949 and helped give rise to the surge of baby boomers who continue to shape demographics today. We estimate that these technological advances in medical care resulted in approximately 23 million more baby boomers across the income spectrum being alive in 2012. But delivering broad access to new treatments can take years. And even modeling a rapid rate of convergence of life span improvement for the bottom 40% of the income spectrum to that of the top income bracket, the incremental impact on overall average life span after age 50 nets out to only slightly more than one year by 2030 (see Figure 34).
The trend toward longer, healthier lives is likely to continue to benefit higher-income individuals disproportionately since it extends the span of earning years and time to accumulate assets. While we can only speculate on the magnitude of those gains, ongoing medical advances are likely to continue increasing the life span of higher-income individuals faster than those at the lower end at least through the next decade, which in the short run could increase inequality.
Automation's impact on inequality
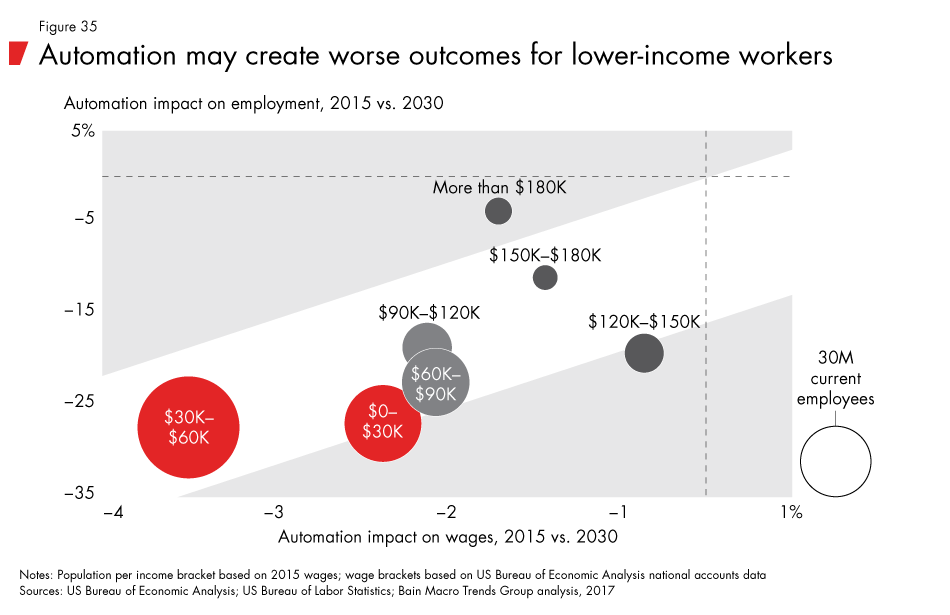
The impact of automation on income is likely to vary. Our base-case scenario, in which automation displaces 20% to 25% of US workers, will hit the lowest end the hardest. Our analysis shows that workers currently making between $30,000 and $60,000 per year are likely to experience the greatest disruption from automation: Up to 30% could be displaced, and many will suffer depressed wage growth. The impact on workers making less than $30,000 a year should be comparable but with slightly lower levels of wage depression. We expect automation to have a lesser impact on those with incomes between $60,000 and $120,000 a year and the least negative impact on those earning more than $120,000 (see Figure 35).
As we discussed in Chapter 2, rapid deployment of automation technologies is likely to exceed the pace at which economies can reabsorb and redeploy the millions of workers who may lose their jobs to automation. This type of structural dislocation often results in long-term unemployment. A study by the US Social Security Administration found that 20 years after losing a job, average earnings still lagged by 27%. Another study by an economist at the Federal Reserve Bank of Boston found that a long period of unemployment reduced earnings by 67% immediately and 32% 10 years later. Even when workers simply changed industries, earnings remained 10% lower. This tendency of displacement and long-term unemployment to erode earnings may cast a shadow over income distributions for years after the economic shock of automation dissipates.
As automation technologies spread, we expect employment and wage growth to be concentrated in jobs that require high social and analytical skills—jobs that are already relatively highly compensated today. Workers in mid- to low-skill roles who rely on physical labor or analytical skills vulnerable to automation are at higher risk of losing their jobs or facing pressure on wages. If recent history is a guide, those who lose their jobs may face lower incomes throughout their career after being reabsorbed into the workforce, and some may choose to drop out entirely.
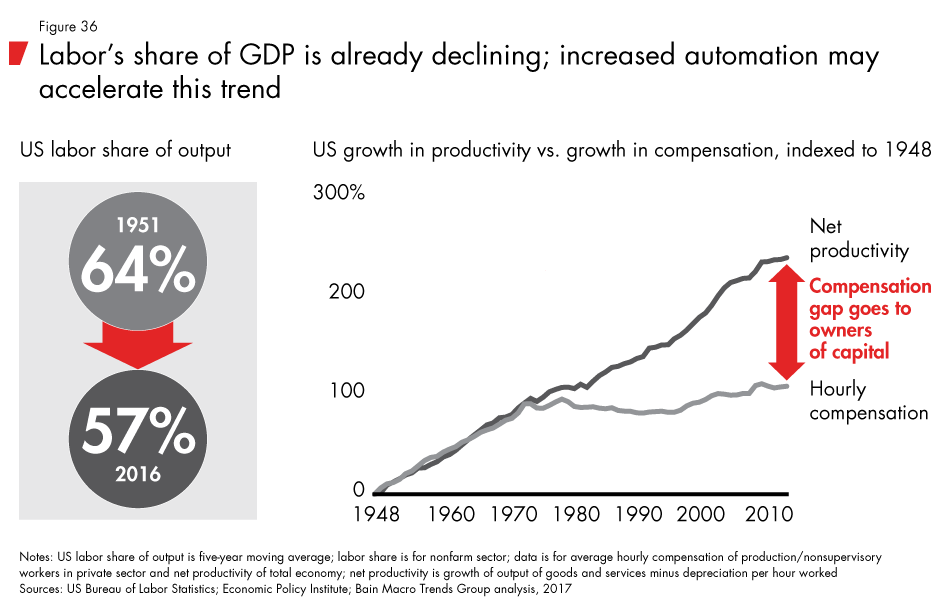
In addition to job loss and wage suppression, automation may also increase income inequality by increasing the share of income going to profits vs. wages. The share of income produced by labor already is declining, and with automation, it likely will fall further (see Figure 36). By 2030, we estimate that operating costs at an industry level could decline by as much as 10% to 15%, depending on the industry's current cost structure (the share of costs that labor represents) and the level of automation expected in the base-case scenario time frame. Under those conditions, increased profitability would largely flow to owners of capital and further reduce the share of national income allocated to labor.
Capital ownership is already highly concentrated. In France, wealth inequality levels have been declining, but the top 10% of wealth holders still own 55% of wealth. In China, where income inequality has significantly increased in recent years, the top 10% own more than 67% of wealth. But the highest levels are seen in the US, where the wealthiest 10% own 73% of wealth, while the share for the next 40%—roughly corresponding to the middle class—has fallen from 36% in 1986 to just more than 27% today. Because capital ownership is tilted toward those already in higher-income brackets and also much more narrowly concentrated than income, this shift toward capital income is likely to contribute to rising income inequality.
Inequality constrains growth
While inequality raises many social and ethical issues, our focus in this piece remains on what likely will happen, not what should happen. The primary macroeconomic consequence of higher inequality is to constrain growth by limiting the growth of effective demand vs. the growth in supply. Despite many technological innovations that will increase the capacity for goods and services, the inability of effective demand to keep pace may ultimately reduce growth.
Effective demand is consumption supported by income. Supply growth may be temporarily sustained by other forms of demand, such as that generated by capital investments or consumption supported by borrowing. But when the investment or credit cycle ends, demand can drop precipitously. We saw this phenomenon during the late 1990s to early 2000s as investments by technology companies followed by a sharp run-up in consumer borrowing in the US sustained a long expansion followed by the worst global recession since the Great Depression.
Income inequality can create a larger pool of savings to finance capital investment booms or consumption from borrowing. However, this growth isn't based on effective demand and actually creates a misleading signal about how sustainable it is. As income shifts toward the top end of the spectrum, that group generally saves more rather than consuming more. Conversely, if income shifts toward the mid to lower end of the spectrum, then effective demand is increased (see Figure 37) because that group continues to consume if given access to more income. So while higher savings can temporarily mask curtailed effective demand, eventually the return on the capital disappoints or the borrowing must (or can't) be repaid, and demand growth stops or reverses.
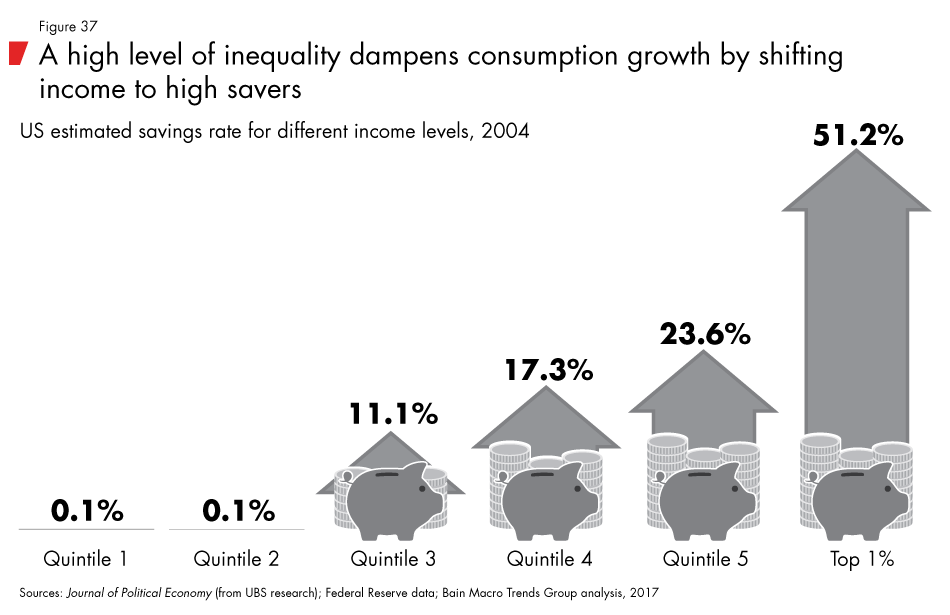
Our base-case scenario forecasts that aging populations will depress supply growth as workers move into retirement, but automation will more than compensate for the shortfall by generating higher productivity. Supply growth potential will therefore accelerate. But as automation displaces millions of workers and inequality grows, we will be faced with demand-constrained growth.
Timing and sequence are critical. As labor becomes more scarce, it constrains supply, triggering inflation. But labor scarcity, in turn, should speed the adoption of automation and trigger an investment boom. Automation investments are likely to generate supply growth just as demographics and investment both spur demand growth, creating a reasonable balance (despite rising inequality). Once the investment boom ends, however, the negative effects of automation will become more visible—namely, high levels of unemployment, wage suppression and slowing demand.
Any change in the order or pace of this sequence, however, could lead to very different outcomes. A slower rollout of automation than our base case could produce stagflation as the supply constraint dominates, capping growth at around 2% in the US, while demand growth due to demographics would be closer to 3%. If automation is delayed by a decade but then spreads quickly in the 2030s, then a decade of supply-constrained growth, including higher wage inflation, would tend to reduce inequality so that it would act as less of a drag on demand growth.
What could derail this scenario?
The cash-flow needs of baby boomer retirees may eventually provoke a pension crisis or a government finance crisis. Countries using the euro are particularly vulnerable to such a scenario since they lack full sovereign monetary freedom. By contrast, in countries with fiscal and monetary levers such as Japan, pension shortfalls are more likely to become a low-grade chronic issue rather than a market-jarring crisis. While the US and China both have high overall levels of national debt (when including households and private corporations), their monetary independence is likely to provide enough breathing room to prevent a full-blown crisis. The US demonstrated the power of monetary policy to alleviate economic dislocation in the immediate wake of the global financial crisis of 2008. A scenario of delayed rollout of automation due to a finance or debt crisis is therefore higher in the eurozone, while it is significantly lower for the US and China.
Another challenge to our base-case scenario is the potential for geopolitical conflicts that disrupt the macroeconomic environment and slow the rollout of automation technologies. Though, eventually, automation may shorten supply chains and relocate production back to home markets, those shifts are nascent, and many multinationals remain dependent on international relationships. Tariffs or other trade barriers have the potential to generate enough disruptions over short periods of time to delay or defer the adoption of automation.
However, geopolitical risk may also have the opposite effect, hastening the spread of automation technologies. Manufacturers that suffer a rapid deterioration in a trade relationship will have a powerful incentive to replace that capacity as quickly as possible, which may speed the adoption of automation.
Social and governmental acceptance is another factor that could affect the speed at which industry invests in automation. Concerns about the impact of automation on employment may trigger a general social backlash. Alternately, specific industries or labor groups may resist change, just as dock workers sought to delay shipping containerization or automated port management. The concern for public safety in the face of risks (perceived or actual) may lead to regulatory or other governmental actions that stop or slow the pace of automation. The US and other countries already restrict the commercial usage of drones out of concern for public safety and the need to reconfigure airspace usage and rights. Autonomous vehicles have also come under increasing scrutiny.
From a safety standpoint, it is important to draw a distinction between more physical-based automation such as autonomous vehicles for long-distance trucking and more information-based automation such as algorithmic fraud detection in insurance. One could imagine autonomous 18-wheeler trucks on freeways suffering glitches that lead to highly visible failures and rapid pullback in deployment. On the other hand, information-based automation is less visible and so less likely to trigger public resistance.
Public reaction is likely to vary substantially from country to country, as with other technologies. For example, the city of London and cities in China deploy video surveillance as security technology. In other countries, including the US, adoption has been relatively slower due to concerns for civil liberties. EU information privacy laws, on the other hand, are currently more extensive than in the US. Labor laws also vary tremendously across national jurisdictions, and they may accelerate or decelerate the adoption of automation technologies. Differences in policies toward automation may be harder to sustain where the good or service can be traded. For example, if London were to permit more generous automation of tradable goods or services than New York, then competitive forces are likely to put greater pressure toward parity. In contrast, if London were to permit coffee shops more generous automation leeway than New York, the differences are more likely to remain localized.
The social and governmental acceptance of automation depends on a variety of factors linked to location, industry and technology. In developing our industry and job analysis, we took a conservative approach to capture more obvious examples in which acceptance was likely to bring down the level of automation potential within the time frame of the analysis. However, we by no means addressed the potential variation for every industry or job in every market.
We acknowledge a material risk that social and governmental resistance delay extensive adoption of automation technologies. It is impossible to handicap that risk as the response across different countries is unlikely to be uniform. However, we believe that our base-case scenario of rapid deployment is more likely.
Chapter 4: Tracing the arc of the turbulent 2020s
The early 2020s are likely to be a time of economic upheaval, the beginning of a major transformation that will play out over several decades. As detailed in previous chapters, the key forces at work are demographic change, the rapid spread of automation technologies and rising inequality. Because these forces are likely to combine in different ways—sometimes reinforcing each other, sometimes offsetting each other—our effort to trace the economic developments throughout the 2020s is a rough sketch. That said, businesses and investors who understand the broad forces at work will be in a better position to adjust to the changes ahead.
We expect the 2020s to be a period of greater macro turbulence and volatility than seen in decades. It is also likely to be a period in which extremes become more extreme. Technological innovations will give rise to new corporate powerhouses, but at the same time, pervasive insecurity may haunt ordinary families and global enterprises alike. In our base-case scenario, paradoxes abound: High unemployment coexists with labor shortages; rapid inflation affects some sectors, and rapid deflation hits others.
To some, this may seem a continuation of the current decade. But the speed and magnitude of changes, spurred by the maturation of a broad set of automation technologies poised to transform the service sector, are likely to be qualitatively different.
Over the past four decades, economies around the world have increasingly struggled with weak demand growth. An economy firing on all cylinders should grow faster, but a persistent lack of demand growth has restrained overall growth. Intermittent bouts of debt-fueled investment and consumption have temporarily boosted demand only to be followed by a crash and a time of readjustment. The best example of this was the global financial crisis and the Great Recession, the impacts of which are only now subsiding in many countries.
Societal aging is bringing an end to plentiful labor growth, but older populations will continue to fuel steady demand. In isolation, this trend should create the potential for relatively balanced demand growth vs. supply growth and a generally more sustainable, if lackluster, economy.
However, the rapid spread of automation and worsening income inequality push in the opposite direction. Automation, in particular, has the potential to significantly increase supply growth, but the job losses and wage pressures it triggers should act to restrain demand growth likely from the middle of the 2020s on.
The magnitude of automation we anticipate would require a significant surge of capital investment, similar to the earlier waves of investment required to build information and communications technology in the mid- to late 1990s and the real estate investment surge seen more recently in the US, Ireland, Spain and China. An even better comparison might be to the period 100 years earlier—the Roaring Twenties—when robust investment in the automotive, radio and petrochemicals industries, along with associated infrastructure spending on roads, electrical grids, telephone lines and the consequent urbanization, created a period of increased labor productivity and increased economic growth.
In this type of investment boom, supply growth creates the demand for more supply—a virtuous cycle of growth. However, as investment saturation sets in, financial capital ebbs, and new machinery and equipment is left without sufficient demand.
Much of the analysis below focuses on the US for several reasons: The US economy is pivotal in setting overall global macroeconomic conditions, income and wealth inequality are especially high, and the US is at or near the forefront of the oncoming automation wave. But other advanced and developing economies are likely to mirror many of the changes we expect in the US economy.
Rising interest rates and the $8 trillion capital investment boom
Based on our demographic projections, automation analysis and macroeconomic modeling of the US economy, we estimate that approximately $8 trillion of incremental capital investment may be required during the 2020s to achieve the level of automation that we project by the end of that decade. This translates to about $5 trillion in net accumulation to the US capital stock, increasing capital per worker to a net figure nearly 1.5 times higher than today. (All figures are expressed in constant dollar terms.)
In this scenario, the economy's full growth potential would average nearly 4% a year between 2015 and 2030. Job losses and other negative labor effects due to automation would reduce growth to 2%, while the additional direct and indirect investment to enable automation would add back 1 percentage point, resulting in average annual growth of about 3% and roughly 60% more economic output in 2030 than in 2015 (see Figure 38).
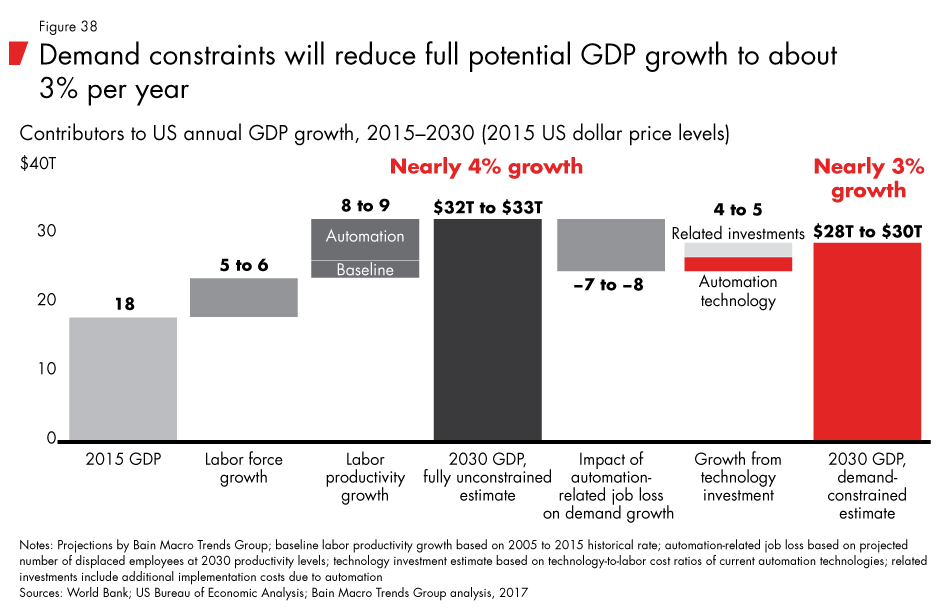
Those overall growth rates are robust compared with recent history. The US economy grew at an average annual rate of 1.8% from 2000 to 2015. The increase in investment would initially offset a little more than half the negative impact of automation on employment, easing the demand constraint on growth and potentially mitigating immediate displacement of millions of workers.
The demand for workers to build the automation tools of the future is already growing, and not only in fields such as engineering and software development. For example, the customer service agents at online test-prep company Magoosh use software from DigitalGenius, which passively monitors and learns from customer–agent interactions. In effect, their work is being harnessed to teach machine learning algorithms to do their jobs. Other new jobs focus on simple tasks such as tagging or categorizing images that eventually go into massive photo databases that are used to train automated image recognition. This process of teaching machines is a critical part of the investment to deploy automation, particularly in the service sector, where the number of distinctive jobs is larger than in the industrial sector.
The convergence of demographics, automation and inequality may also lead to the first major turnaround in global interest rates after 30 years of steady declines and 10 years at or near zero. Decades of sluggish, demand-constrained growth worldwide have put downward pressure on prices and nominal interest rates. The initial surge of automation investment and productivity growth will reverse the trend and may lead to a rapid upward readjustment of rates. Historical analogies show that movement away from depressed interest rate environments can happen quickly, as outlined in a recent working paper published by the Bank of England. In looking at an 800-year history, its analysis found upward adjustments after long periods of real rate stagnation averaged 315 basis points within two years of the trough of the cycle.
Aftermath of the boom
As the investment surge comes to an end (likely around the end of the next decade), a newly automated economy will likely slip back into demand-constrained conditions. Many of the companies that invested heavily in automation may be saddled with assets that are out of step with the level of demand needed to utilize them fully. At the same time, millions of consumers who have lost their jobs to automation are likely to curb their spending. Unemployment and wage pressures may exceed levels following the Great Recession in 2009. Income inequality, having grown steadily throughout the 2020s, could approach or exceed historical peaks. Interest rates will again be pushed toward the floor.
Resolving protracted demand-constrained growth presents a steep challenge. The experience of Japan over its nearly three lost decades since the early 1990s demonstrates one potential path, which is deflation, write-offs and stagnation over a long period to rebalance the economy. Another potential path is using government spending to offset sagging demand. This second option may be particularly challenging and costly in the upcoming cycle due to the high levels of income inequality following the end of the automation boom, especially with displaced workers and depressed wage growth concentrated toward the lower end of the income scale, in which consumption rates are highest.
Demographic aging trends could help restore the balance between supply growth and demand growth. But a higher overall proportion of retirees may create a secondary financial problem due to the share of income they derive from financial assets as opposed to labor. In principle, retirees could trigger a virtuous cycle by spending accumulated assets to buy goods and services. But high levels of wealth inequality mean that circle would hold true for only a small portion of retirees. According to recent data from Vanguard, as of 2017, fewer than half of Americans age 55 to 64 have at least $70,000 in their retirement accounts. Another survey in 2016 by GoBankingRates.com found only 26% of those age 55 to 65 had retirement savings greater than $200,000, while 56% had less than $50,000. Most retirees likely will require government transfers if they are to sustain their consumption. Governments, in turn, will require a pool of income to tax in order to fund the transfers.
Resolving the emerging demand constraint in the 2030s and rebalancing economies will require a change in the pattern of income distribution. The challenge will be similar to what China faces today: After more than a decade of rapid investment, the government now needs to rebalance income distribution and put more money in the hands of consumers. This change is not easy and will be even harder in the 2030s, when most of the largest economies in the world are simultaneously dealing with the same problem.
Flexibility vs. security
Automation technologies are likely to play out differently country by country, based on national economic models and labor market conditions. Advanced economies such as the US and the UK, with large, highly educated working-age populations, are more likely to adapt faster. They may be quick to invest in new industrial sectors and occupations and develop new tools to accelerate productivity growth. Jobless workers may become entrepreneurs. But the trade-off is that this flexibility, including a weaker social safety net, may increase income and wealth inequality and ultimately undercut growth if demand constraints are not addressed.
In other Western European countries such as the Nordic countries, Germany and France, as well as in Japan, a stronger social safety net and relatively more rigid labor markets could result in slower investment in automation and greater immediate focus on addressing demographic challenges. The main challenge for these countries may be addressing their supply constraints.
There is no best approach for managing through economic dislocations of the magnitude we foresee, but we believe that countries blending elements from these two models may enjoy more options for navigating the disruptive decades ahead.
Emerging markets hoping to copy the export-led growth model of Japan, the Asian Tigers (South Korea, Taiwan, Singapore and Hong Kong) and China are likely to face shrinking global demand. As automation spreads, large pools of undifferentiated labor should become less valuable as labor becomes a smaller proportion of overall costs. At the same time, new technologies are poised to make smaller-scale manufacturing more cost efficient, allowing advanced economies to rely more on domestic production.
Among the larger developing economies, China faces some of the most challenging demographics, accentuated by its one-child policy, but it now also has vast resources to deal with an aging society and the effects of automation. It is likely to be a major user of automation technologies and may also become a major producer of them. Brazil faces one of the steeper decelerations in labor force growth due to its demographic position, which is almost as bad as that of the US. India enjoys a relatively favorable position with a more youthful population and will not hit the demographic transition that the rest of the world is facing until about 2050.
Though the tumultuous transition creates serious challenges for businesses and investors, they are not unprecedented. Advanced economies achieved their present level of material welfare and development by working through major dislocations.
One lesson history teaches is that severe economic disruption can prompt countries to rethink the role of government in the marketplace. Most developed economies have some form of progressive income taxation originating from the middle of the last century. Nearly all developed economies and many developing economies also rely on the government to play a significant role in the financing and delivery of services such as healthcare and education. Few governments played that role at the start of the last century. We suspect that history may repeat itself in the next decade.
Chapter 5: Will governments assume a greater role in the market?
History yields many examples of governments intervening to combat stagnant or depressed economies, most recently in the aftermath of the global financial crisis. Governments are unique actors, sitting outside the marketplace and setting the rules while also able to act within markets. Individual governments will come from different starting points in facing the economic challenges of the coming decades. But as the custodians of market governance and social policy, many governments may reset their role in the marketplace when faced with economic and social turmoil. If history is a guide, governments will not only discern a need to intervene, their societies will demand it.
Anticipating a larger role for government 15 years from now may seem highly speculative. Since the early 1980s, governments around the world have steadily reduced their role in the marketplace. The trend has been toward freer markets, less regulation and lower taxation in both developed and developing markets such as China and India. OECD top corporate tax rates have dropped from an average of 47% to about 25% over the past 30 years.
Most current business leaders rose through the ranks of management and developed their professional instincts during this period of market ascendency. The era of professional management, which peaked in the 1960s, gave way to the shareholder primacy era from the 1970s onwards, which greatly elevated the role and prestige of markets as efficient and self-regulating coordinators of value creation (see the Bain Brief "The Firm of the Future").
The collision of demographics, automation and inequality will shape a new era. Populations suffering severe economic dislocation could view jarring levels of income and wealth inequality as a form of social failure—a failure to provide the vast majority of the population with the chance to earn a decent living despite the nation's technological and economic wherewithal. Today's level of inequality already has prompted growing public concern and debate. It seems reasonable to expect that at significantly higher levels, popular criticism would intensify and increase pressure for social policies to address it.
The generational turnover from baby boomers to millennials may add to the pressure on governments to act. Research from the World Values Survey indicates that support for authoritarian alternatives to democracies is notably higher for millennials in the US and Western Europe than for other recently surveyed generations, even when adjusting for comparable ages at the time of survey. In the US, one in six agree it would be better for the army to rule vs. just one in sixteen in 1995. Similar upward trends are seen in Germany, Sweden and the UK. The sharpest rise has come from younger, more affluent millennials. In our context, this suggests that with millennials increasingly at the helm, societies may be more willing to embrace an increased role of government in the marketplace.
History shows that states can move quickly in response to economic crises. On the eve of the Great Depression, the US government's share of GDP was just less than 5%. Only 15 years later, it had more than tripled and has remained between 15% and 20% ever since. In 2007, the Federal Reserve's balance sheet was just under $900 billion. Ten years later, following the global financial crisis, it is $4.5 trillion.
A more interventionist government would affect the business environment in multiple ways. Stimulating demand could reinvigorate growth. From 1930 to 1960, the governments of advanced economies intervened to reverse the economic decline and inequality brought about by the Great Depression and World War II. Major capital projects supported the business environment, including the US interstate highway system and space program, coordinated industrial policy (especially in Japan), and the reconstruction of society and support for worker education (particularly in West Germany and Japan). By the 1970s and 1980s, however, the social consensus in much of Western Europe and the US turned critical of interventionist governments, and a wave of deregulation and lower taxes followed. Even state-centric China moved ahead with reforms initiated by Deng Xiaoping to lessen government's role in the marketplace. Businesses have managed to thrive and prosper in all of these eras.
What might a reset government role in the marketplace look like? We highlight several plausible changes, noting that these are neither predictions nor prescriptions and that individual countries will respond differently.
Income and wealth transfers
Governments may rely on income and wealth transfers to directly reduce income inequality. Many Western European countries, especially the Nordic countries, use their tax and transfer systems to reduce posttax inequalities far more explicitly than the US or China. The relative progressivity of the US income tax system has varied over time considerably, with top rates since World War II as high as 92% and around 70% until the 1980s.
If wealth and income inequality become increasingly acute, some nations may use wealth or asset taxation as a tool for redistribution. The relative share of income apportioned to capital vs. labor has increased, particularly in recent decades across the G7 countries, from a trough in the 1970s. Our base-case scenario anticipates that increased automation would extend this trend and raise the focus on the role of capital ownership as a cause of rising inequality that constrains demand growth.
Governments may also expand entitlement programs, particularly in healthcare and family benefit spending. Already, as birth rates have fallen, many countries have attempted to ease burdens on families, particularly working mothers (see the sidebar "Birth rates are higher among top earners"). Germany, for example, provides a parental allowance (Elterngeld) to parents who take a leave from work to care for their own children, and France provides allowances and state-run childcare to families with three or more children. Some countries may expand unemployment safety nets designed for short-term transitional unemployment to address the long-term unemployment caused by automation or even provide universal basic income.
Labor-income interventions
Governments could provide incentives to employers to retain human workers by lowering the total cost of an employee—for example, by reducing or eliminating employer-paid payroll taxes or even directly subsidizing employment. Alternatively, governments may consider imposing a robot tax on companies that invest in automation and displace workers.
To address labor market imbalances, governments could invest in retraining programs. Most countries provide free education through high school. Some may expand this basic framework to make retraining a form of gainful employment. Along these same lines, governments may subsidize apprenticeship and on-the-job training programs.
Changing the definition of full-time employment could help reemploy jobless workers. While today the definition of full-time work ranges from 35 to 40 hours in Europe, under the Affordable Care Act, it is already only 30 hours in the US. The number of hours actually worked has not been static. For example, in 1919, an average US manufacturing worker worked 50 hours per week. This number has dropped steadily over the past 100 years, and today, US workers clock an average 34 hours a week. Reducing that number to 25 to 27 hours, matching the 26 hours per week worked on average in Germany, would effectively fully offset unemployment from higher productivity due to increased automation, though incomes might not fully keep pace.
Some countries may consider limiting immigration, but that action would also make it harder to address labor market shortages for highly skilled workers. Alternately, countries might compete fiercely across borders for highly skilled talent even as they shut the main doors of immigration to lower-skilled immigrants. They may recalibrate immigration policies to emphasize particular skills similar to the Canadian model.
Regulatory policy authority
Governments could expand monetary policy further, using it to create negative real interest rates as a form of social policy targeted directly toward households (rather than businesses), providing zero to negative interest rates for consumers in categories such as automobiles, student loans and lower mortgage rates.
They could also wield business and antitrust regulation either to exert more direct control over economic means and outcomes or to benefit new entrants over incumbents. Each country's approach and philosophy to regulation varies, but many may use regulation to slow the adoption of automation technology and improve economic conditions for mid- to low-income households, especially during the transition toward a more highly automated workplace.
Governments may use global trade and open market agreements to protect scarce domestic demand and, in some cases, to reduce the spillover effects from other countries. Changes in the geopolitical environment toward what we call post-globalization may facilitate the general movement away from the high volume of traded goods (see Figure 39).
All of these potential forms of intervention require resources, but they will have to compete with other priorities. By 2030, state and local governments in the US and other regional and national entities globally will be grappling with pension obligations that outstrip pension resources. The underfunding of the US's Social Security and Medicare programs is well known, but the government should face its first real cash-flow dilemma in the 2020s as the baby boomer generation retires and the US population in these programs rises by 50% in 2030 vs. 2015 levels (see Figure 40). The step change in life expectancy that started with the baby boomers means about double the number of boomers drawing on social insurance and late-age medical plans than expected when these plans were devised. Absent other changes, tax increases required to offset changing demographics and inequality could reach 15% to 25% per US worker by 2030 (see Figure 41).
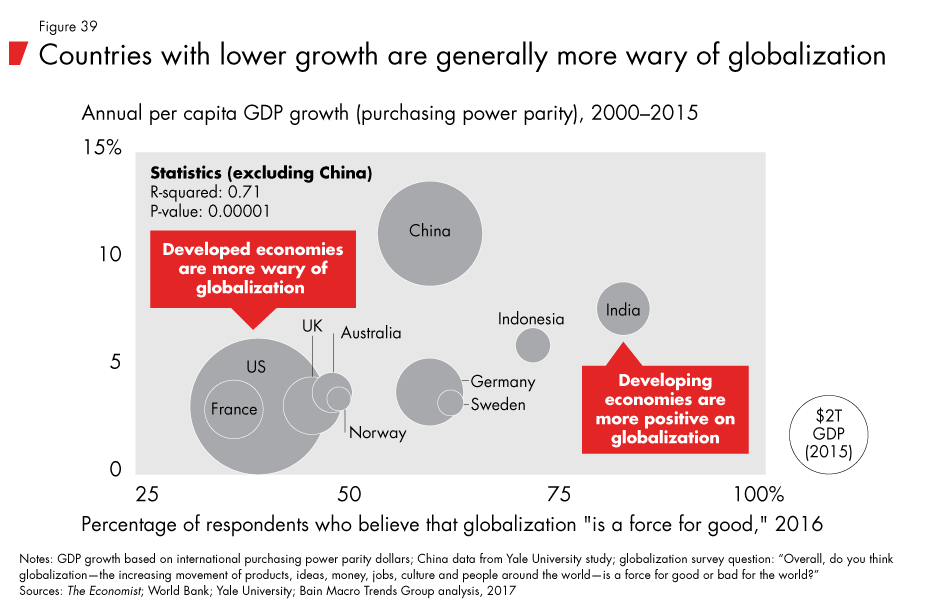
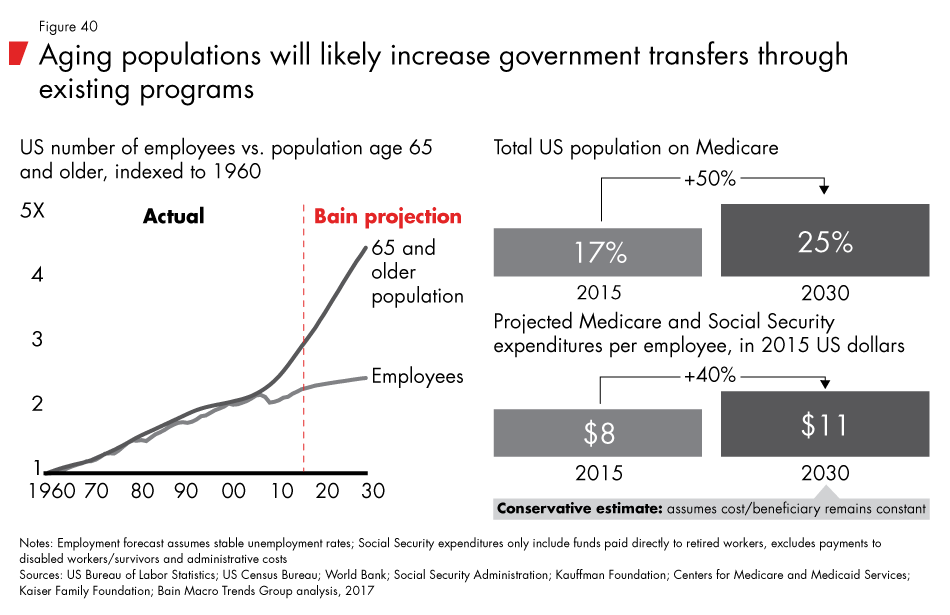
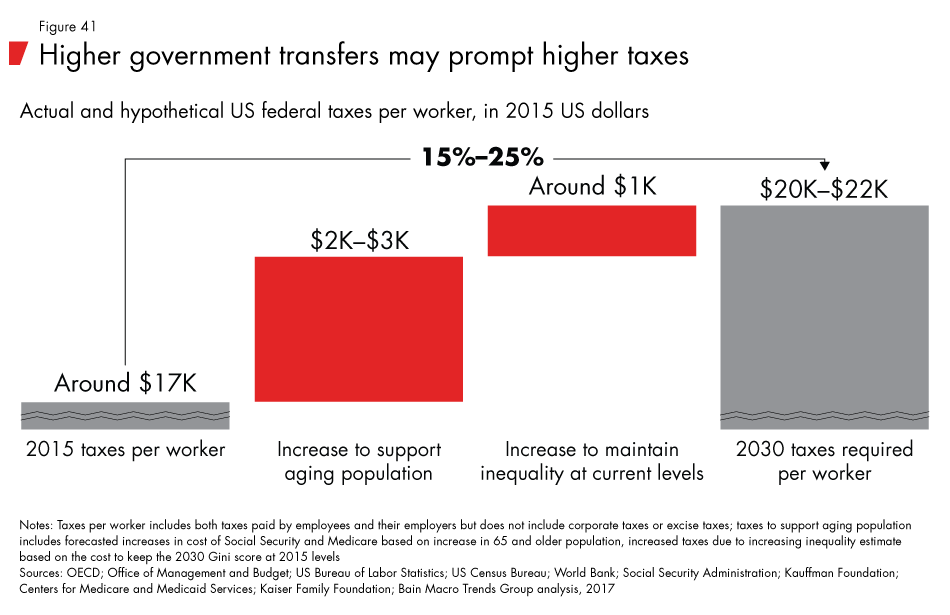
In most European countries, the cost of unfunded pension liabilities is more than twice as large as the published national debt. In China, the shrinking workforce is already forcing choices between critical items of expenditures; what Mark Haas, a Duquesne University political scientist, called "guns and canes." Even today, after wages, increased pension costs are the biggest cause of increased Chinese military spending. Governments facing serious economic and social challenges and shrinking coffers may see no alternative to stepping into the breach and expanding the role of the government in the marketplace.
In the final chapter of this report, we outline the implications for businesses and investors of this collision of demographics, automation and inequality, and the potential return to a more interventionist state.
Chapter 6: Searching for implications
How can companies begin to anticipate disruptive change a decade from now? Many already confront talent shortages and rapidly evolving automation, along with pressure to make the right investments now or risk being left behind. On the ground, it seems harder than ever to come up with clear answers. This report focuses on the economic developments that, in our judgment, are the most likely to occur. No question, the broad scenario we have laid out in this report is one possible future among many. At the end of this chapter, we explore some of the alternative scenarios.
Any meaningful scenario, however, must reflect large and fundamental shifts ahead in the global macro environment. Our base-case scenario also assumes a soft start, a boom, a bust and then a second period of readjustment, similar to other periods of substantial change, which do not happen smoothly or in a straight line in spite of ever-rising technological sophistication.
Whether or not our view ultimately proves the correct one, business leaders and investors who assume that the macroeconomic climate in the coming decades will be little changed do so at their own peril. The forces of demographics, automation and income inequality already are in motion.
Below are the practical business implications that follow from our base-case scenario, including options and no-regrets moves that companies can start discussing and implementing now.
Be wary of following market momentum—volatility will increase
Businesses and investors are likely to face an unstable macro climate in the coming decades. Growth rates, inflation, interest rates and unemployment may swing up or down rapidly and unexpectedly. Betting on any given macro trend in a turbulent macro environment without hedging would carry much bigger risk. Think of the many banks and homebuilders that chased soaring housing demand and invested right up until it collapsed and went down with the market in the 2007–2009 US recession. While such risks have always existed, our analysis shows the forces of demographics and automation should increase their magnitude and scope.
How can leadership teams prepare for a more turbulent business climate? By making resilience a higher strategic priority than it has been in recent years. Long periods of stability tend to reward focus on shorter management horizons over long-term investments in growth and innovation, especially when combined with pressure from activist investors. But increasing financial efficiency at the expense of future competitiveness is dangerous when companies face this much change. Resilient businesses invest in their ability to quickly recover from disruptions and regain momentum. Leadership teams can start by posing a simple question: Are initiatives to improve efficiency making the company more or less resilient? Any action that improves efficiency while also increasing resilience is a no-regrets move. Examples include changes that lead to faster decision making, greater customer intimacy and a more engaged workforce.
The first step in improving resilience is assessing the macroeconomic exposures implicit in a company's (or fund's) business model. Those exposures will vary substantially from business to business. Consumer businesses, for example, should stay alert to any force that hits some customer segments harder than others, such as unemployment, which often affects some segments while leaving others untouched, or falling asset prices, which have a larger impact on the affluent.
Business-to-business companies, by contrast, are vulnerable to pressures on downstream demand. Capital-intensive businesses can develop dynamic models showing how their cost of capital and access to capital will shift over time, while businesses with many physical assets can track forces affecting financial and operational utilization. Finally, businesses highly dependent on intellectual property (IP) and relationship assets, such as professional services firms, can carefully watch the forces that may accelerate the pace of IP and relationship depreciation.
Most companies face only a half dozen or so critical first-level exposures to macroeconomic forces. Highly complex enterprises with multiple lines of business can have more, however, as well as overlapping and offsetting exposures. Mapping out the grid of exposures is a time-consuming but necessary first step toward developing a consolidated view. Investors can begin by seeking this information from the management teams of their holdings. The challenge of developing a consolidated view of macro exposures increases exponentially as holdings and sectoral or geographical exposures broaden.
With a consolidated assessment in hand, leadership teams can address exposures based on their appetite for risk. They may retain exposures as an acceptable business risk, reduce volatility by hedging, buy options that bet on potential inflections in the macro environment or double down on exposures. Financial instruments offer another set of potential tools, particularly for investors. Those with portfolios of holdings can use them to adjust their exposures more easily. For business management teams, the current availability of financial instruments for managing macro risks is more limited.
However, adjustments to business strategy can markedly improve macro exposures to align with management's macro thesis and risk appetite. For example, consumer businesses that focus on value-oriented consumers may enjoy fair tailwinds if the boom in automation investments fuels overall growth. But a second engine of growth aimed at roughly the top 20% of consumers may become a smart hedge when the automation boom ends, eroding the value-oriented segment.
Increased volatility also raises the value of having multiple options. The right to fix the value of an asset, liability, cash flow or some other part of a business can act as a vital anchor that provides stability during tumultuous times. For businesses and investors in relatively stronger positions, the ability to absorb volatility becomes an increasingly valuable hidden asset.
Though not for everyone, some leadership teams may gain a strategic advantage by doubling down early on an upcoming macro tailwind before others spot the trend. Institutional investors and large asset managers have increasingly turned to macro thematic investing as sources of differentiation. Some large, diversified companies also focus their growth strategies using a macrothematic lens. A high-conviction macro thesis can create an opportunity to pull ahead of competitors when it is done well—aligned with overall business strategy, tailored to strengths, directed away from overcrowded first-order implications, and pushed to the second- and third-order implications where untapped value exists.
The argument for expanding options and hedges does not imply that the importance of one's core business will be any less critical in the coming decades. Strength in the core will become even more important. But increased volatility means core businesses may shift more frequently. Companies that increase their resilience will have a better chance of surviving unexpected change.
Middle-class markets are likely to erode
Our ongoing analysis of US households shows the core of the middle class is now located between the 50th and 80th percentiles of household income—what we term aspirational consumers. Rising inequality is likely over time to shrink the middle class, favoring a shift from a three-tier household model (upper, middle and lower income) to a primarily two-tier structure—the affluent would account for roughly the top 20%, and the remaining 80% would earn a lower average real income level than the current middle class. The erosion of the aspirational consumer group may be less extreme in markets where income distribution is more balanced.
Consumer goods and services businesses will need to carefully stake out their ground across the socioeconomic spectrum because the landscape is likely to change midway through the coming decade as investments in auto-mation begin to decline. The timing of the changes and their impact on customer tiers will vary significantly by market, creating complexity for multinationals.
Focusing on the affluent segment is one broad strategic option as this group will gain the most ground early on as automation fuels growth. This group may also face increasingly heavy taxation, especially from the end of the 2020s into the 2030s. The risk of overcommitting to the affluent segment will increase over time for higher-priced items such as housing and autos.
Our base-case scenario shows that competition in the affluent tier will grow more intense. Today, the business model of many retail companies in advanced economies focuses on premium goods and services—a model based on high margins, a high degree of customization, a special experience and high intimacy. But as the middle tier shrinks, these offerings may no longer be affordable to many consumers, and companies may shift their focus to the affluent tier. On the other hand, companies that adapt their business models to the lower-income tier of the population may find new opportunities and a less crowded competitive space as long as they can use automation and targeting to lower their cost structures. As important as automation will be for businesses selling across the socioeconomic spectrum, it will become even more crucial for those focusing on the nonaffluent 80% in which outright price deflation is likely to become most intense.
Customers struggling to afford goods aimed at the affluent may be increasingly receptive to lower-priced alternatives. This implies both the continued expansion of private-label goods and rising pressure on brand premiums for those that fail to clearly pick one market or the other, upper or lower. Cost models developed in emerging markets such as China and India will provide important lessons for companies competing for the broad lower tier. Emerging players with international ambitions may also find growing opportunities to sell "good enough" products and services to this tier. As automation undermines export-led growth strategies based on labor costs, developing economy champions may use this strategy to access advanced economy markets.
The erosion of the middle class will have major ramifications for those selling big-ticket items, especially housing and autos. Consumers may tap their credit as they strive to maintain their standard of living. A surge in credit purchases would make it increasingly difficult to judge where the affluent tier begins. One particular danger will be overestimating the size of the affluent market as an increasingly volatile interest rate environment will likely curtail credit availability and sustainability, eroding the purchasing power of the nonaffluent (see the section below on interest rates).
Many consumer businesses have not had to grapple with major changes in the socioeconomic status of their customer base, especially when that base has been largely middle class. Leadership teams may see their middle-class customer base split in half, creating the opportunity for more tightly focused offerings on the upper and lower ends of the base.
The pressure to automate will differ at the upper and lower ends of the market. Premium goods manufacturers will tap automation technologies to offer customers a better experience, higher customer intimacy and greater personalization. In short, companies will use technology to make their products even more premium. Companies producing goods for the lower tier of the market will use automation to bring down costs and align their offerings with the reduced purchasing power of mid- and lower-income consumers. At this end of the spectrum, consumers are likely to be more willing to accept automation trade-offs such as self-ordering kiosks at fast food restaurants vs. at a higher-priced, full-service dining experience or machine-based financial advisory services vs. a human financial adviser.
Expect an interest rate speed bump
Our base-case scenario forecasts a higher cost of capital starting in the first half of the 2020s that peaks before interest rates drop back to historic lows as automation investment peaks and ebbs. We have discussed the impact of demand-constrained growth and demographics on interest rates in a previous report (see the Bain report A World Awash in Money). The demand for capital to support automation in the next decade, combined with shifting demographics, could temporarily tip some economies into supply-constrained growth and cause a rise in interest rates. The magnitude and timing of interest rate movements may differ significantly by market. Local exchange rate management policies also will influence local interest rate volatility.
A recent working paper published by the Bank of England analyzes how quickly low interest rates can rise. Based on an analysis of 800 years of interest rate movements, its analysis found upward adjustments after long periods of real rate stagnation averaged more than 315 basis points within two years of the trough of the cycle. The most recent trough in 1948 was followed by a rise of more than 200 basis points within two years. Business leaders and investors thinking of taking a wait-and-see approach may find there will be very little time to react.
For capital-intensive businesses, a swing toward a higher interest rate environment will make it increasingly important to manage the cost of funding. Although our base case does not anticipate the magnitude of the interest rate swing that occurred during the 1970s to 1980s, for example, companies likely will need to set funding horizons longer at the earlier part of the automation investment cycle and shorter toward its end to avoid locking in just before the peak of the cycle. The inverse is true for any assets sensitive to interest rates.
Businesses with products that are heavily reliant on financing, including large equipment and aerospace, need to consider how rising interest rates could affect their customers. For example, a rising rate environment will make a cheaper, less reliable piece of equipment more attractive than a more expensive but more reliable piece of equipment. In general, companies will become increasingly sensitive to upfront costs when considering investment decisions for most capital equipment—except when other factors intercede, such as the need to install automation.
For asset managers, the balance sheet implication is exactly reversed, shifting to shorter duration up front and longer duration toward the end. Asset managers with extremely long duration liabilities, such as life insurers and pension funds, will benefit from the opportunity to reshuffle exposures and prepare for the long drawdown of baby boomer assets.
Automation could fuel a 10- to 15-year boom followed by a bust
In our base-case scenario, we expect investment in new automation technologies starting in the next decade to follow the same pattern as all major capital investment waves. Typically, investment builds momentum gradually. Eventually, it peaks and then overshoots demand, leading to a cyclical bust. We expect the magnitude of investment in the coming decade to be greater in scale than in previous periods because it will affect a wider array of industries and sectors (not just manufacturing), and it will spread through advanced economies as well as parts of the developing world at the same time.
For businesses and investors, the early part of this investment wave will create four major opportunities.
First, core platform providers will provide the essential enabling technologies for the next phase of automation. These are the main building blocks for more general automation technologies. We divide this group into the physical building blocks, such as high-dexterity robotic hands, and the analytical or control building blocks, such as machine learning systems and the application program interfaces that go with them.
Second, systems integrators will combine the various building blocks to create functional systems—for instance, a drone that can drop off packages—by assembling various sophisticated hardware and software components in one integrated package.
The third opportunity is for businesses that figure out how to take various automated systems and adapt them to discrete uses, such as delivering a package to a customer's house. The bulk of innovation will likely be in augmenting or replacing existing products or services with automation. Breakthrough innovation focused on new uses rather than replacement functions could grow over time and eventually become the main focus of automated systems as overall capability continues to advance.
A fourth and easy-to-overlook category is the collateral infrastructure that enables new automation systems, which, by our accounting, may be nearly half the total investment that the next phase of automation will require. For example, a highly automated restaurant kitchen will generally require extensive remodeling to make the best use of automated food preparation systems. The new setup may require less floor space devoted to cooking and preparation, but it will need new electrical and track systems for robots. Systems will vary widely. Some will make use of vertical space—for instance, robotic prep chefs stacked vertically—but will also require modifications to appliances and storage.
In some cases, the investment in this fourth category could come from the reclamation and repurposing of existing infrastructure. Urban planners already envision repurposing vast tracts of parking lot space in prime locations once autonomous vehicles become widespread. Instead of parking close to the user's final destination, for example, self-driving cars could drop off their passengers and drive themselves away to park on the outskirts of a city center, returning when needed—something similar to a built-in valet. Office spaces could be reconfigured from large tracts of cubicle farms—ideal for doing individualized repetitive work—to more collaborative and creative space for doing work that is far beyond the purview of automation, at least for the next 20 years.
Only two of the four broad opportunities linked to the next phase of automation are technology based. For investors, the thematic opportunities from greater automation will include sectors such as energy, healthcare, aerospace, retail and infrastructure. Within each of those areas, businesses at the forefront will be experimenting with how to make use of automation directly or how to support those who are developing new uses. The "Amazon effect" in retail is usually ascribed to the disruptive innovations flowing from one specific company, but more generally, it is a soft preview of how a more highly automated company can become a powerful disruptive force in a wide variety of industries.
Investors involved in real estate will need to be especially attentive to the pace of disruption due to automation, which already has contributed to shifting and declining demand for retail space, especially in places such as the US, Canada and the UK. Automation also is likely to lead to a drop in demand for office space, especially when it is tied to largely back-office functions that are more highly susceptible to automation but also to customer-facing ones such as contact centers. On the other hand, it is likely to further fuel the need for warehouse and logistics space, as well as increasing demand for small flex space for manufacturing using highly automated factories.
We expect rising investment in physical infrastructure, particularly in the electrical grid and telecommunications. Retail businesses will demand more electricity as automation enables more of them to remain open 24 hours and meet customers' growing demand for always-on retail service. Highly automated businesses will also require improved service-level agreements and reliability guarantees similar to today's data centers. Utilities will be able to add new value-added services to a staid service mix. Automation will contribute to the declining cost of distance, triggering additional investment to deliver highly reliable power and telecommunications to lower-density developments along the furthest exurban edges of metropolitan reaches (see the Bain Brief "Spatial Economics: The Declining Cost of Distance").
Road planners and those involved in the construction of roads and other transport infrastructure will face two separate but related disruptions. As robots replace humans by the millions, a shrinking workforce could create a temporary, multiyear lull in demand for commuter transit projects. Longer term, the increasing use of autonomous assistance in transportation, including for long-haul trucking, will enable higher transit density across longer distances without congestion, which may reduce overall lane usage.
Highly skilled, high-income labor will grow increasingly scarce
Our base-case scenario forecasts an acute shortage of highly skilled, high-income workers in the 2020s as investment in automation technologies takes off. Over time, workers will acquire new skills and migrate toward the jobs in demand. However, shifts of this nature take a considerable amount of time. Consider the highest-skilled and highest-paying jobs today, such as physicians, data architects, strategy managers, and research and development managers. These professions typically require at least four to eight years of tertiary education. To develop the skills and experience necessary for a midlevel or top position, graduates will need 10 years of work experience. Even assuming that those making the upward migration from midskilled to highly skilled roles had all the necessary education and started working toward that goal in the early 2020s, they would not be eligible to fill highly skilled positions until nearly the start of the 2030s. More likely, the reskilling and retraining transition will require several decades, making the scarcity of highly skilled workers a long-term challenge for employers.
As competition grows for scarce talent, leading companies will invest more to attract, grow and retain scarcer high-end talent and ensure that their workforce is as productive as possible. To increase their allure, employers may enhance existing incentives with monetary benefits, culture and flexible work arrangements. Businesses that have not already done so may need to offer millennials a higher sense of purpose in their work—a sense of mission that moves beyond delivering maximum value to shareholders (see the Bain Brief "The Firm of the Future").
Baby boomers will, however, remain an important pool of talent through 2030, when the youngest cohort of that generation will only be 66. Companies that seek to retain highly skilled workers from the tail end of the boomer generation may need to adopt more flexible work arrangements, including shorter hours.
In fact, as competition for talent increases, standard employment offers may disappear. The labor force of the 2020s and beyond will include three generations, and companies that offer an identical package to all three would be vulnerable to poaching from employers willing to make more focused offers. To secure top talent, employers are likely to offer different segments of the labor force a custom blend of compensation, benefits and hours.
For businesses and investors, labor scarcity at the high end and labor abundance among mid- to low-skilled workers could create an opportunity to support the migration of workers toward new higher-skilled roles. Such efforts would likely receive support not only from talent-starved private employers but also from governmental entities looking for solutions to rising unemployment, stagnating wages and growing income inequality.
One alternative is for-profit educational systems and corporate training programs. Another is new forms of professional certification similar to the Microsoft Certified Solutions Expert or Automotive Service Excellence programs for computer technicians and automotive technicians, respectively. By establishing objective and marketable credentials for the wide variety of service sector roles, these programs can improve the focus of training and increase labor market flexibility. For example, given the large percentage of the workforce employed in food service and retail, a certification program for a "master customer experience specialist" would create clear skill and performance measures to help employers screen candidates and allow certified workers to command a premium.
Baby boomer spending growth will peak in the 2020s before tapering off
Baby boomer spending in retirement years will reach its peak in the coming decade before beginning to taper off in the 2030s. While the actual peak of baby boomer spending has already passed—spending per household peaks when the head of household is in his or her mid-40s—the long transitional period of preretirement also marks a substantial shift in spending patterns.
For example, peak homeownership rates are 10 years later than they were in 1982. Homeownership now peaks in the preretirement years (ages 55–74). In the US between 1984 and 2015, the growth in housing expenditures for preretirees was more than double that of those in the core productive and reproductive stage of life (ages 30–54).
For homebuilders and businesses providing goods and services for the home, baby boomers will be a large consumer pool for years to come. Expenditures per household will also be higher among boomers vs. previous generations at the same age, thanks to the higher incomes of affluent boomers. Just as with many of the other trends, businesses will have to carefully assess the changing demographics and income patterns. Only about the top 20% of older households are likely to have enough savings to support a traditional retirement, while the bottom 40% have negligible retirement savings and may see their income and workforce participation decline due to health reasons.
Wealthier and older baby boomers will likely be willing to spend on an increasing array of convenience and support services that enable them to stay in their homes as they age. In some cases, this may include relocating to active adult lifestyle communities, where stores, restaurants and personal services are available within walking distance from owner-occupied single-family homes or condos and townhouses. But for the many who will choose to remain in their existing homes, there is likely to be an ample market for retrofitting for safety and convenience—everything from in-home elevators and walk-in tubs to home health–monitoring devices with reminders to take medications.
Financial services that help millions of less well-off baby boomers cope with limited resources may grow, although the margins will be low. Two financial products that will likely please aging boomers are reverse mortgages that allow homeowners to extract equity from their homes and repay out of the eventual sale proceeds of the home and lump-sum annuities that transfer longevity risk away from the individual. Online self-service delivery models may become increasingly viable for the mass market segment since this generation is more comfortable with technology.
Boomers lacking sufficient financial savings for retirement may spur increasing demand for multigenerational homes. There has been some uptick in demand for homes with mother-in-law suites, but it is likely to grow rapidly as the majority of baby boomers start to confront the financial realities of retirement.
Aging baby boomers also will create a sharp spike in demand for healthcare goods and services in the coming decade. Our analysis shows that demand for healthcare in the US is likely to approximately double by 2025 vs. 2015 levels based on demographics alone. Other advanced economies, including Western Europe and Japan, will see comparable increases. The relative growth in healthcare spending in China will be even greater given the general investment needed to improve the level of care.
However, many countries do not have the resources to meet the rising demand for increased spending in healthcare. Particularly for investors, privately funded health and wellness goods and services—a wide market including everything from nutritional supplements to dental implants—may be a safer investment focus since cost containment is less likely than with publicly funded healthcare.
About the only major category of spending that actually appears to decline for the baby boomer cohort moving into preretirement is apparel. Though some of this decline is part of a more general downward trend in the real cost of apparel manufacturing, the increased workforce participation of older baby boomers is likely to partly offset this decline as working tends to increase spending on apparel.
Toward the end of the next decade, spending by boomers will start to abate. That shift coincides with the potential decline in automation investment. Businesses and investors need to be mindful of the potential flattening of demand growth toward the end of the decade, in combination with other risk factors that could start to emerge from other parts of the macroeconomic landscape.
More government in more places is likely
Government involvement in the economy is likely to increase in response to rising inequality and market imbalances, particularly toward the end of the next decade or the early 2030s, with variations based on local market conditions. Already a number of governments, including Finland and Switzerland, are considering forms of universal basic income, for example. Consequently, we expect a general reversal of the falling tax rate trend that businesses have enjoyed since the 1980s. Businesses and investors may want to carefully consider the potential impact of higher overall taxation starting next decade, including higher taxes at multiple levels of government.
Over the longer term, governments may turn to adjusting income tax rates for higher income levels, potentially introducing another challenge for attracting and retaining highly skilled and highly paid workers.
Governments are likely to increase public spending over the long term in social services and public infrastructure. The erosion of capital infrastructure throughout many advanced economies is well documented (see the Bain Brief "The Great Eight: Trillion-Dollar Growth Trends to 2020"). Renewed investment in infrastructure is limited mainly by a lack of public sector resources. A larger government role in the marketplace would alleviate that constraint while potentially creating jobs for workers displaced by automation. Security infrastructure spending may also rise substantially, diverting resources away from private consumption and expanding the role of the government as a customer.
In their effort to redress market imbalances, governments also may seek to regulate competition, particularly among consumer goods and services firms. Such intervention is most likely in sectors facing high inflation, such as healthcare, but also potentially in any large, highly concentrated industry or sector. It is not a new trend but one that is somewhat cyclical. The formation of conglomerate structures in the middle part of the last century was partly a response by businesses to antitrust law enforcement. For businesses and active investors, stronger regulation or antitrust enforcement may make it more difficult to gain scale and force limited diversification, especially when partial overlaps can still reinforce a strong core. In particular, large-scale tech businesses will face continued scrutiny due to their size and competitive power despite the significant value they have created for consumers.
Intergenerational conflicts may rise
The combination of rising income and wealth inequality may raise questions about how resources are divided between baby boomer retirees and working-age millennials. Public pension and healthcare systems may be stretched to the breaking point in the coming decade. With growing income and wealth inequality, the shrinking base of middle-class workers to tax to support the growing pool of transfer-dependent retirees will be insufficient to fully fund the needs of all nonaffluent retirees. If and when governments need to make difficult trade-offs, transfers to support one group or another may materially impact their spending capacity.
For businesses and investors, government transfers may signal rising or falling spending patterns and business opportunities. For example, increasing transfers to retirees will likely trigger greater spending by retirees. By contrast, a shift in the balance of transfers to working-age households may diminish opportunities for senior-focused goods and services. Businesses, management teams and even shareholders may be drawn into the conversation about government transfers as they grapple with existing pension obligations, the scarcity of highly skilled workers, social pressure to address job losses and declining incomes among mid- to low-skilled workers.
Where we could be wrong: Alternative scenarios
Projecting the impact of macroeconomic forces a decade or more into the future is not easy. The timing, sequence and magnitude of each force could lead to a different scenario. For example, a substantially slower commercial rollout of automation than the base-case scenario outlined could lead to stagflation—growing demand from an aging, nonworking population throttled by shrinking productive capacity and an insufficient productivity boost from automation.
Alternatively, we may have underestimated the flexibility and fluidity of labor markets around the world to adjust to a stepped-up pace of transformation, enabling societies and economies to arrive quickly at a more prosperous balance of higher productivity and employment enabled by a smooth adaptation to incredible new labor-saving tools. This outcome echoes the more bullish technology-as-solution viewpoints with which we largely agree—but only over a much longer time horizon, past the end of the horizon discussed in this report. The balance of historical experience, including experience watching recent adjustments to far more modest market disruptions than contemplated here, such as the recent global financial crisis and recovery, suggests that labor market adaptations are sluggish and will be made even more sluggish by an aging demographic profile.
Potentially the most controversial element of our base-case scenario is the expectation that the government will assume a larger role in the marketplace. The opposite reaction might occur—namely, yet another retreat of government from the marketplace—but that scenario implies accepting the possibility that the demand constraint to growth due to income inequality becomes a near-permanent fixture and an irreconcilable problem. Unfortunately, there is no data set to rely on when analyzing the possible outcomes beyond the pattern of history. In our judgment, the weight of the data suggests that governments are likely to play a more active role addressing market imbalances.
Conclusion
The coming transformation will test leadership teams profoundly. Automation will reshape national economies, throw labor markets into turmoil and change the rules of the game in many industries. Aging populations will strain social systems as never before. But the 2020s will be a period of growth and innovation, too. Eventually, beyond the time horizon of this report, the global economy will recover from the temporary imbalances created by demographics, automation and inequality. As the labor force develops new skills, productivity gains will benefit a broader segment of the population, and new industries will flourish.
Getting there is the challenge. How should leadership teams set targets or goals if longtime assumptions are no longer valid? Clearly, there is no set formula for managing through significant macroeconomic upheaval. But there are many practical steps companies can take to assess how a vastly changed macroeconomic landscape might affect their business and how to position themselves for change. In our view, the most important one is building resilience. Organizations that can absorb shocks and change course quickly will have the best chance of thriving in the turbulent 2020s and beyond.
Historically, life spans have increased very consistently—roughly five years every two decades in advanced economies. Much of that increase has occurred because of falling infant and midlife mortality rates. However, over the next several decades, life span expansion will slow in advanced economies. Even if science develops cures for heart disease and cancer by 2040, a host of late-life diseases will slow growth in both life expectancy and the span of healthy years. Advancements in treating aging as a disease would have a major impact on living longer, healthier lives and working longer. Initially, however, only the wealthy would likely benefit from these treatments (see the figure, "Life span growth will slow unless doctors start treating aging as a disease").
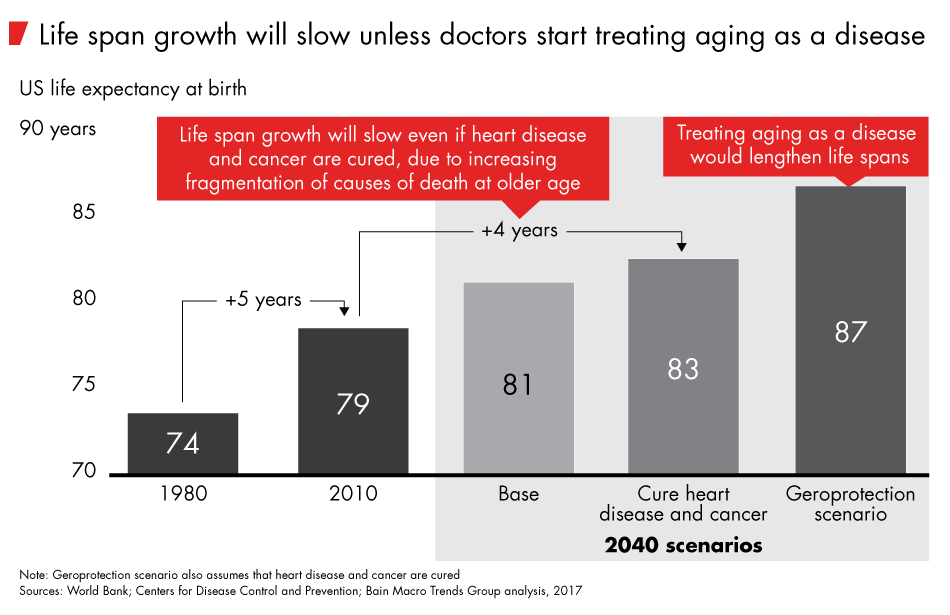
The five ages and stages of life
Two new stages of life have emerged in the 21st century: second adolescence and preretirement (see the figure, "The five ages and stages of life").
Second adolescence: The rising cost of adulthood and higher college enrollment have created a transition phase between childhood and adulthood (ages 18–29). The rise of second adolescence is delaying key life events such as work, marriage, having children and buying a home.
Preretirement: Longer and healthier life spans are enabling people to work longer, creating a new transitionary stage of life between work and retirement (ages 55–74). This stage is continuing to expand, leading to increasing labor force participation rates, incomes and consumption among those age 55 and older.
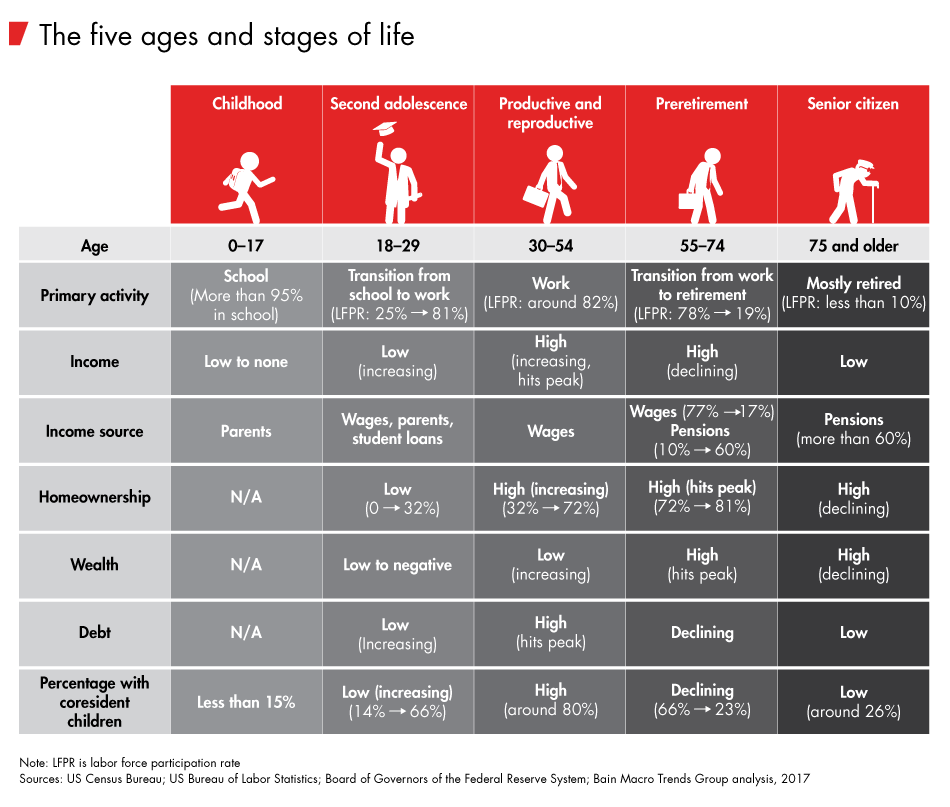
Birth rates are higher among top earners
Many people assume that birth rates continue to fall as incomes increase. Historically, this has been the case—wealthier countries have far lower birth rates than developing economies. However, for those with the highest incomes, birth rates actually begin to rise again. This indicates that the decision about how many children to have is at least partially driven by economics: People may opt to have more children if they have no economic constraints (see the figure, "Birth rates generally fall as incomes increase but rise again for highest earners").
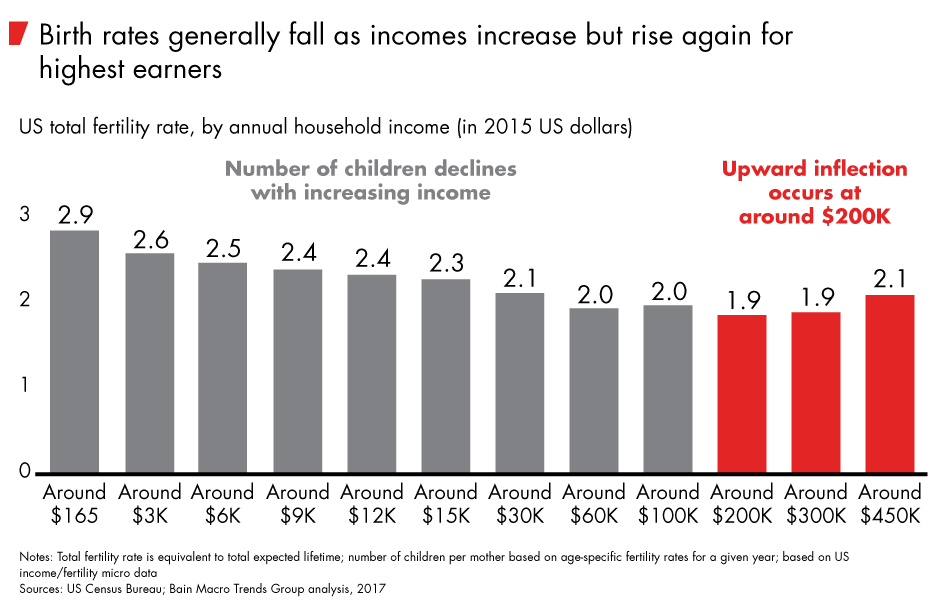
Karen Harris is managing director of Bain & Company's Macro Trends Group and is based in the firm's New York office. Austin Kimson is director of Bain's Macro Trends Group and is based in the Dallas office. Andrew Schwedel is a partner with Bain in the New York office.
Please direct questions and comments about this report to Bain-Macro-Trends-Group@bain.com
Acknowledgments
The authors express their appreciation to the many members of Bain & Company who provided insights for this report, including James Allen, Jennifer Binder-Le Pape, Chris Brahm, Paul Cichocki, Dale Cottrell, Tamar Dor-Ner, Aaron Cheris, Herbert Blum, George Cogan, David Crawford, Orit Gadiesh, Mark Gottfredson, Weiwen Han, Mike McKay, Henrik Naujoks, Raj Pherwani, Darrell Rigby, James Root, Tom Shannon, Velu Sinha, João Soares, Tim van Biesen, Suzanne Tager and Gary Turner.
The authors express their gratitude for research support provided by our team composed of Nathan Rogg, Taher Ezzi, Winston Riddick, Alec Renfroe and Sam Carlson.
They also thank Gail Edmondson and Paul Judge for their tireless editorial support.
This work is based on secondary market research, analysis of financial information available or provided to Bain & Company and a range of interviews with industry participants. Bain & Company has not independently verified any such information provided or available to Bain and makes no representation or warranty, express or implied, that such information is accurate or complete. Projected market and financial information, analyses and conclusions contained herein are based on the information described above and on Bain & Company's judgment, and should not be construed as definitive forecasts or guarantees of future performance or results. The information and analysis herein does not constitute advice of any kind, is not intended to be used for investment purposes, and neither Bain & Company nor any of its subsidiaries or their respective officers, directors, shareholders, employees or agents accept any responsibility or liability with respect to the use of or reliance on any information or analysis contained in this document. This work is copyright Bain & Company and may not be published, transmitted, broadcast, copied, reproduced or reprinted in whole or in part without the explicit written permission of Bain & Company.


