Brief
Just a few years after many power generators in the US made investment bets based on belief that the price of natural gas would continue to rise above $12, a number are scrambling to hold on to those businesses in a world where gas struggles to top $4. Of course, generators weren’t alone in betting on rising gas prices: Others invested in LNG import terminals, gas-to-liquid plants or pipeline infrastructure in the wrong places—none of which seem like the right moves in a North American economy running on cheap natural gas.
Energy markets are difficult to predict at the best of times, and the natural gas supply shock is just one among many disruptive trends that utilities have to consider, including new sources of renewable energy, distributed generation, regulatory shifts and rising energy efficiency, coupled with declining consumer use. How can utility executives make long-term bets with such uncertainty?
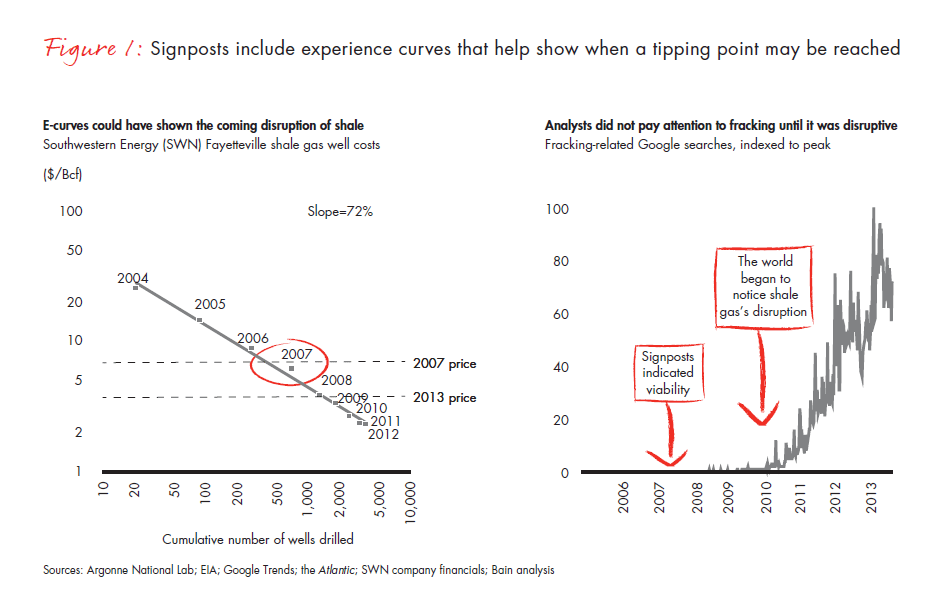
We believe it is possible for executives to make better decisions by defining and understanding the full spectrum of future scenarios and then identifying the key signposts that show where markets are headed. These signposts come in various forms, including industry data and analysis. Two that we find most important are experience curves (which show when technology costs reach tipping points that change supply-and-demand dynamics) and substitution barriers (which show how long it will take for new sources of energy to penetrate the market). For example, experience in shale gas operations was already driving down the costs of natural gas from shale fields below the market price by 2007, but most analysts still weren’t paying much attention until around 2010 (see Figure 1).

When you correctly identify and monitor these indicators, you can see several years further into the future, make better decisions—and be right more often. One utility used this technique to see that gas prices were likely to drop more than a year before they did, and so it was able to reposition its power-generation portfolio to deliver better returns.
The process of identifying these signposts begins with developing a series of scenarios for future states of the energy market. Given the many variables and possible scenarios, executives can focus on a limited set of plausible extreme “corners” (see Figure 2). Signposts for power utilities would include electricity generation, competition, regulatory possibilities and renewable technology. Within each, executives then develop a detailed market analysis that considers potential new technologies and sources, and the relevant efficiency gains that help determine supply curves and clearing prices. This process has helped us identify some of the most important markers for utility executives to monitor in different markets, some of which we describe below.

Leading utilities deploy this type of approach, but we believe more could benefit from it as they make strategic decisions in an industry experiencing significant disruptions. Scenarios and signposts can be powerful tools for understanding the evolution of the energy ecosystem at a time of unprecedented uncertainty. (For more on scenario planning, read the Bain Brief “Beyond forecasting: Find your future in an uncertain energy market.”)
Scenarios in the utility industry
Among the biggest decisions facing utility executives are whether to substitute one source of fuel for another in power generation (for example, natural gas over coal, or renewable sources over either), and where to play along the value chain in the industry, from power generation through transmission and distribution and down into wholesale and retail. Because regulations vary, these scenarios will differ from one country or region to another. But the process of identifying extreme outcomes is the same, wherever you are.
- Identify the variables affecting growth and profit in the areas where you do business, including regulations (carbon taxes, renewable standards, rate structures), technology changes (renewable generation, storage), deregulation and so on. We typically see 40 or more variables that could affect the business.
- Cluster together those variables that depend on one another. This models the actual complexity of the situation and helps identify the true corners of the business.
- Develop signposts that reveal whether the environment is moving in the direction of one extreme or another. Set thresholds on metrics that indicate when disruptive change is imminent. For example, as the costs of battery technology drop, batteries will hit a tipping point that will make them competitive for voltage regulation, transmission and distribution, or utility-scale applications. You might also track campaign promises of politicians around carbon taxes or other regulations.
The real value of setting scenarios and signposts is that the process gets executives discussing and tracking the variables that really matter and the interdependencies among them. Most companies do some scenario planning, but too often they fail to invest enough effort evaluating dependencies among variables and across scenarios. We describe a couple of scenarios we have developed to monitor the utility sector and the insights the scenarios have led to.
Gas galore. Even before North American shale gas began to make a big impact on the market, we determined that its price uncertainty could affect generation capacity in the US. Today the market has moved in this direction, and in the US, natural gas is displacing coal in power generation—not only because the supply of gas has pushed prices down to 20-year lows, but also because environmental regulations are making coal-powered generation increasingly difficult. Through 2020, about 17 GW of generating capacity from coal will go offline. In most cases, it’s simply not economical to bring these plants into compliance with environmental regulations, especially if a natural gas substitute is available.
A surprising secondary effect of the revival of gas-powered generation in the US is that it has freed up more coal for exports to Europe and Asia. The US sent a record amount of coal in 2012, up 17% over 2011, pushing down global prices for it by about 25%. In Europe, coal is having a renaissance, with consumption rising by 3% a year since 2009 after 15 years of decline. Low carbon prices also reduce the incentive to switch to cleaner sources, and so underutilized gas-powered plants are being shut down. Germany’s retreat from nuclear power further contributes to the shift to coal. Monitoring these second-order effects can be a powerful tool for developing robust, flexible strategies.
Among the signposts critical to help executives monitor this shift would be the supply of natural gas in North America, the volume of coal exported to Europe and the carbon-emission rules in both regions. The price of carbon permits would also be a significant signpost for executives in Europe, as would the introduction of capacity payments to help power generators meet fixed costs.
Rise of renewables. At the other side of the cube is a scenario where renewables move markets. Progress along the experience curve combined with technological advances (and a push from regulators) could make renewables a truly disruptive technology in power generation over the next 5 to 10 years. As wind and solar power generation become more efficient and effective, we expect their costs to become competitive with conventional generation. Wind and solar costs are declining by 10% and 18% per year, respectively, in North America while installed capacity is growing 23% and 59% per year. Based on these experience curves, we see wind generation reaching economic parity with natural gas in North America around 2014–2015. Solar generation may be more complicated to predict, given differences between utility-scale generation and rooftop panels, and further complicated by net metering rules that vary from one place to another. But here, too, the experience curve is dramatic, and we expect solar to reach economic parity sometime between 2016 and 2020 in most of North America1 (and possibly Europe).
In Europe, energy from renewable sources is already so abundant it occasionally threatens to overpower the grid, leading to frequent negative power prices at peak supply times. In the US, where renewable power depends more on solar roof panels, there are limits to the percentage of power that can be generated by renewables until there is some kind of breakthrough in energy storage. Utility-scale battery storage would change the equation for renewables, allowing wind and solar to contribute more to the total power equation, but that’s probably more than five years away.
These trends and others, such as changes in the way net metering gets implemented, could lead to major disruptions in the utility model and will require significant shifts in regulatory structures. Executives in Europe and North America will need to monitor many of the same signposts to evaluate the market around renewable power generation. Utilities evaluating their renewables portfolio (or weighing how to construct one) will want to monitor the cost and efficiency of wind turbines and solar panels, and also the progress of the capacity of industrial-scale batteries. Understanding when these technologies will reach tipping points can allow executives to develop proactive approaches to regulators, make investment decisions and decide whether to enter businesses that will be growing in the future, rather than have their business models damaged by new competitors. For example, utilities in Arizona and Nevada have worked with regulators to increase the fixed charges for connection to the grid, to help maintain critical infrastructure as usage levels off or declines.
Similar scenarios could be developed around deregulation, upgrades in retail technologies, distributed energy, micro grids and other changes.
Advantages of scenario planning
When leadership teams weigh different scenarios rather than betting on one point of view, they can see which strategies will help companies win under different conditions and respond nimbly as signposts indicate shifts in direction. Understanding the interdependencies of variables and second-order effects lends confidence to “no regrets” moves that are advantageous across scenarios. Scenario planning also allows executive teams to take a more flexible approach, which differs from traditional strategic planning in several ways.
- “No regrets” moves. First, you begin thinking about strategies that are robust under several scenarios, and you can take “no regrets” moves that make sense, whichever direction the market heads.
- Options in strategy. You begin to build option value into your strategy based on different scenarios. One industrial company decided to construct dual fuel facilities even though they are more expensive. Executives concluded that the additional cost was lower than the option value it created to switch fuels as prices shifted.
- Dynamic decision making. You can determine in advance the decisions you will make if certain signposts flash red, eliminating the need to be reactive and study alternatives when you see the market shift.
- Foresight on tipping points. Metrics and signposts allow you to see three to five years further out than traditional planning. By tracking experience curves and regulatory trends, you can see tipping points long before they arrive.
- Dashboard for executives and boards. This tool becomes an outstanding way to keep executive committees and boards apprised of changing markets. We find that the potential hundreds of variables can be reduced to 15 to 20 key signposts, which can be described as red, yellow or green. Once a board is comfortable that the utility has its arms around all of the major variables, it becomes easier to communicate changes: “In the last quarter, two signposts have gone from green to yellow, and one from yellow to red. Based on that, let us give you some more detail about the decisions we have made as a result of those shifts.”
Traditional forecasting can take you only so far. The uncertainties affecting the future of the utilities sector—regulation, new technologies, declining use and supply shocks—make it impossible to predict the future. But companies can build the capabilities to see further down the road by developing scenarios, identifying signposts and tracking leading indicators. Doing so will help businesses and their investors make sense of the future landscape.
Julian Critchlow is a partner with Bain & Company in London. He leads Bain’s Global Utilities practice. Mark Gottfredson and John Norton are Bain partners in Dallas.
