Report
 }
}
This section of Bain’s 2019 Global Private Equity Report examines how the industry performed last year, from investments and exits to fundraising and returns. Explore the contents of the report here or download the PDF to read the full report.
The beginning of the rest of the story?
The past five years have been ones of unprecedented success for the private equity industry. During that span, more money has been raised, invested and distributed back to investors than in any other period in the industry’s history. Private investment in general, and private equity in particular, seems to be on a secular penetration curve that has no end in sight. Yet, there are also some cautionary notes to sound.
Returns, while still strong relative to other asset classes, have slowly declined toward public market averages during the period. Persistent high prices, volatile capital markets, US–China trade arguments, Brexit worries and, of course, the ever-present threat of recession have injected a sense of uncertainty that dealmakers dislike. The pace of technological change is also increasing in almost every industry, making it harder to forecast winners and losers. So, while the good times are rolling, some bells of worry are tolling.
In this, Bain’s 10th-anniversary Global Private Equity Report, we look fearlessly at the industry’s strengths, its challenges and the evolutionary path that lies ahead.

The beginning of the rest of the story?
Bain’s Global Private Equity Practice leader reflects on five years of record breaking industry performance and how the best firms are preparing for the future.
The private equity market in 2018: What happened?
As the current economic expansion chugged into its ninth full year in 2018, the global private equity (PE) industry continued to make deals, find exits and raise capital at a historic five-year pace. Limited partners (LPs) remain highly enthusiastic and have continued to flood the market with fresh capital. Keeping the momentum going, however, has hardly been easy.
Chronically heavy competition has driven deal multiples to historic highs, and growing jitters about an eventual economic downturn are affecting decision making, from diligence to exit planning. For general partners (GPs), putting record amounts of capital to work means getting comfortable with a certain level of discomfort when investing. They are paying prices they swore they would never pay and looking to capture value that may prove elusive post-close. The most effective GPs are stepping up their game to identify targets and sharpen diligence, while simultaneously planning for the worst. In Sections 2 and 3, we’ll explore several strategies firms are using to make the most of an increasingly difficult market. In the meantime, here’s what happened in 2018.
• • •
Investments: More strength, same challenges
Amid heavy pressure to do deals, the PE industry saw another impressive surge in investment value in 2018. Fierce competition and rising asset prices continued to constrain deal count—pushing down the number of individual transactions by 13%, to 2,936 worldwide—but total buyout value jumped 10% to $582 billion (including add-on deals), capping the strongest five-year run in the industry’s history (see Figure 1.1).
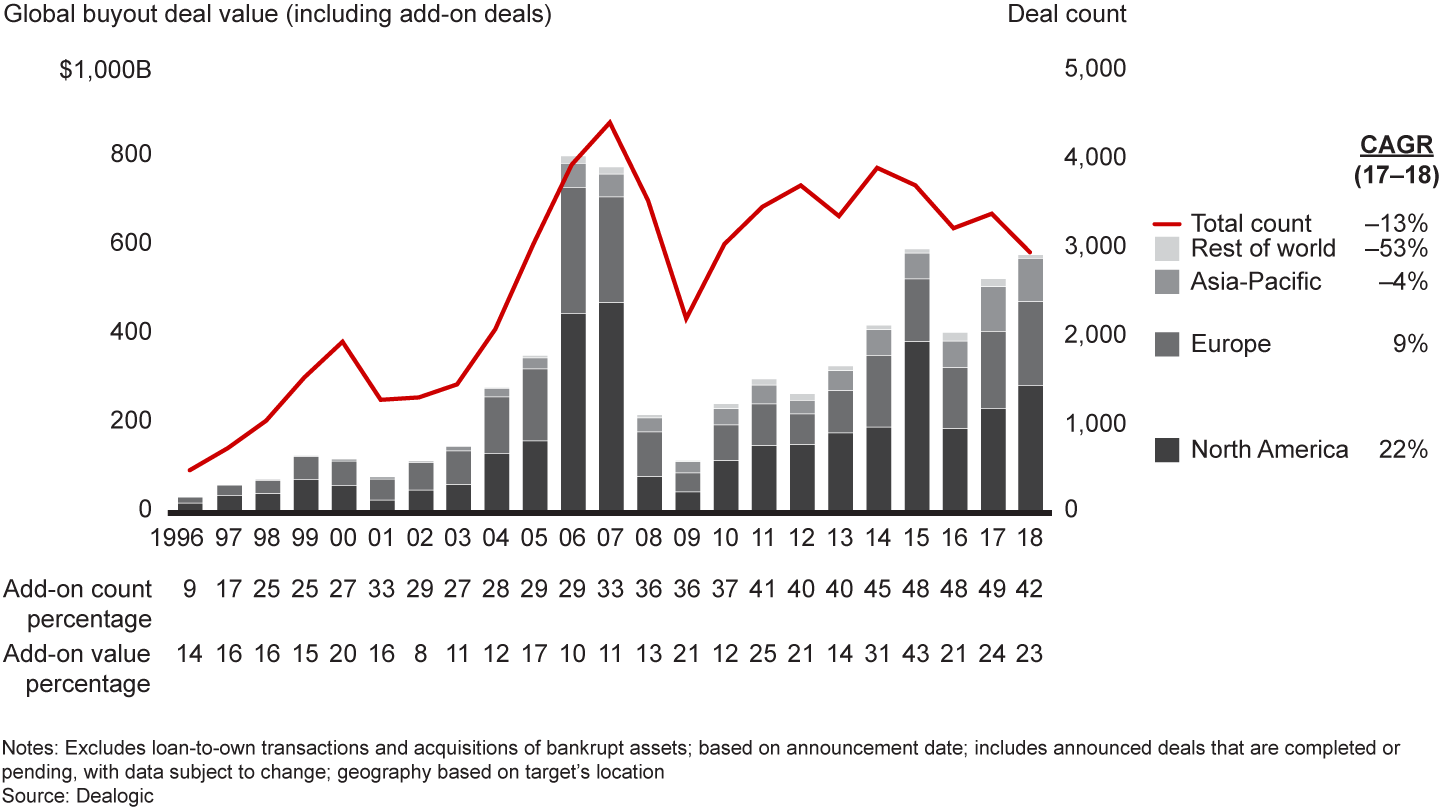

While the current investment cycle hasn’t been a steady upward march, especially in terms of deal count, it has shown great resilience and overall strength. Every year since 2014 has produced higher deal value than any year in the previous cycle, with the exception of the peak in 2006 and 2007. Over this period, the industry has benefited from an unprecedented wave of investor interest, buttressed by ebullient equity markets, low interest rates and steady GDP growth in the US and Europe. For GPs, it has been a remarkable run.
Predictably, experts are debating how long the good times can last. Only one other US recovery on record (from 1991 to 2001) has extended as long as this one. While GDP growth in the West remains strong, US interest rates are rising as inflation picks up in the US and Europe. Slowing growth in China, global trade tensions, ongoing uncertainty about Brexit and year-end market volatility are all fueling concern that this cycle may be running its course.
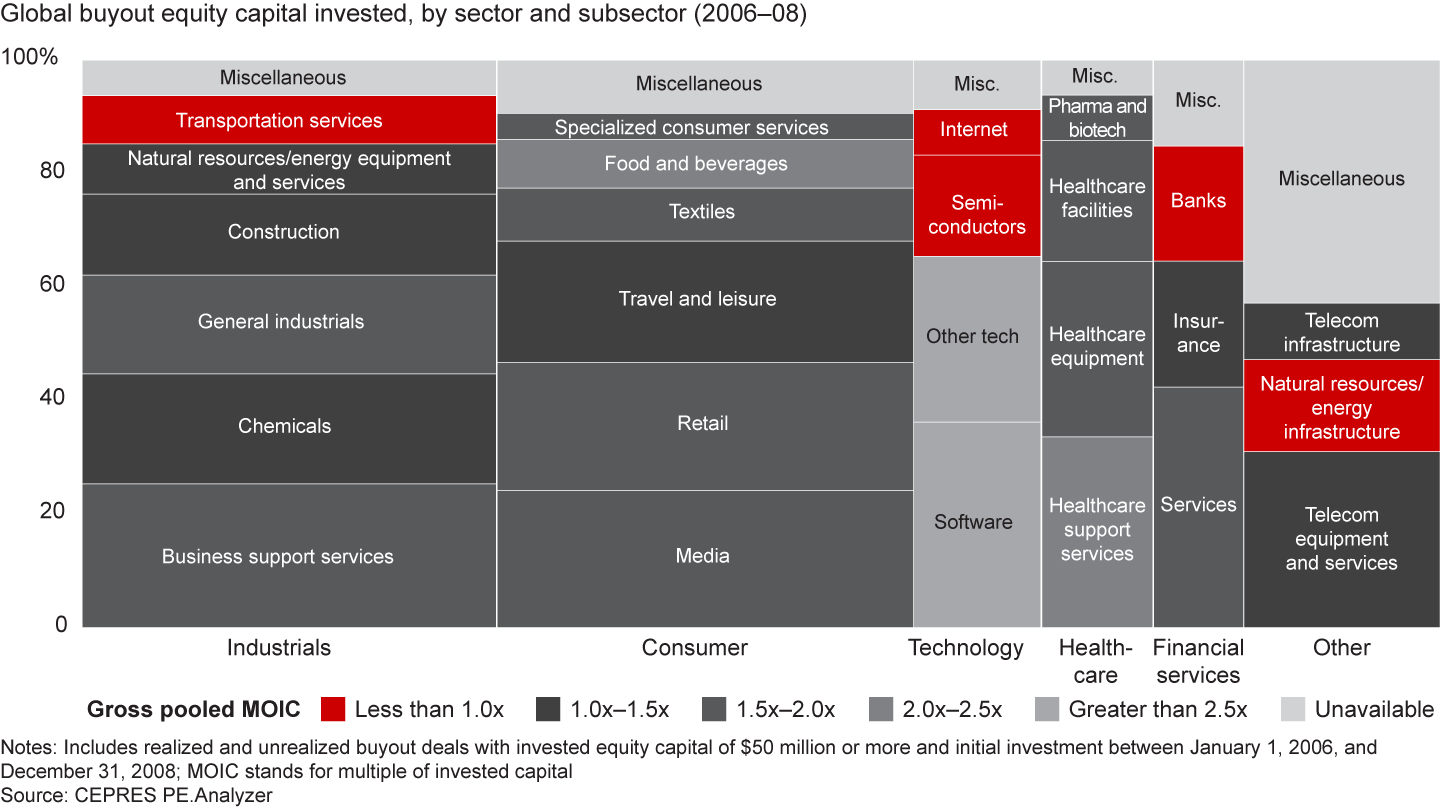
For PE firms, however, the question isn’t so much when the next downturn will appear as how to negotiate it successfully when it does. With record amounts of capital to invest, it doesn’t pay to sit idle trying to time the downturn. Instead, GPs are finding ways to cope with a growing level of macro uncertainty and planning carefully for how they can profit from the downturn. With the global financial crisis fresh in their memories, firms are focusing their diligence much more intently on downside scenarios this time around. They learned valuable lessons during the crisis about what holds up well through the cycle—or not—and are adjusting accordingly. Even within a sector like healthcare, widely viewed as recession-resistant, there were subsector differences in performance worth noting. Healthcare support services, for instance, produced multiples of better than two times invested capital, while healthcare equipment and pharmaceuticals fared less well, according to CEPRES, a digital investment platform and transactional network for the private capital markets (see Figure 1.2).

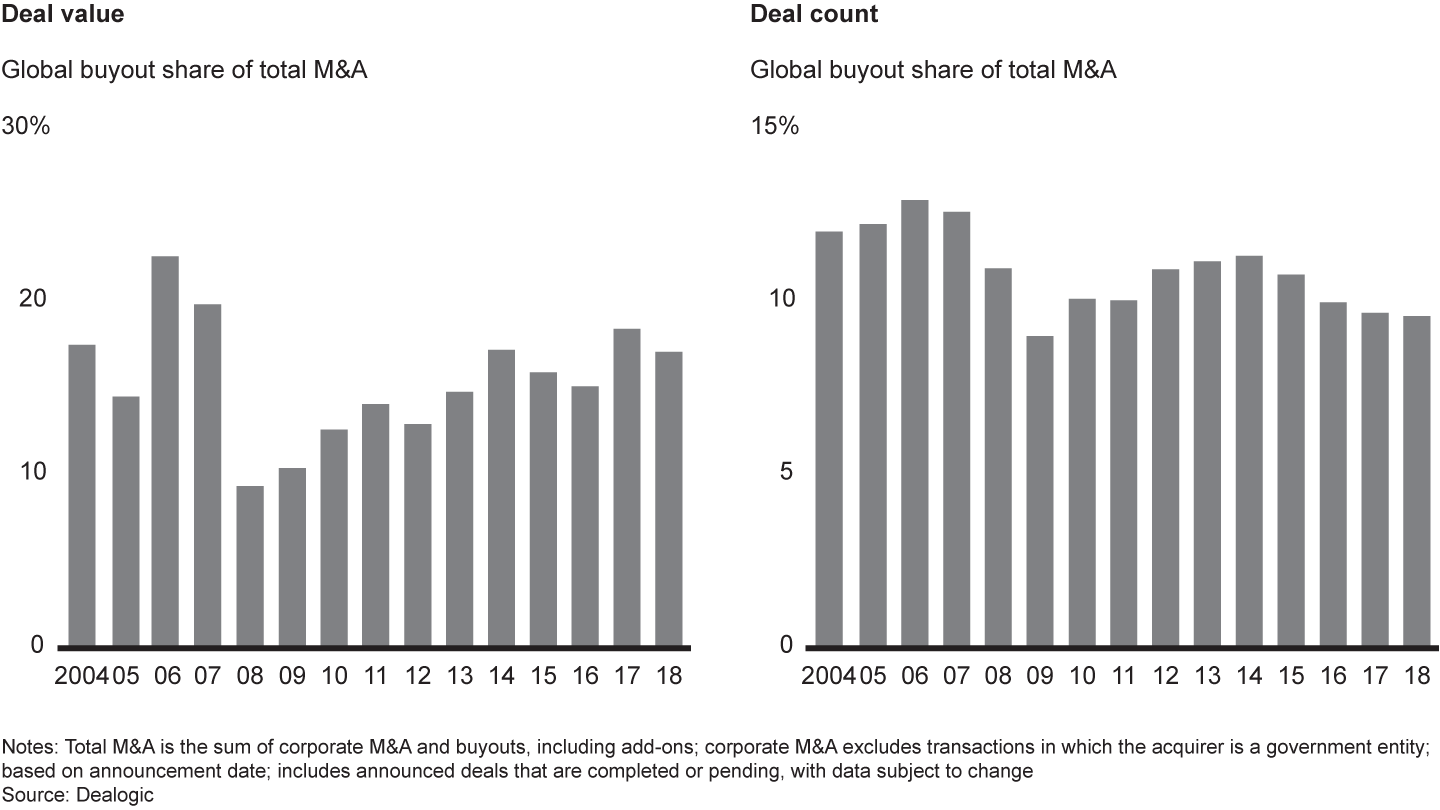
Spotting pockets of opportunity has been a challenge even in the up-cycle. For GPs, finding the right asset at the right price was the biggest constraint on doing deals in 2018. That helps explain why the number of transactions has remained stubbornly flat, bouncing around between 3,000 and 4,000 buyouts per year since 2010. Indeed, despite the industry’s impressive showing over the last five years, it has failed to carve out a larger share of the global market for mergers and acquisitions, which has hovered around 40,000 transactions per year for a decade (see Figure 1.3).

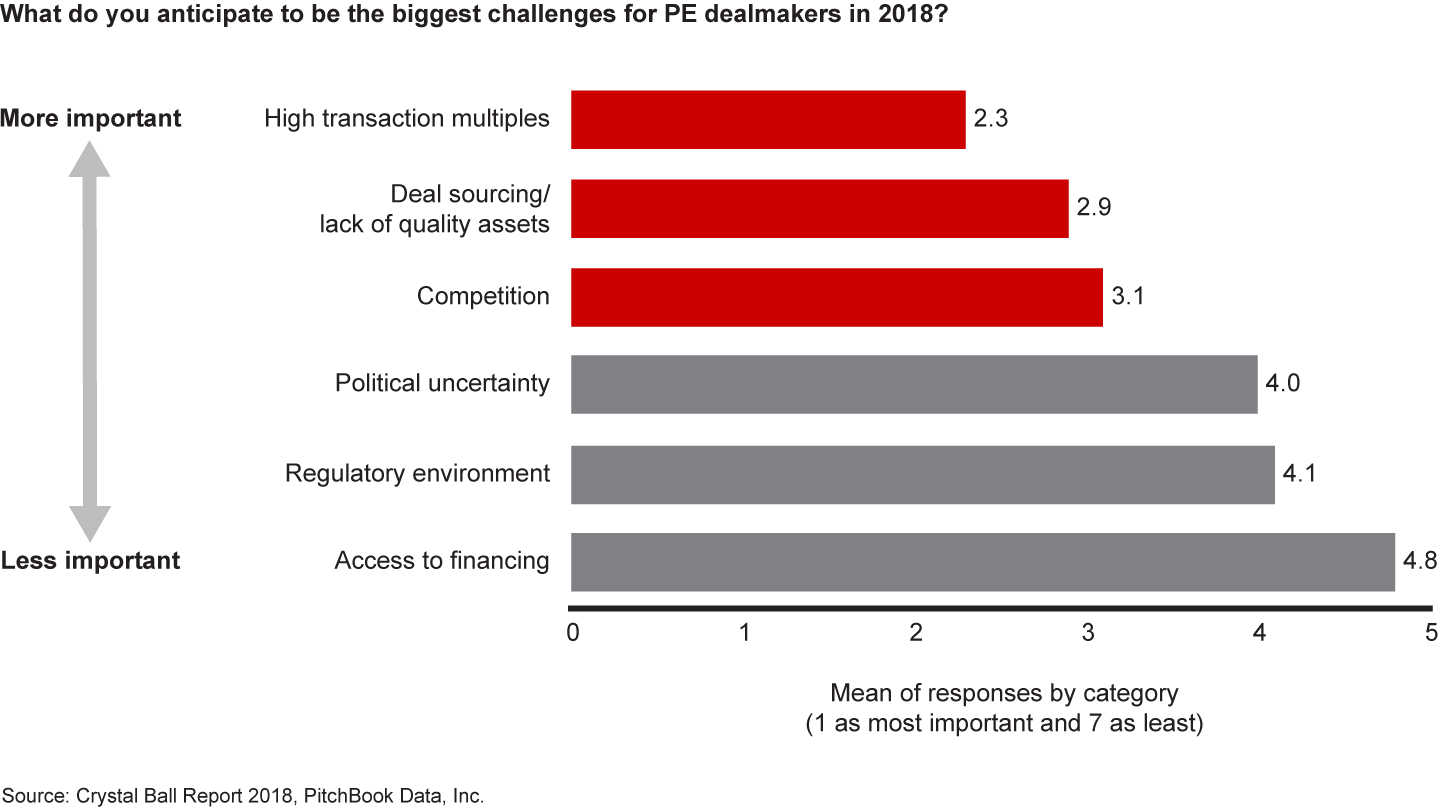
When asked what most gets in the way of closing more deals, GPs cite the same challenges they have faced for years: high deal multiples, a dearth of attractive targets and stiff competition (see Figure 1.4). GPs are clearly hungry to do more deals, but when they find attractive assets, they consistently encounter aggressive corporate buyers willing to push up auction prices. These buyers are strategic, meaning they will pay more to advance corporate objectives and capture synergies. Increasingly, they are showing up at all ends of the market as they search for ways to spur new growth through acquisition.

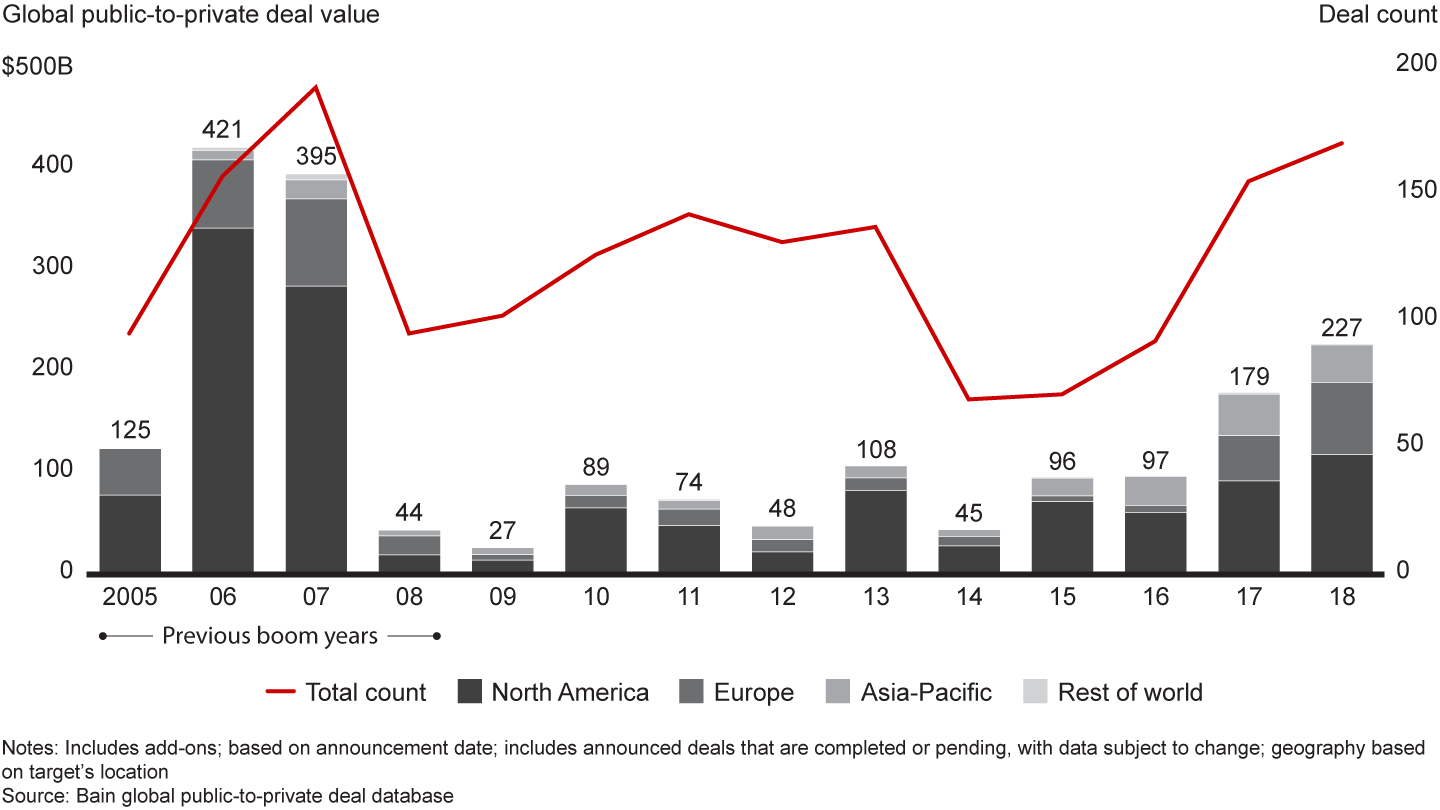
Large deals, especially a spate of very large carve-out transactions, helped boost deal value in North America by 22% in 2018. The year’s largest buyout was the $17 billion carve-out of Thomson Reuters’ Financial & Risk unit, led by Blackstone and the Canada Pension Plan Investment Board. Large public-to-private (P2P) deals, such as KKR’s $9.6 billion leveraged buyout (LBO) of Envision Healthcare, also contributed to the bump in value. The strong P2P activity in the US pushed the value of these deals globally to its highest level since the previous take-private boom in 2006–07 (see Figure 1.5). The reason: Despite the run-up in equity prices, public investors often undervalue companies they don’t understand. “If you have a complicated story, you’re not really welcomed so much in the public market,” said Josh Harris, the cofounder of Apollo Global Management, which took LifePoint Health private in 2018. “That is creating a very fertile hunting ground for private equity, and we do see more opportunities here.”

Sponsor-to-sponsor deals also provided a rich vein of opportunity in 2018. That was especially true in Europe, where deals between PE funds dominated in terms of both value and deal count, as they have since 2010. Partners Group led a consortium including CDPQ and the Ontario Teachers’ Pension Plan in the $5.4 billion acquisition of Techem, a global leader in heat and water submetering services, from Macquarie. EQT acquired Azelis from Apax Partners for $2.3 billion. It was the fourth consecutive sponsor-to-sponsor transaction for Azelis, a global distributor of specialty chemicals and food ingredients.
Sponsor-to-sponsor deals get a bad rap because they can be inefficient in terms of repeated transaction fees, and the paths to value creation may be less obvious. Yet PE firms continue to see value in them. Indeed, Apax Partners netted a 3.5 times return when it sold Azelis. Working with another firm on the sell side can make deals significantly easier by speeding up both diligence and the transaction process. Previous PE ownership also generates a reliable track record and reassures buyers that any time bombs have likely been found and defused. Research consistently shows that sponsor-to-sponsor deals have performed at least as well as primary buyouts over time, often with less risk. When deals have gone bust, failure was frequently the result of factors that could affect any business, whether or not it was previously owned by a PE firm.
What’s clear is that GPs are hard at work searching out value wherever they can find it. After years of record-level fund-raising, PE funds are awash in capital and face a growing need to put large amounts of money to work. Despite the strong pace of investment since 2014, PE dry powder, or uncalled capital, has been on the rise since 2012 and hit a record high of $2 trillion in December 2018 across all fund types (see Figure 1.6). That stockpile raises concerns that the industry may be getting ahead of itself, much as it did in 2007 and 2008, when the global financial crisis slammed the brakes on dealmaking, leaving GPs holding years’ worth of uncalled capital and seeking extensions.
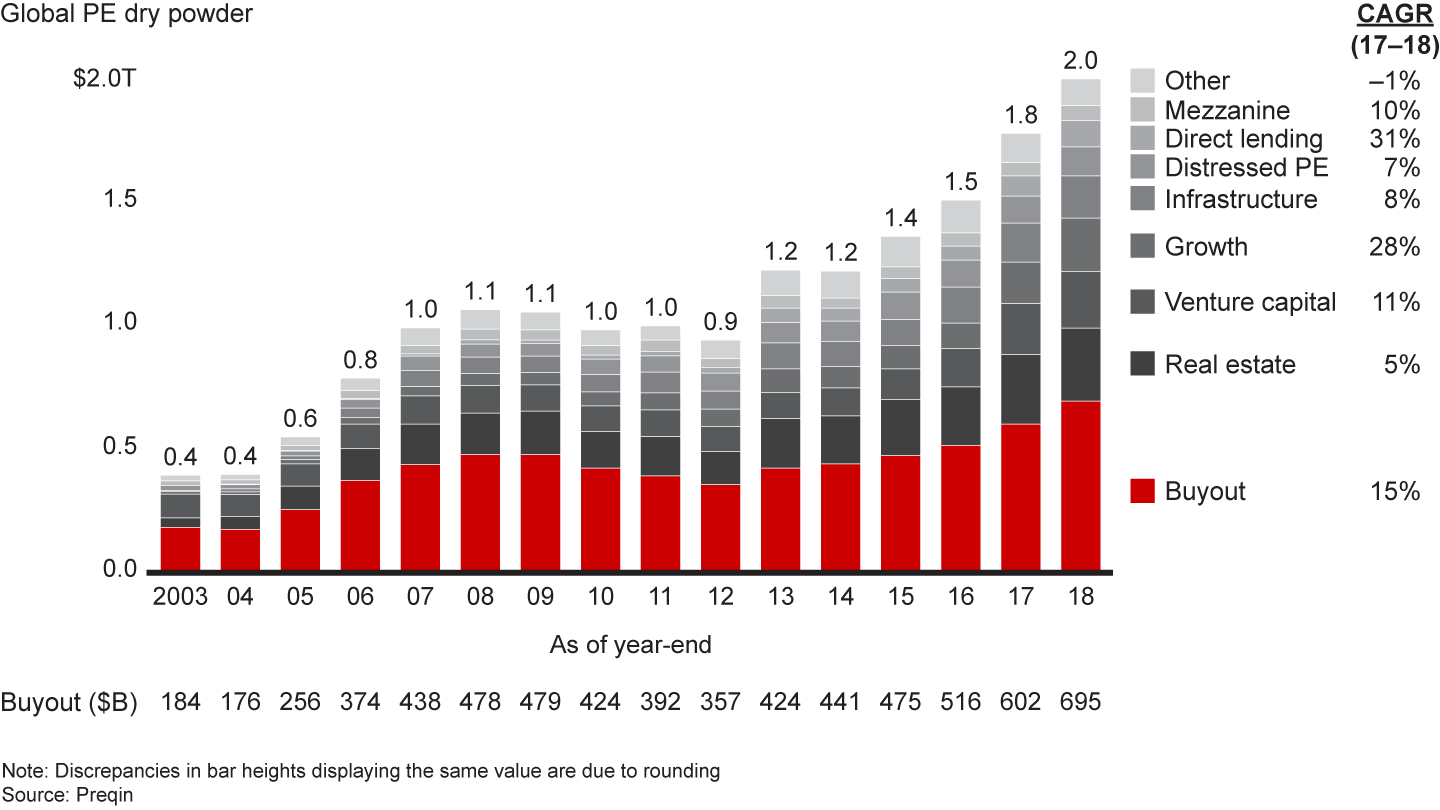

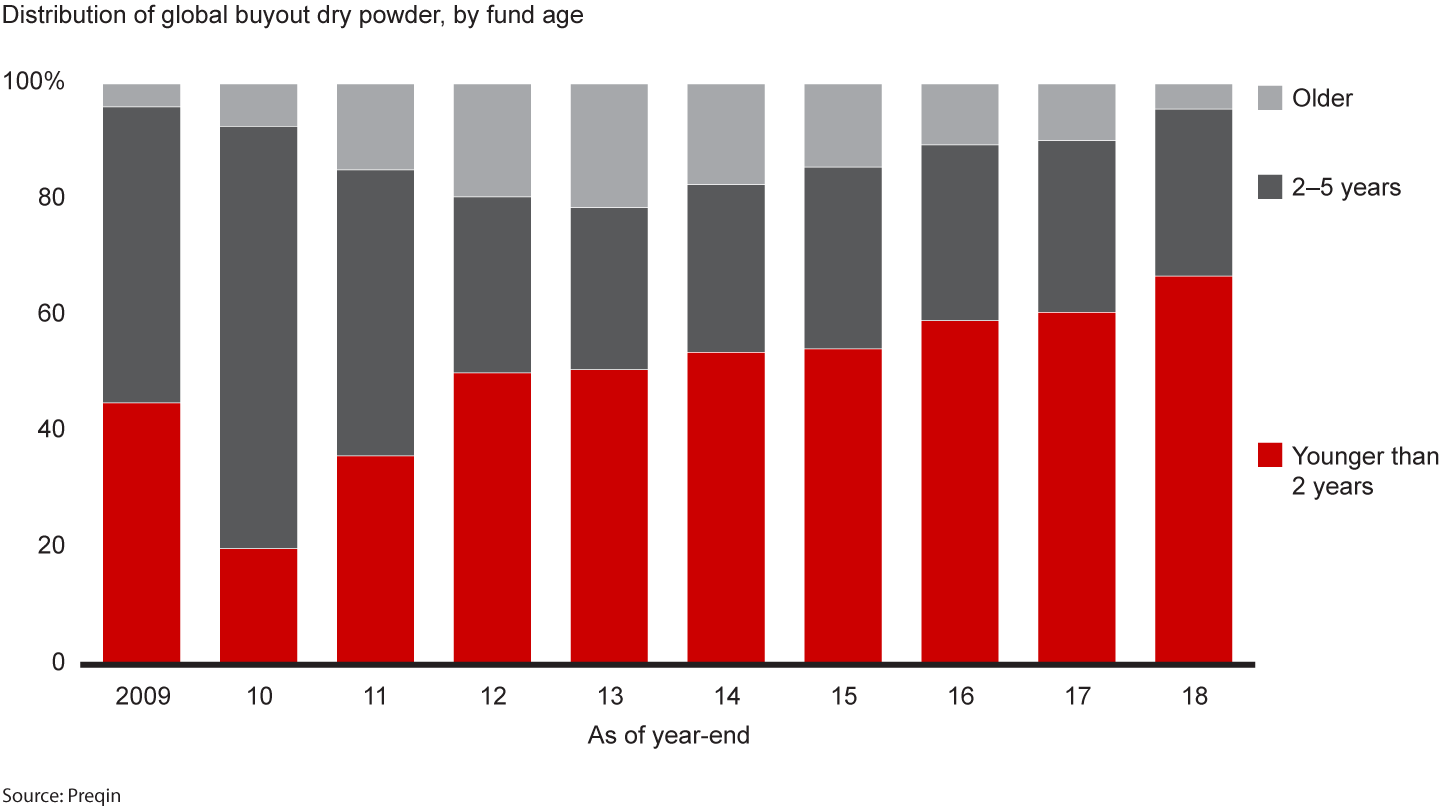
While the level of dry powder bears watching, a closer analysis of the dynamics at work today suggests there’s little danger of the buyout industry falling too far out of balance. Based on current deal values, the dry powder held in buyout funds today represents 3.0 years of investment, vs. 4.6 years in 2007 and 2008. That duration is well below the buyout industry’s typical five-year investment time frame, suggesting that GPs have time to get unspent capital into the market. Of course, duration would rise if a recession developed over the next couple of years, but it would take a major downturn to produce a significant spike. Dealmaking would have to drop to the 2010–12 average for a sustained period of time—an unlikely scenario—for duration to push back above the five-year mark. It helps that PE funds are accumulating mostly “young” capital, raised by funds with recent vintages. Buyout firms hold 67% of their dry powder in funds raised in the last two years (see Figure 1.7). That means the recent deal cycle is clearing out the older capital and replacing it with new.

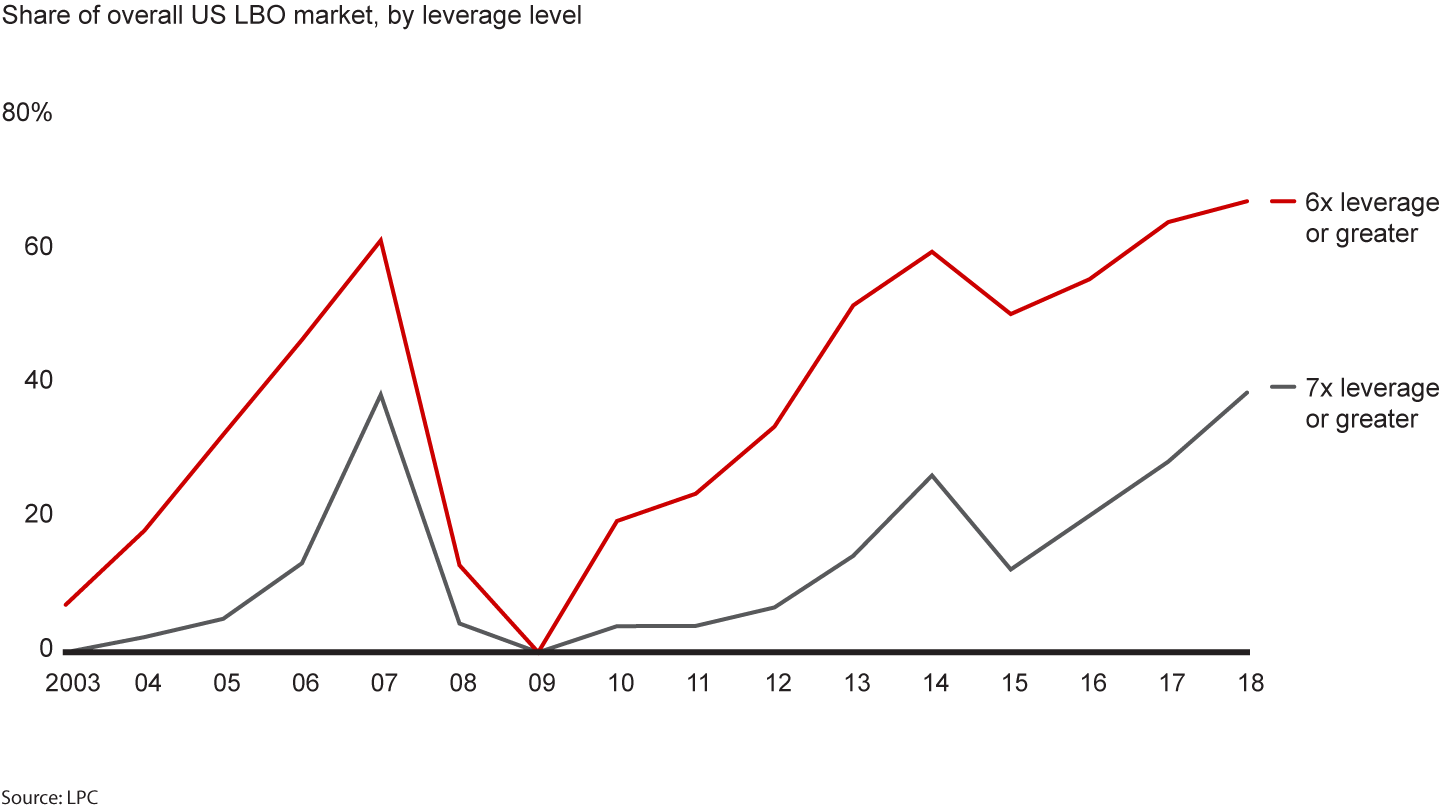
The debt markets encouraged GPs to keep doing deals through much of 2018. Despite the rise in US interest rates, the updraft was slow to be felt in loan pricing. Lenders, meanwhile, were competing aggressively to extend credit on easy terms. So-called covenant-lite loans have become increasingly common in lending markets in the second half of this cycle, and debt multiples have entered territory not seen since the peak of the last cycle. In the years following the global financial crisis, regulators discouraged multiples of six times earnings before interest, taxes, depreciation and amortization (EBITDA). Yet in the Trump era’s more relaxed regulatory environment, the share of deals with multiples of greater than seven times EBITDA rose to almost 40% of the total, according to Loan Pricing Corp. (LPC), which tracks the syndicated loan market (see Figure 1.8). The true leverage deployed in many deals may also have been understated: As is often the case in times of high risk tolerance, banks have allowed borrowers to calculate multiples based on projected earnings instead of actual results. Such calculations tend to bake in expectations for cost cutting, synergies and revenue increases that may or may not materialize.

As hot as the debt markets were for most of 2018, there were signs near year-end that things were cooling off. Amid heavy market volatility, Bloomberg reported that US leveraged loan funds saw $15.7 billion in outflows from November 21 to January 2, a seven-week rout that included the worst week on record. The news service also reported that Wells Fargo and Barclays had failed to sell a $415 million leveraged loan related to Blackstone’s $700 million purchase of oil services firm Ulterra Drilling Technologies. Bloomberg said the banks reportedly planned to hold the loan on their books until they could once again try to unload it in January.
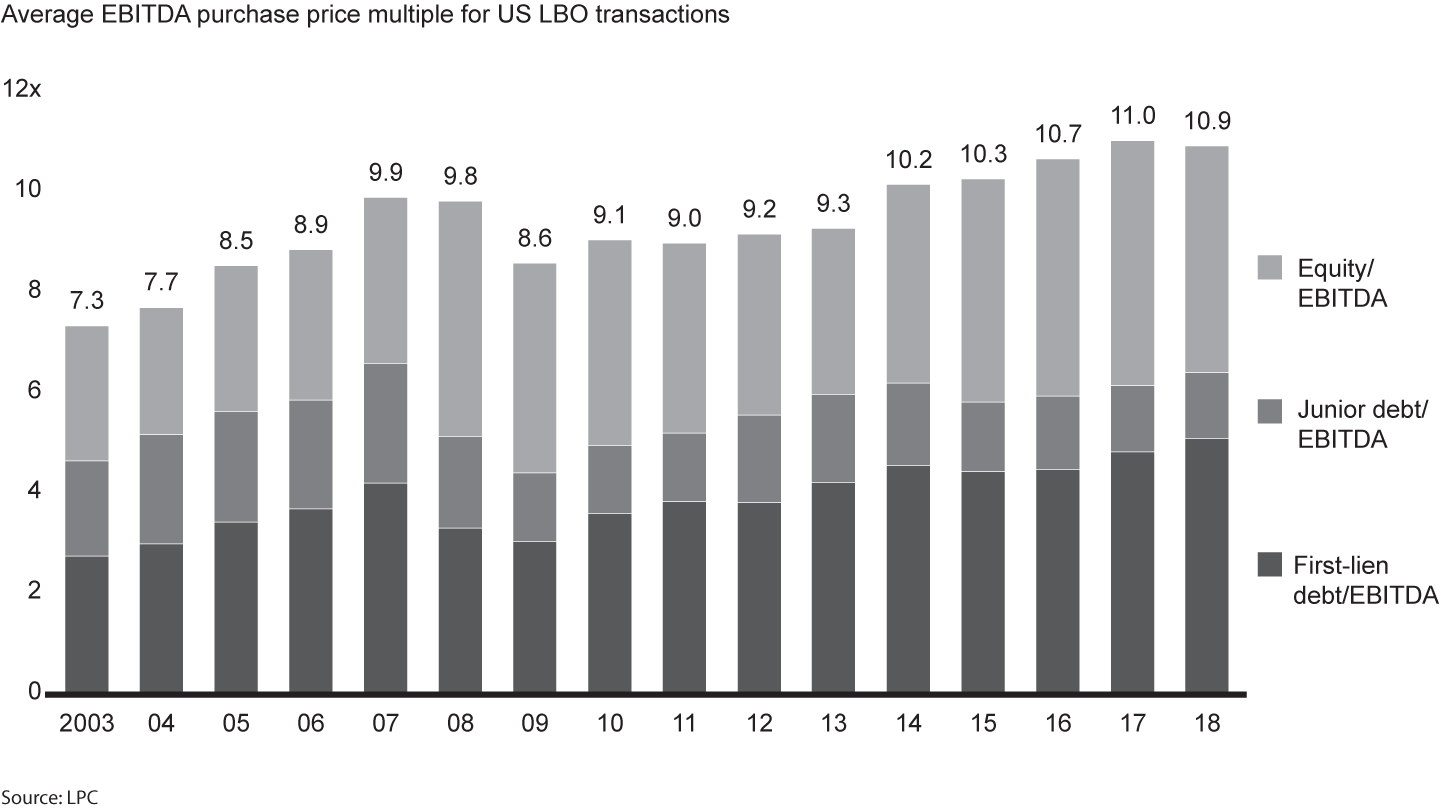
The heavy competition for assets and the flood of capital—both debt and equity—into the market since 2014 has had the inevitable effect of raising asset prices to all-time highs. The average multiple for leveraged buyouts in the US and Europe has hovered around 11 times EBITDA in recent years, above levels leading up to the global financial crisis (see Figure 1.9).

These dynamics—abundant capital on easy terms, pressure to do deals, rising asset prices and an uncertain economic outlook—raise all the usual end-of-cycle red flags. The best-positioned firms are adjusting their approach in several ways, both to win more auctions without overpaying and to hedge against the risk of a downturn.
- With asset prices high and competition fierce, the most effective firms aren’t pulling back. Rather, they are preparing themselves to either go big or go home. They are dialing in on the sweet spots and sectors where they are most confident, making clear calls on which auctions to show up for and which to avoid, as well as which teams to deploy. By starting diligence earlier and bringing in performance improvement experts, firms are working to build greater conviction about assets so they can bid more intelligently.
- Firms are also taking steps to get better access to target company management and data. That can strengthen the relationship and improve insights, giving the firm an edge against less-prepared bidders. In Europe, firms are taking it a step further: They are increasingly launching preemptive bids in an attempt to win an auction process before it starts.
- As we mentioned earlier, firms are paying much closer attention to what might disrupt their carefully prepared value-creation plans and looking to avoid blind spots. Not only are they running through more robust downside scenarios to pressure test investments, but they’re also anticipating other challenges—how to cope proactively with digital disruption, for instance, or how to negotiate issues like consolidation in the supply base.
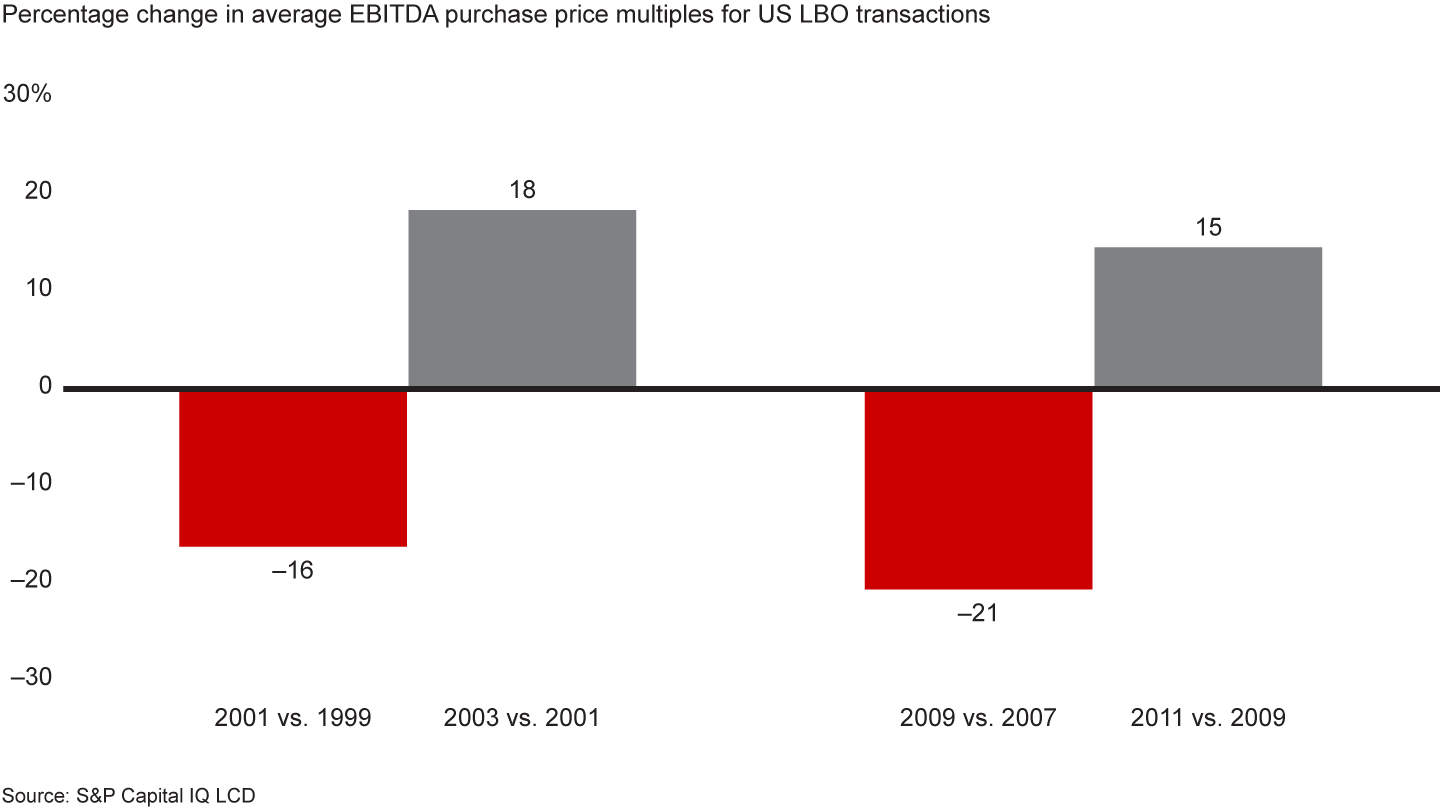
- Downturns inevitably create opportunities as markets stall and target company performance weakens. Historically, this brings valuations down—but not for long. In the past two downturns, the average LBO purchase price multiple dropped about 20% from its high but then recovered most of that within two years (see Figure 1.10). It pays to be ready to pounce when the downturn arrives, developing a clear understanding of where the most attractive targets are in a given asset class or sector and striking aggressively as the cycle plays out.
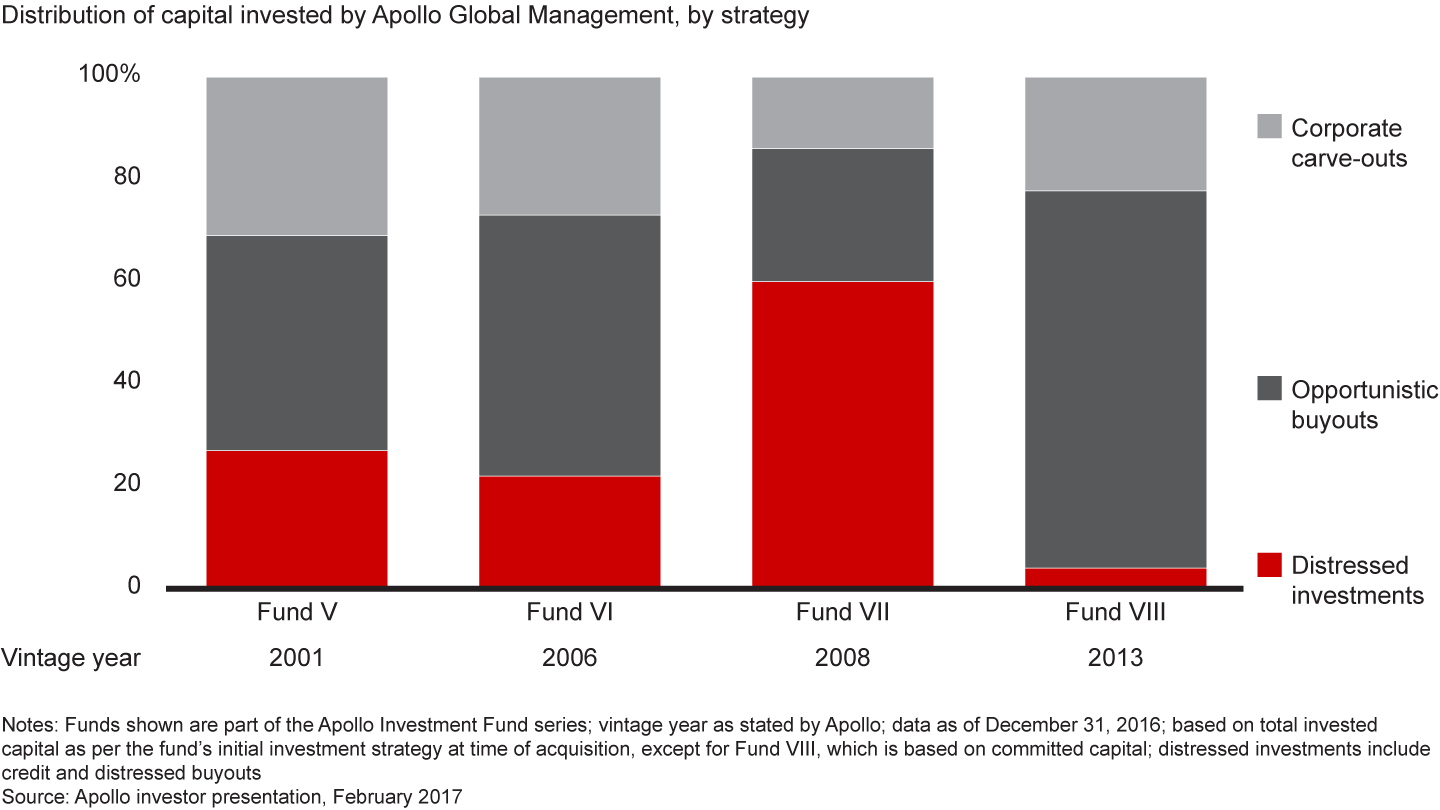
- That also applies to distressed situations. Recognizing that downturns create real opportunity for those prepared to invest across the capital structure, firms like Apollo and Centerbridge Partners have developed the capabilities to pivot quickly to buying debt or other distressed credits. In Apollo’s 2008 fund, for example, distressed debt and other credits made up 60% of total assets, reflecting the firm’s confidence in acquiring the debt of companies in trouble. By the 2013 fund, however, distressed investments comprised only 4% of assets as the economy improved and the firm shifted back to traditional equity investments (see Figure 1.11). “We traverse downturns,” Apollo cofounder Leon Black told the Financial Times. “Forty percent of all our money has been invested in downcycles, when everybody else shuts down.”
The industry’s structural challenges—high prices and fierce competition—are combining with macro uncertainty and accelerating digital innovation across sectors to force behavior change among PE firms. As we’ll explore in Section 2, the most effective are building new capabilities, like advanced analytics, or reinforcing existing ones, like merger integration. They are also underwriting new and different kinds of risk than in the past. Firms continue to put money to work, but they are working harder to get it done.



Private Equity in China: The Case for Caution
China's bubble may be ready to burst.
Exits: Strategic buyers keep the party going
Although exit activity in 2018 came in a smidgen lower than the previous year, it was still a strong contributor to a historic five-year stretch that has produced unprecedented distributions for investors. Last year’s 1,146 exits, valued at $378 billion, were on par with 2017 (see Figure 1.14). The robust performance brought total exit value since 2014 to $2 trillion, by far the largest five-year total on record.
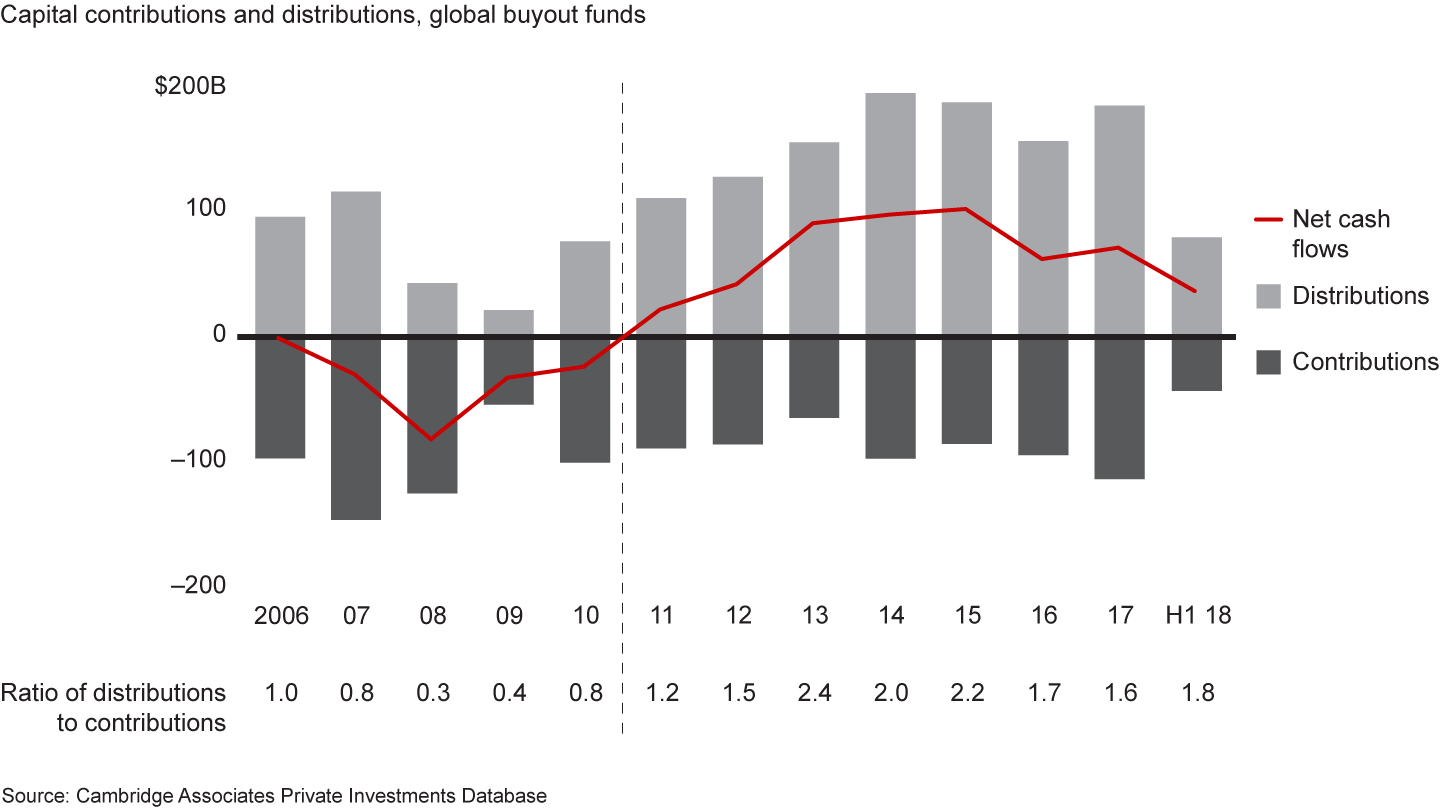
Activity over that period has bounced around somewhat, but the overall trend in exits has been strong and steady, generating an equally steady flow of capital back to LPs. Investors were cash flow positive for the eighth year running, meaning distributions have outstripped contributions each year—a virtuous cycle that has encouraged LPs to continue pumping capital back into the industry (see Figure 1.15).
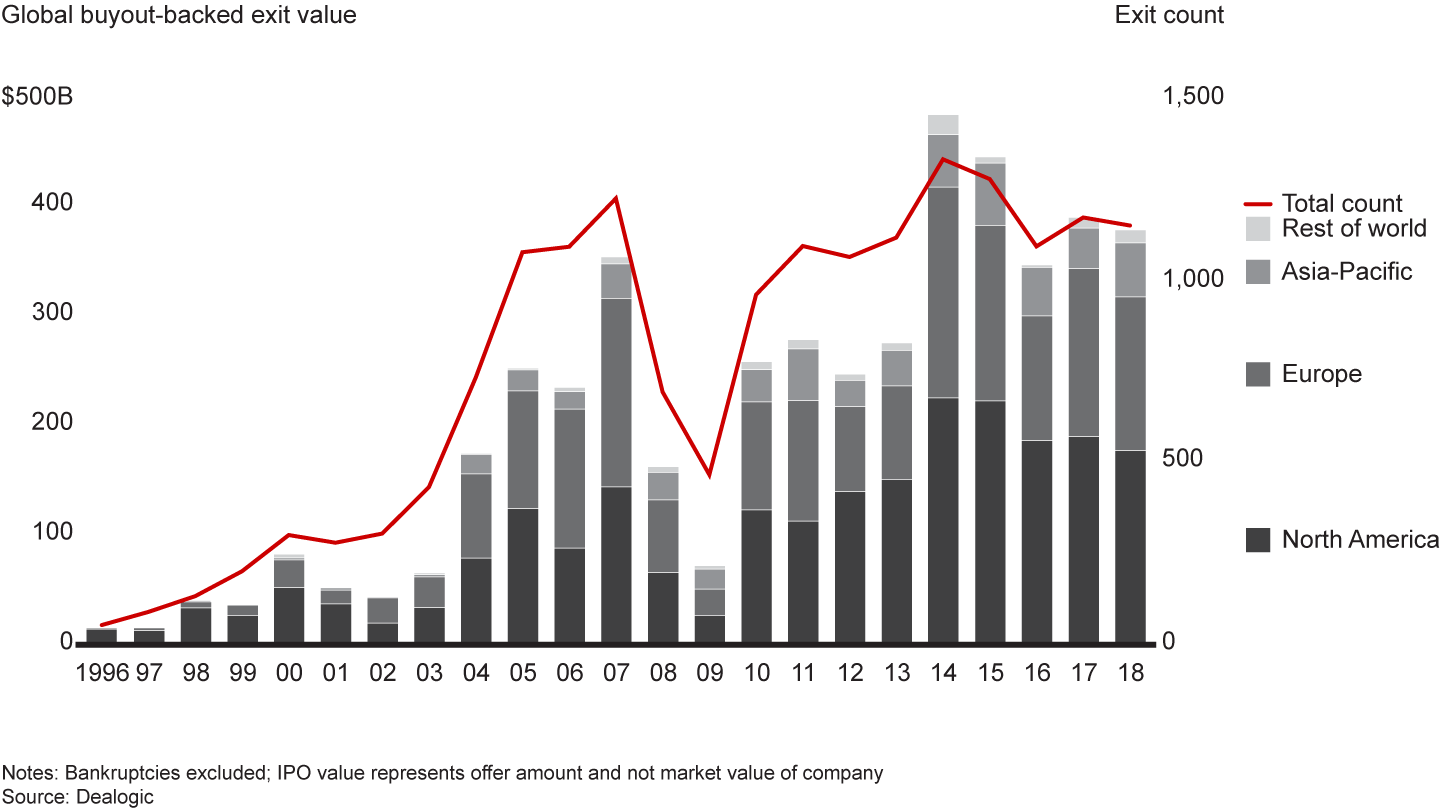


Exit value has been steady across regions, with the Asia-Pacific market producing the only real spike in 2018. Asia-Pacific exit count actually dropped during the year, but the average transaction size more than doubled due to a number of large exits in China and India. The US and Europe also benefited from a stream of big deals. Golden Gate Capital and Bain Capital, together with GIC, Insight Venture Partners and Elliott Management, produced the biggest exit in the US when they sold BMC Software to KKR for $8.3 billion. Europe’s largest exit was Macquarie’s $5.4 billion sale of Techem to Partners Group, CDPQ and the Ontario Teachers’ Pension Plan.
With some exceptions, such as partial exits, GPs are clearly in no mood to hang onto assets any longer than they have to. The median holding period (how long funds are holding onto portfolio companies before exiting) fell 10% last year to 4.5 years, after edging down slowly from a peak of 5.9 years in 2014. “Quick flips,” or assets held for less than three years, are still well below levels seen at the exuberant end of the last cycle, but they’ve crept up to 24% of the total (see Figure 1.16). Changes in the US tax treatment of carried interest were expected to discourage quick flips, but they ticked up last year anyway.
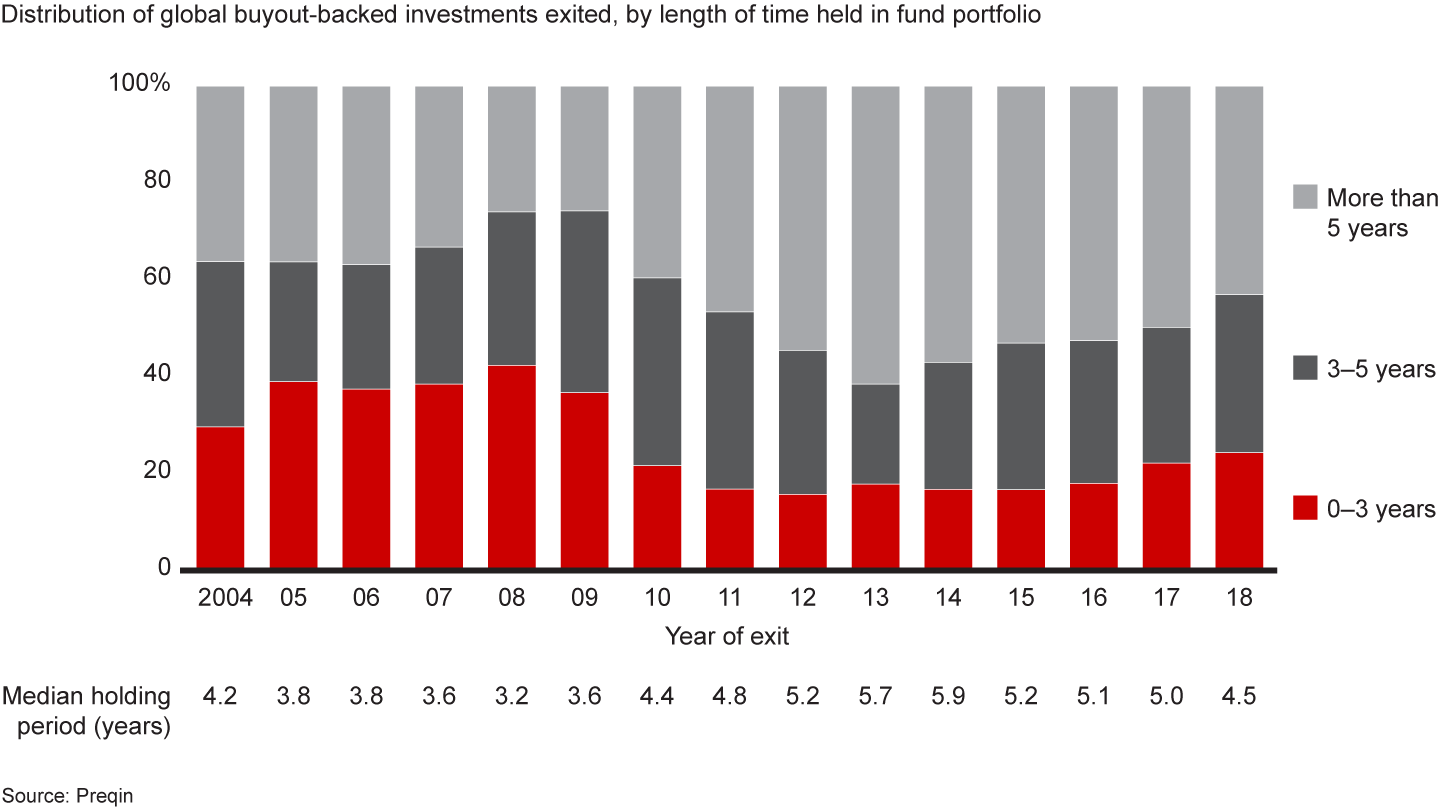

The urgency to sell reflects a number of factors. First, demand for assets among both corporate and PE buyers is ravenous. The same rise in competition and deal multiples that frustrates GPs on the buy side provides a rich opportunity to sell assets for premium prices. Second, as signs of economic weakness pile up, firms are also looking to sell anything that isn’t tied down, knowing that a recession could make it harder to sell later. Similarly, firms know that the robust fund-raising environment won’t last forever, meaning it pays to get back on the road as soon as possible. Many are willing to trade a little bit of IRR on current exits so they can turn to raising a new (and hopefully bigger) fund, which can provide fee income and fresh capital to invest for the next five-plus years. Decisions like those are made easier by the proliferation of exit committees charged with moving assets out of the portfolio most opportunistically. Taking the decision away from the managing director who “owns” the deal tends to avoid the trap of missing opportunities while trying to squeeze every last dollar from every last deal.
Where the activity was
Strategic deals. Cash-rich corporate buyers looking to build scale and scope through acquisition continue to pace the market. Sales to these strategic buyers represented 2018’s most vibrant exit channel (see Figure 1.17). At a time when organic growth is hard to come by, corporations see real advantage in acquiring companies that have been pre-scrubbed during PE ownership. When The Stars Group bought Sky Betting & Gaming from CVC Capital Partners for $5 billion, for instance, the goal was to add sports betting to Stars’ dominant position in online poker. By the same token, Adobe hopes its $4.8 billion acquisition of Marketo from Vista Equity Partners will help accelerate expansion of its cloud-based marketing platform in the business-to-business space.
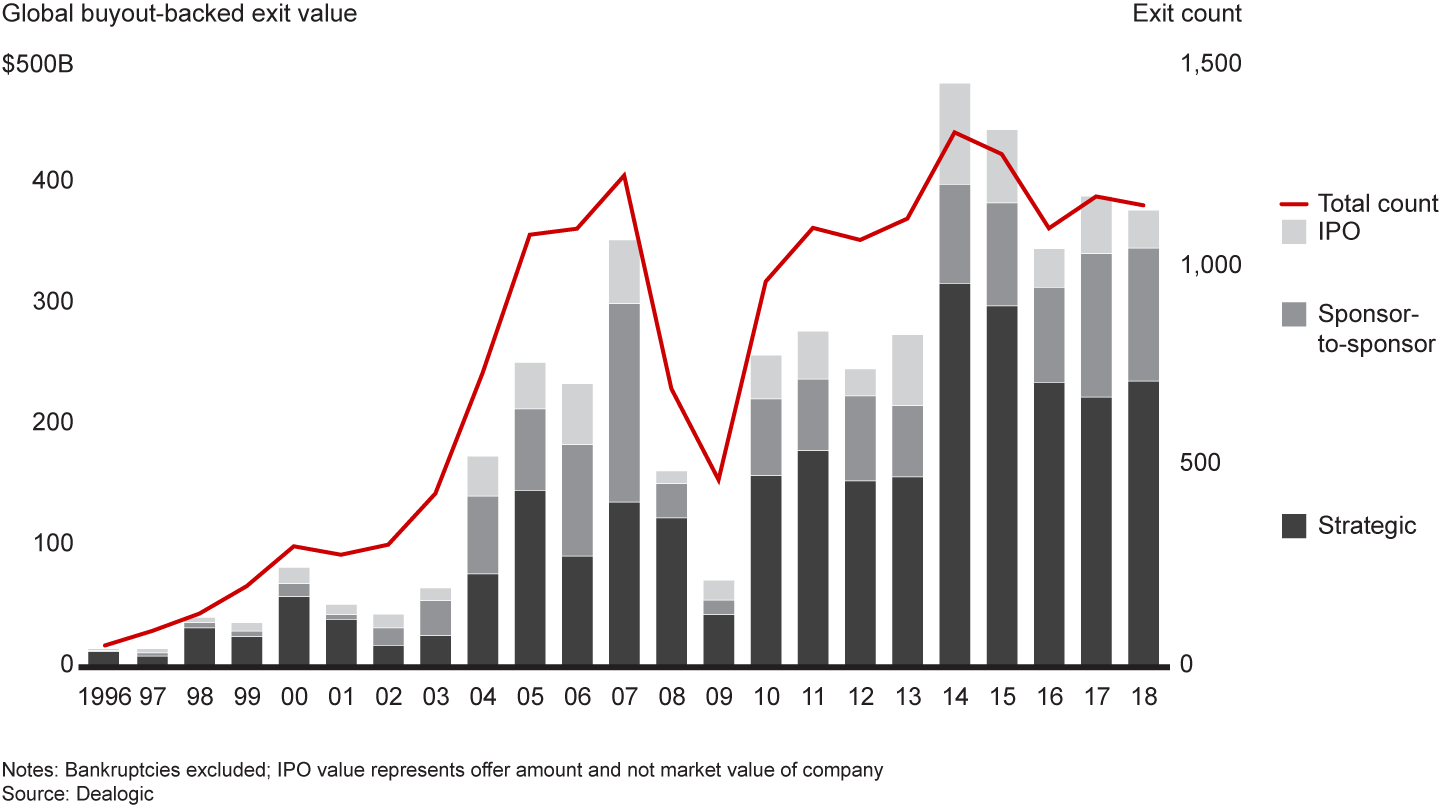

Sponsor-to-sponsor deals and IPOs. Sponsor-to-sponsor deals remained an important exit channel globally. While off slightly in terms of value, sponsor-to-sponsor exits turned in their third-strongest year ever for the industry in 2018. The value of IPOs, meanwhile, fell 34% globally as market uncertainty and higher volatility curtailed activity, especially in Europe and Asia-Pacific. As GPs grapple with an uncertain economic outlook, IPOs can be less attractive than onetime sales. Public offerings are essentially slow-motion exits, since mandated holding periods and market timing considerations force a firm to hold onto a large share of its investment for a period of years. That can allow a GP to continue to profit from the upside in good times, but if the economy falters, so might the value of the investment. It’s notable that, in December, CVC launched a bid to take private Sweden’s Ahlsell, a construction products company it had listed on the public markets only two years earlier. CVC still held a 25% stake in Ahlsell, but the company’s stock was trading below the IPO price. IPO data doesn’t account for follow-on sales—the sale of stakes left over from previous years’ IPOs—which have provided a significant source of liquidity in recent years. In 2018, however, increased volatility in the global equity markets suppressed follow-on activity, as GPs saw fewer chances to exit positions.
Dividend recapitalizations. Despite the upward trend in US interest rates, GPs have continued to take money off the table and de-risk investments by recapitalizing debt. Dividend recaps, in fact, have held up better than anyone expected. Tightening credit markets are starting to take a toll, however. Given the favorable debt environment of the past two or three years, it’s becoming harder to find a new credit agreement with better terms than the old one. In Europe, dividend recaps were down meaningfully from a spike in 2017, crowded out by demand for loans from the broader M&A market.
Partial exits. Last year, we talked about the increasing popularity of partial exits, deals in which a firm sells part of a portfolio company but holds onto the rest. Despite the seller’s market for assets described earlier, the trend continued in 2018. Given how hard it is to find deals and redeploy capital, GPs are increasingly reluctant to sell a company they believe has more room to run. Faced with the traditional three- to five-year timeline for buying and selling assets, a firm may feel the need to sell a partial stake to lock in gains or return capital to investors. Occasionally, the goal is to pass the asset from one fund to another, and selling a stake establishes the necessary arm’s-length valuation. In any of those cases, though, retaining a position keeps the firm involved in the company’s upside, often as majority shareholder.
That was the strategy when Carlyle and Paris-based Montefiore Investment sold a 40% stake in European Camping Group (ECG) to the Ontario Teachers’ Pension Plan in April 2018. The PE owners had spent several years assembling ECG through a buy-and-build strategy and had faith that more time would allow them to unlock additional value. Selling a minority stake to a patient, long-term investor like Ontario Teachers’ monetized a significant portion of the investment. It also allowed Carlyle and Montefiore to retain majority control over ECG’s future. Following a similar logic, Hellman & Friedman sold a partial stake in insurance brokerage Hub International to Altas Partners in October 2018. After the minority investment, H&F remained Hub’s largest shareholder. Altas, a Toronto-based fund manager with a long-term orientation, said it plans to support the current strategy and management, which also invested in the deal. Selling a partial stake obviously doesn’t make sense for all assets. But when a portfolio company’s potential extends well beyond the five-year timeline, more firms are taking steps to ensure they aren’t bailing out too soon.

Get Our Latest Private Equity Insights
Receive Bain’s landmark Global Private Equity Report each February, plus the latest insights and developments in private equity throughout the year.
• • •
Fund-raising: The capital continues to flow
By historical standards, PE funds attracted an impressive amount of capital in 2018, although the pace slackened from 2017’s record-breaking performance. GPs raised $714 billion from investors during the year—the third-largest amount on record—bringing the total since 2014 to $3.7 trillion (see Figure 1.18).
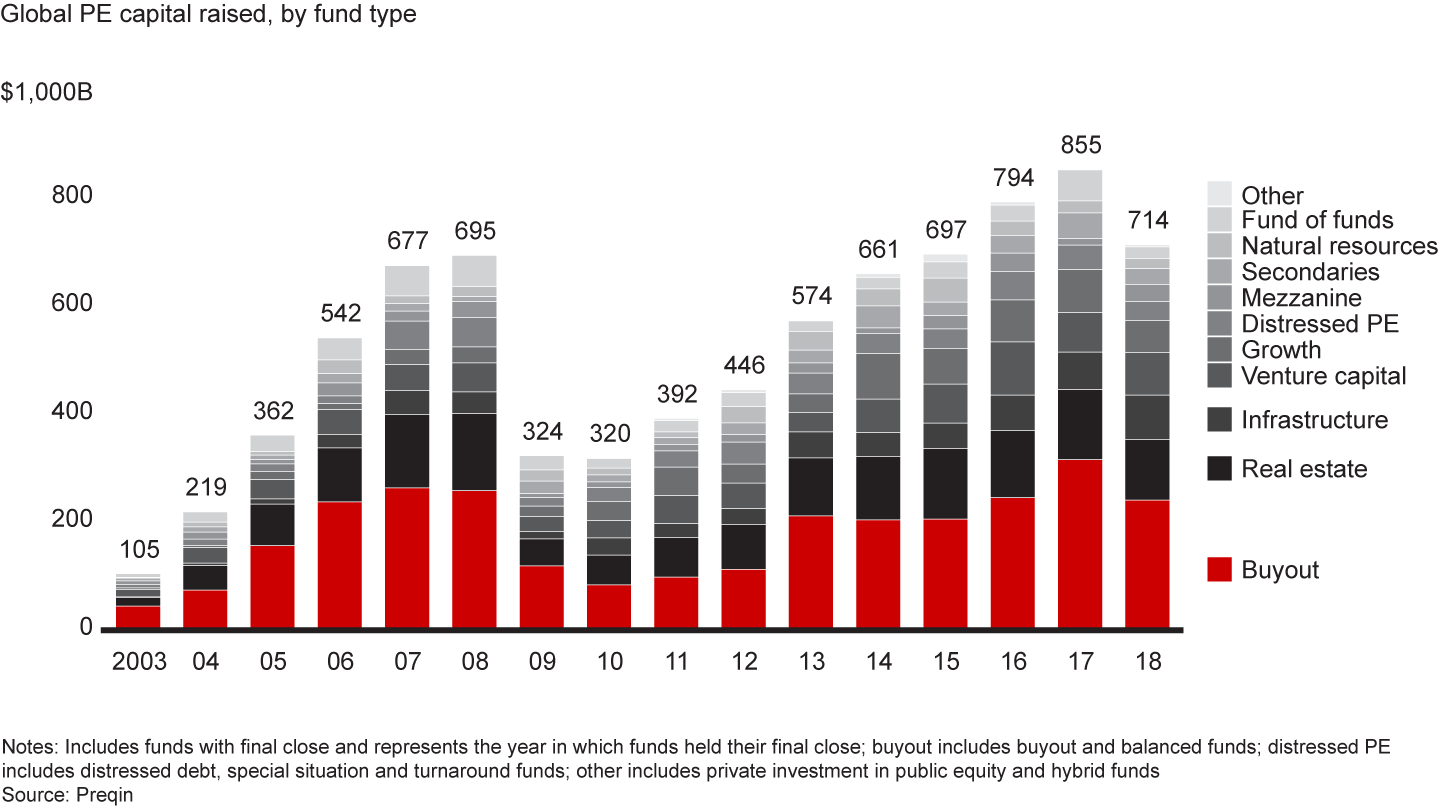

Buyout funds continued to draw the biggest share of capital, but investor interest during this record stretch has been broad and deep, benefiting all variety of funds.
The fund-raising peak in 2017 owed much to the closing of several of the largest buyout funds ever—the top three funds alone collected a staggering $57 billion in capital. Last year’s megafunds weren’t quite that big, but it would be hard to describe them as anything but massive. Carlyle Partners VII led the pack with $18.5 billion, followed closely by Hellman & Friedman Capital Partners IX with $16.0 billion and EQT VIII with $13.2 billion. Investors surveyed by Probitas Partners insisted they are turning their attention to smaller US buyout funds, US growth equity funds and European funds. Yet the strong performance by trusted managers continues to attract large flows of capital to megafunds, those raising $5 billion or more. Indeed, 2019 started off with a bang when Thoma Bravo closed its latest flagship fund at $12.6 billion, a big leap from the $7.6 billion it had raised for its previous flagship.
Emerging markets and the Asia-Pacific region were global fund-raising’s lone soft spots last year. Investors looking for diversification continue to be drawn to Asia-Pacific’s relatively strong long-term growth profile. But Greater China saw a massive decline in RMB fund-raising amid the central government’s decision to tighten rules on PE investment, part of an effort to rein in debt and reduce financial risk. Only 14% of funds raised globally in 2018 were focused on the Asia-Pacific region, down from 23% the year before.
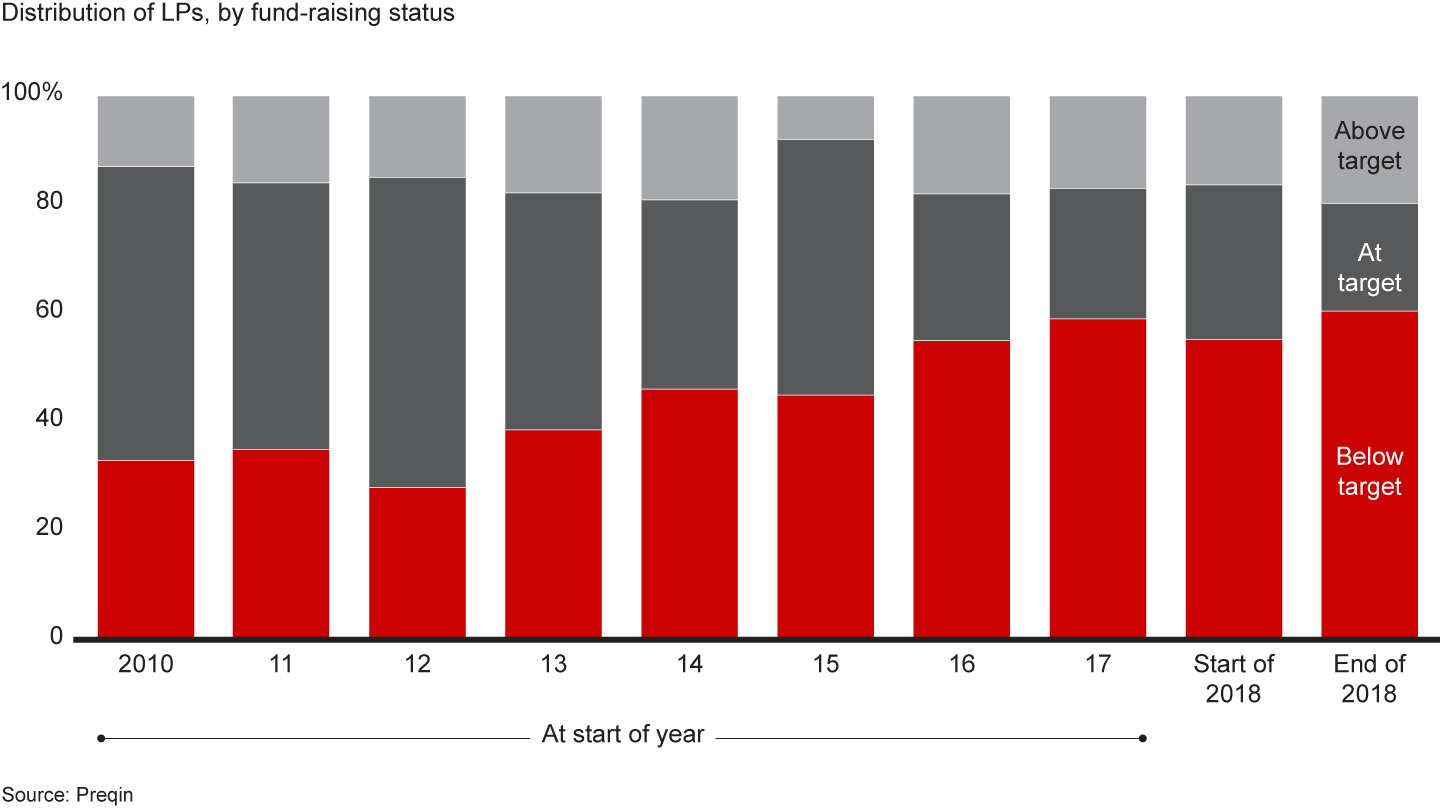
Overall, though, investor enthusiasm for private equity remains vibrant, and it’s easy to understand why. As we noted earlier, LPs have been cash flow positive on their PE positions for the past eight years. The asset class has outperformed others historically, and market analysts are almost unanimous in their opinion that private equity’s track record will continue. For LPs, the major challenge is keeping up with their gains. More than 90% of those surveyed by Preqin said they want to maintain or increase their capital contributions to private equity in coming years, and intend to maintain or increase their percentage allocations. Yet because distributions have been so robust and competition for new allocations is fierce, LPs have been unable to recycle gains fast enough to maintain their targets (see Figure 1.19).
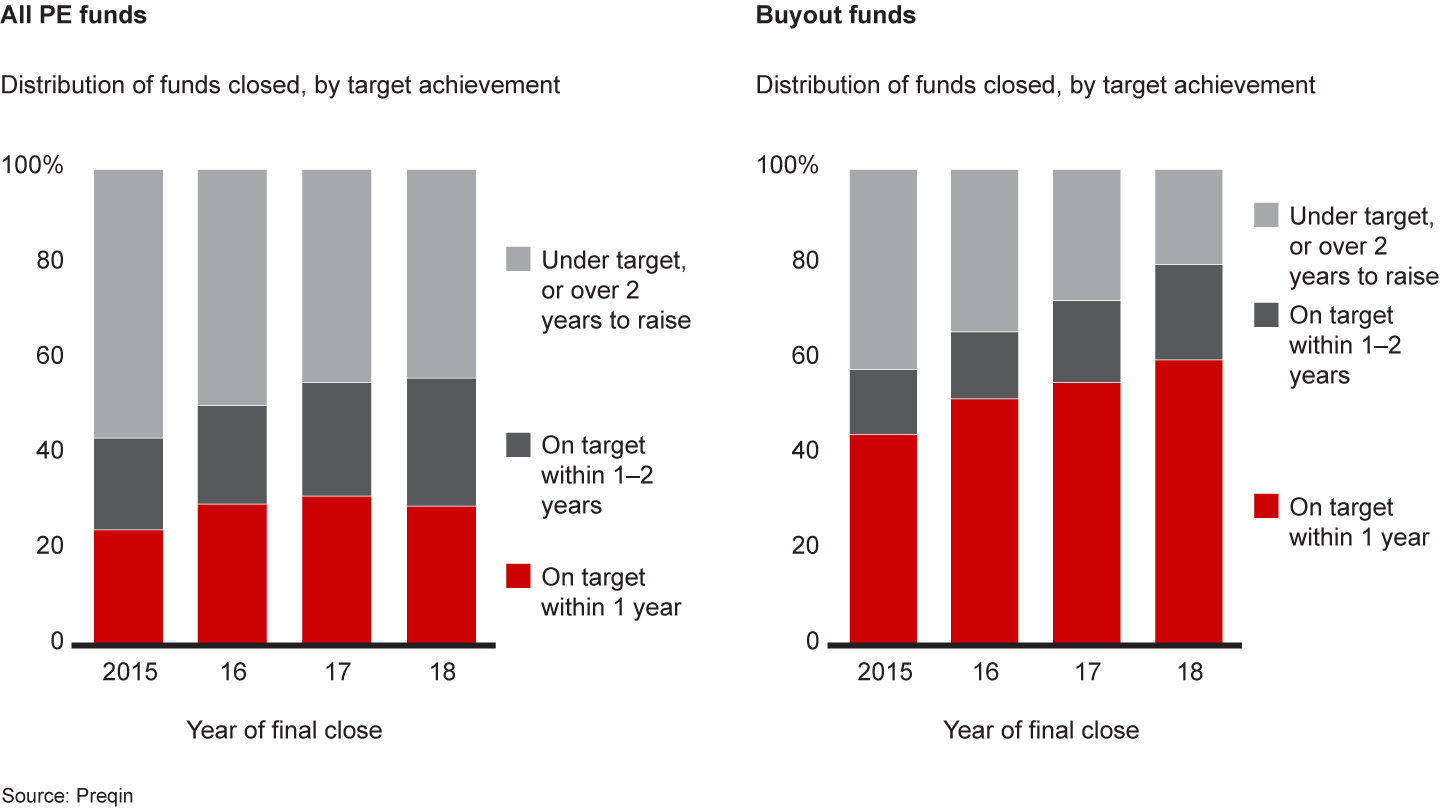
Strong investor demand led to continued success on the fund-raising trail. Although the total number of PE funds closed during the year dropped in 2018, 56% of those seeking capital reached their goals (or were oversubscribed) within two years. For buyout funds, the pace was even faster—60% reached their goals within a year (see Figure 1.20). The average time on the road for all PE funds stayed the same at 16 months. Buyout funds are getting to close within 12 months on average.


Moving beyond the core
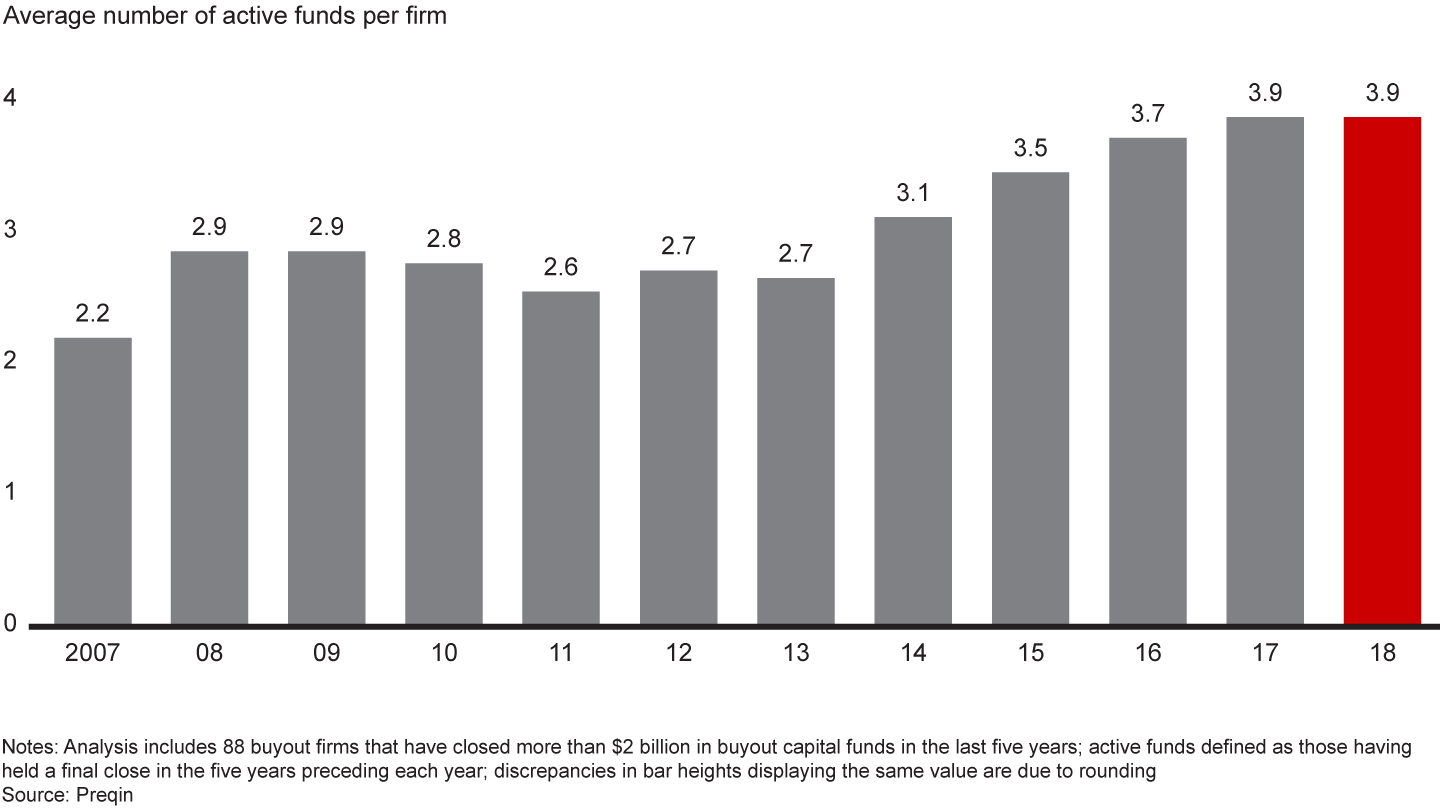
Because LPs are constantly looking for new ways to invest with the firms they favor, GPs are expanding their menu of offerings. The number of funds per firm has increased steadily since the beginning of the current cycle, as GPs take careful steps to stretch beyond their core (see Figure 1.21). While these menu expansions typically depend on where the firm thinks it can best take advantage of its unique capabilities, we’ve seen heavy activity in three areas: sector-focused pools of capital, growth equity funds and long-duration funds. (For more on adjacency expansion, see “Private Equity’s New Take on Diversification: Don’t Stray Too Far.”)

The number of sector-focused funds in the market has grown sharply since the economy began its climb out of the global financial crisis in 2010. GPs have also raised pools of capital dedicated to specific sectors that can fly under the radar, such as sidecar funds or sleeves within funds. Specialization has become increasingly attractive as the market for deals has gotten more competitive. Specialized funds allow a GP and its investors to double down on areas in which the firm has deep expertise, strong conviction about assets and an extensive network that can surface attractive targets.
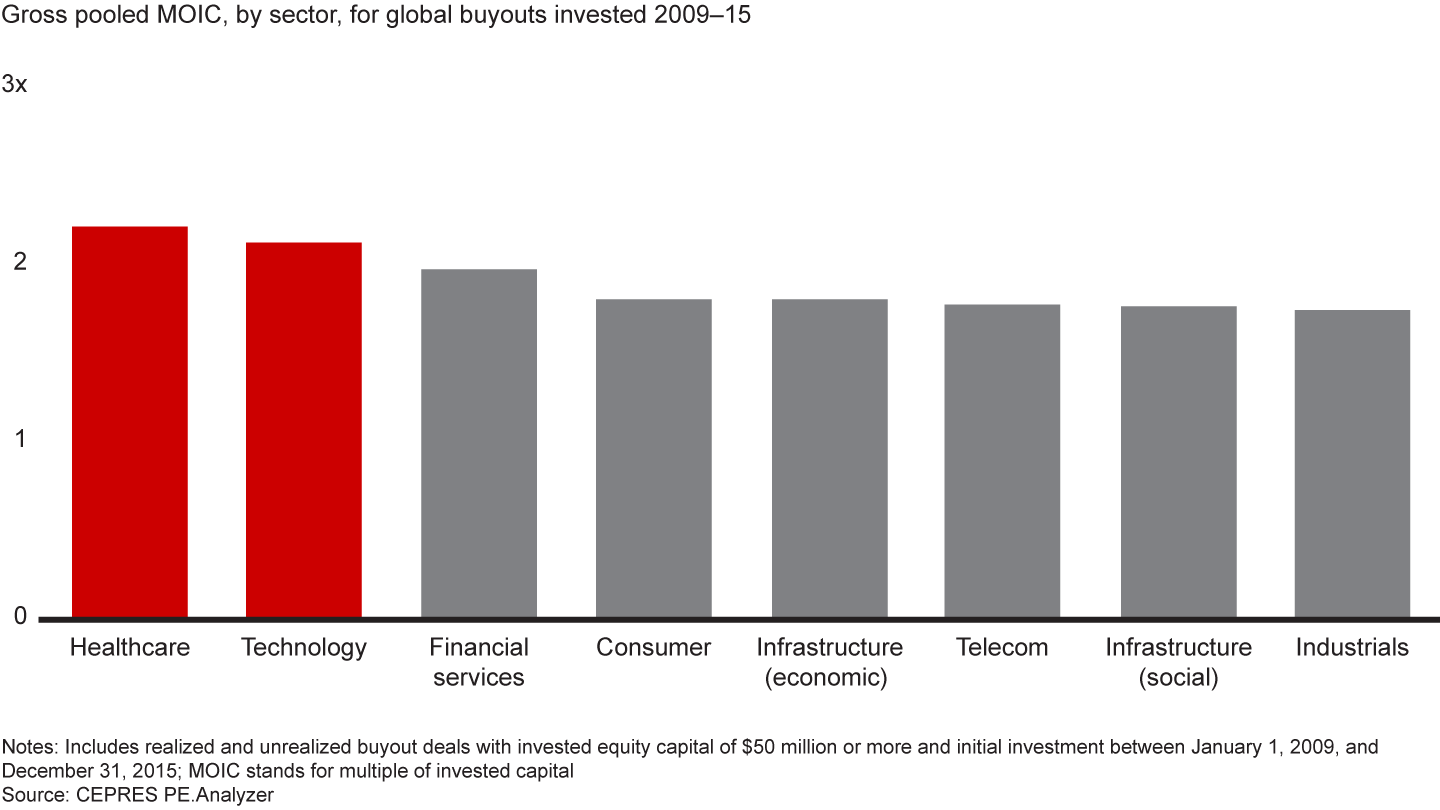
About half of the sector-specific funds on the market are dedicated to healthcare and technology investments. The superior growth characteristics of these two broad sectors have attracted PE investors for years, but they’ve become even more popular among LPs at a time when fears of an economic downturn are prompting investors to look for cover. Healthcare and technology offer the holy trinity of strong growth, recession resistance and superior historical returns. In the current cycle, healthcare deals have returned $2.2 for every $1 of invested capital on a gross pooled basis, while technology deals have returned $2.1, according to CEPRES. Those multiples outshine valuations in every other sector (see Figure 1.22).

GPs catered to the high level of investor demand by launching a number of large sector-specific funds in 2018, including Thoma Bravo’s $2.4 billion Discover Fund II, focused on technology, and Linden Capital Partners’ $1.5 billion Fund IV, dedicated to healthcare. Healthcare and technology investments also figure prominently in another vibrant area for fund-raising—growth equity funds. Since 2014, GPs have raised $367 billion for these funds, which invest in companies that lie between venture-backed firms and traditional buyout targets in terms of business maturity. (For more, see “Growth Equity: A Risk/Return Profile That’s Hard to Ignore.”)
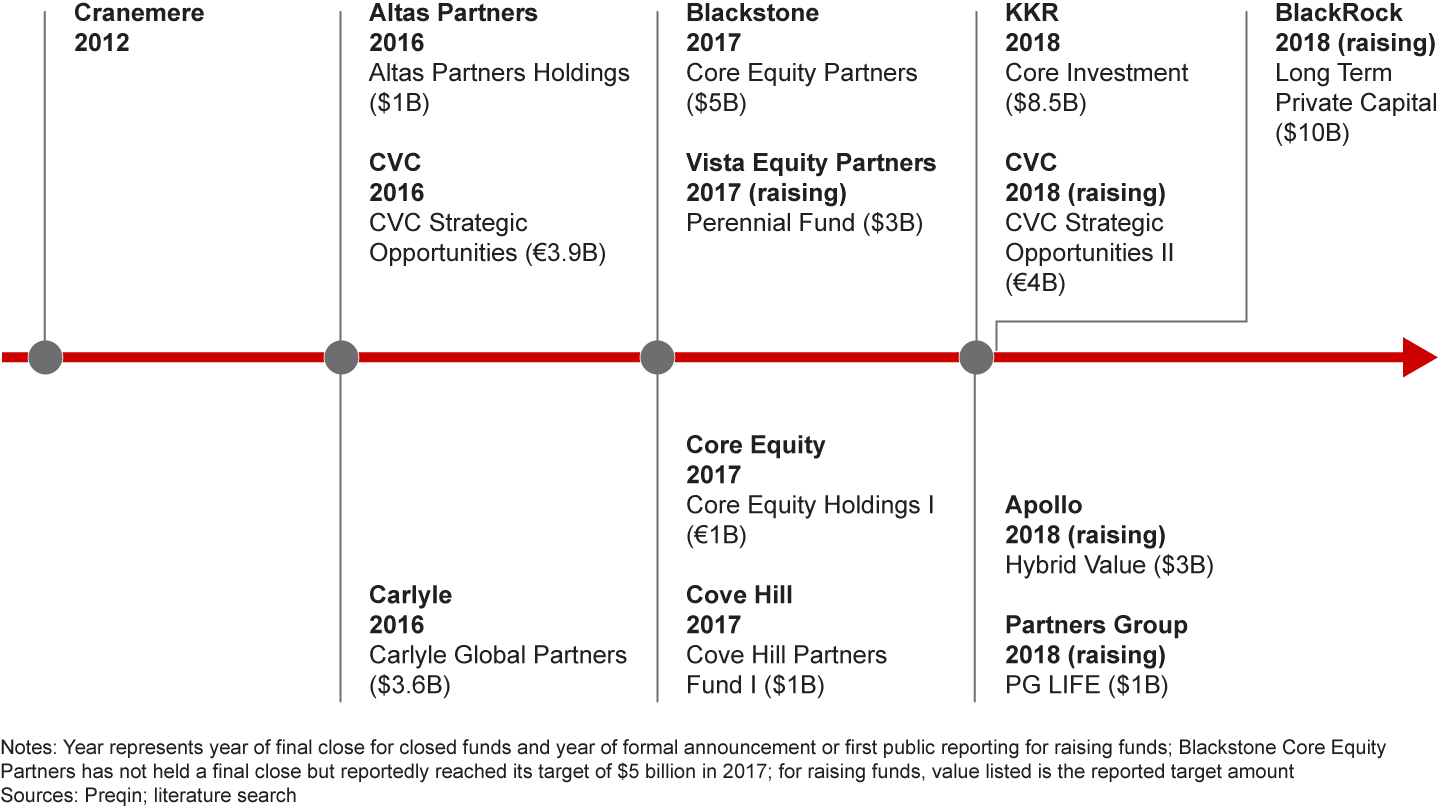
As we discussed in last year’s report, longer-duration funds are another way that PE firms are broadening their offerings. With attractive new targets harder and harder to find, more GPs are seeing the value of holding onto high-quality companies for as long as they keep generating value. Traditional buyout firms, of course, typically aim to acquire companies and sell them within three to five years. Not all assets, however, have reached their full potential within that time frame. Many are held by a succession of PE owners over a 15- or 20-year period, generating value all along the way. For the original owner, that amounts to leaving money on the table.
Consequently, GPs are launching funds with longer investment time frames, a trend that accelerated in 2018 with large long-duration funds from firms like KKR, Partners Group and CVC (see Figure 1.23). This corner of the PE universe is still relatively small and untested. But it is growing steadily as investors come to appreciate its virtues—lower transaction costs, advantaged tax treatment, more flexibility to sell when the time is right, and capital that is fully invested over longer periods.


GP Equity Stakes: Will the Bonanza Continue?
Succession planning is emerging as a key consideration.
Returns: Despite a drop, PE still outperforms
If private equity has demonstrated anything over the past several years, it’s that the asset class produces steadier, more reliable returns than public equities. After a period of heavy stock market volatility around the world, buyout funds have continued to outperform public equity markets in all major regions, over both short and long time horizons.
Consider how wildly public equity valuations have swung in recent years. In 2016, European stock markets tanked on the Brexit vote, while Asian markets declined due to a correction of the bubble in China’s stock market. In 2017, markets turned around as a synchronized global economic expansion resulted in gains across regions. In 2018, European public market performance was anemic, while Asia was weighed down by trade tensions and slowing growth in China. In the US, a torrid, multiyear bull run came to an abrupt halt at the end of 2018 as an array of concerns began to spook investors.
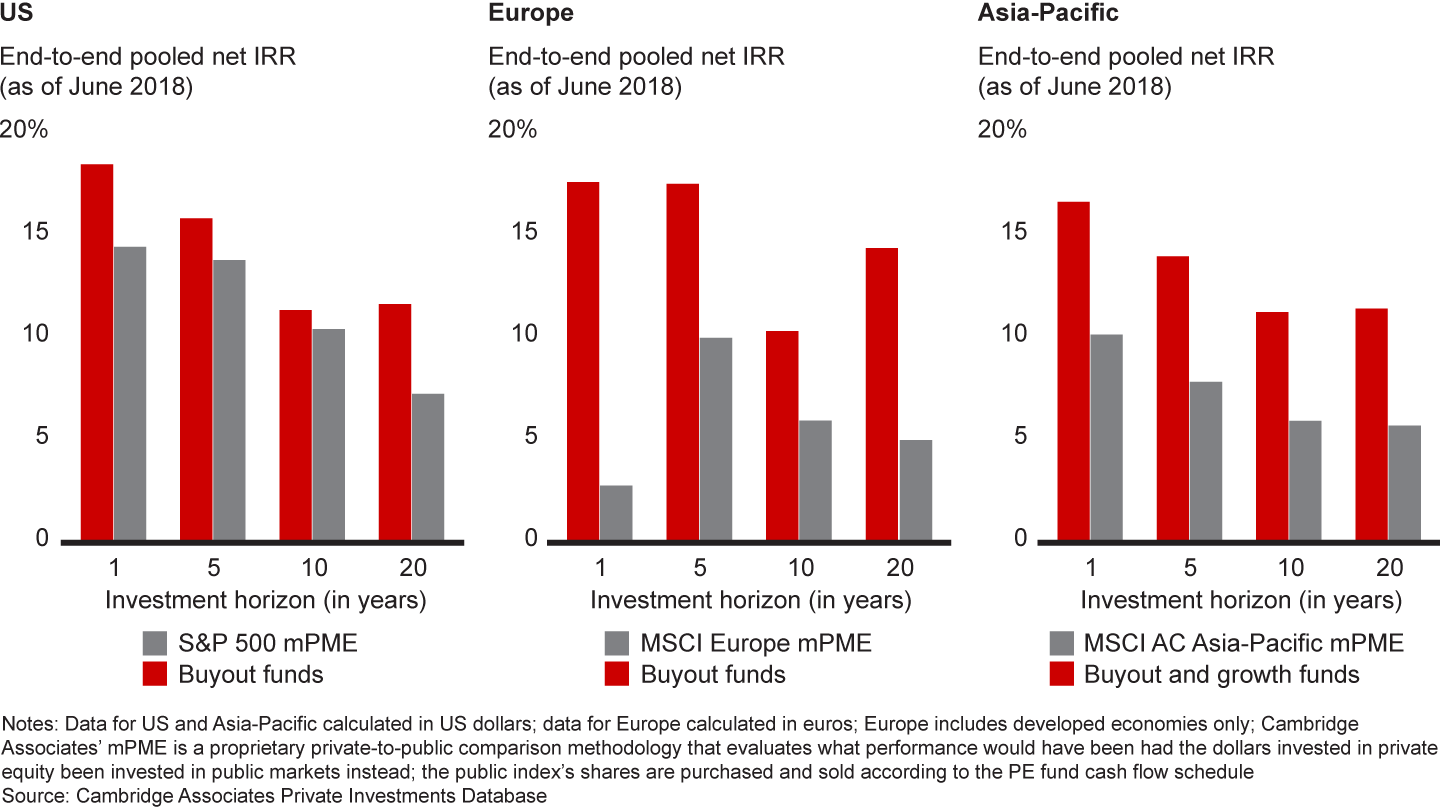
Private equity, meanwhile, kept outperforming. Using the modified public market equivalent (mPME) metric developed by Cambridge Associates, which replicates the timing and size of PE cash flows as if they had been invested in public equities, it is possible to make an apples-to-apples comparison of PE returns with public equity returns. By this measure, which looks at end-to-end pooled net IRR, buyout funds outperformed the public markets across all regions for a variety of periods ending June 2018, the most recent data available from Cambridge Associates (see Figure 1.27).

At the same time, it’s important to highlight another fundamental trend: While private equity is still beating the public markets, buyout returns in the current cycle are not as robust as they were in the cycle before the global financial crisis. Using CEPRES data, we examined buyout deal-level returns as measured by the gross pooled multiple of invested capital (MOIC). Returns for deals done after the financial crisis are down, on average, compared with precrisis investments (see Figure 1.28). The PE industry has matured and become more competitive, with many more participants and massive amounts of capital vying for a limited set of deals. The outsize returns that GPs once could earn on a large pool of undervalued assets are harder to find today.
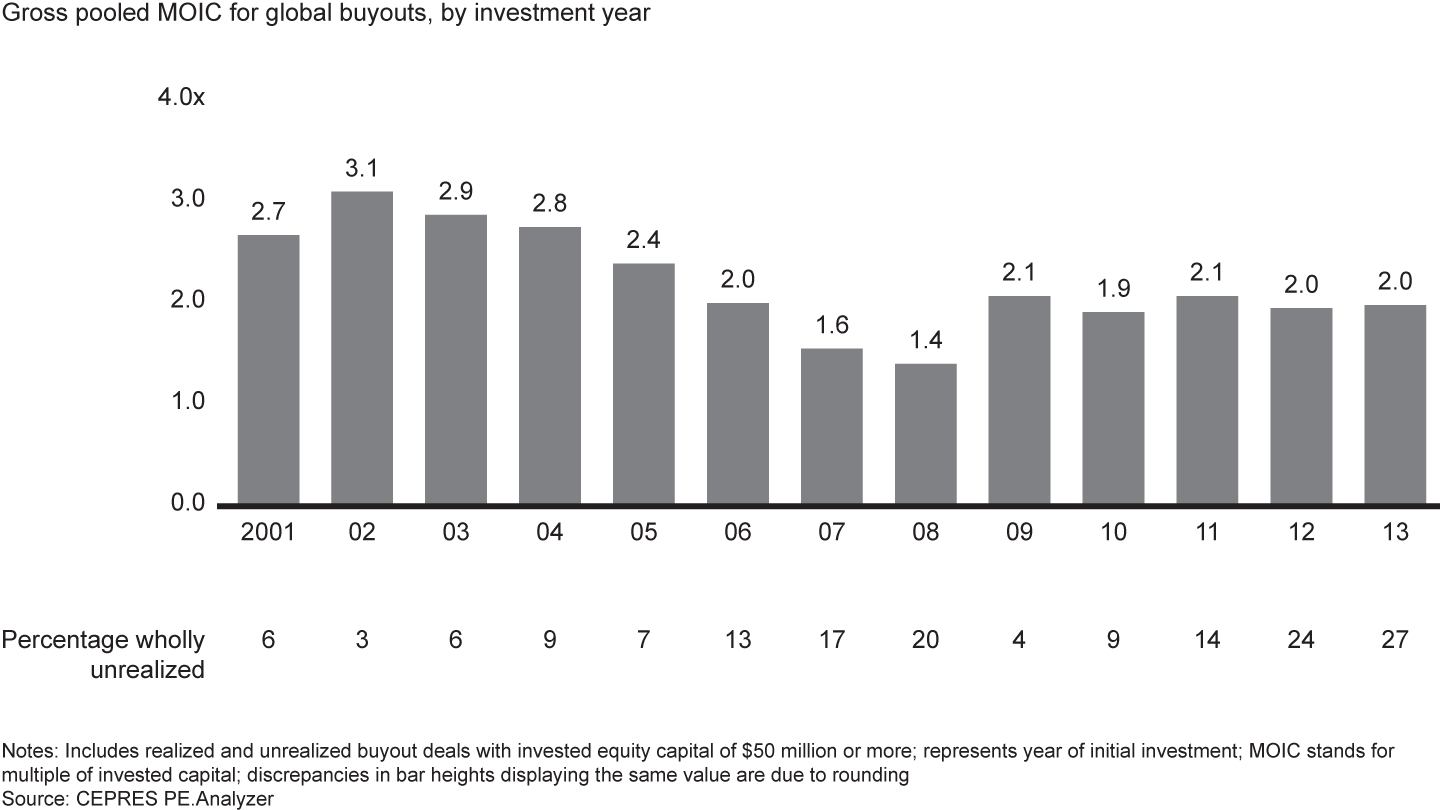

Why is this decline less evident when looking at net IRR? The effect is masked by several factors. First, PE funds have taken advantage of low interest rates in this cycle and increasingly used lines of credit, which pushes back the timing of investment. Second, advantageous credit markets also enabled the liberal use of dividend recaps to cash out early in the deal life cycle. Third, after the financial crisis, LPs negotiated more favorable terms for fees and carry, which pushed up net returns.
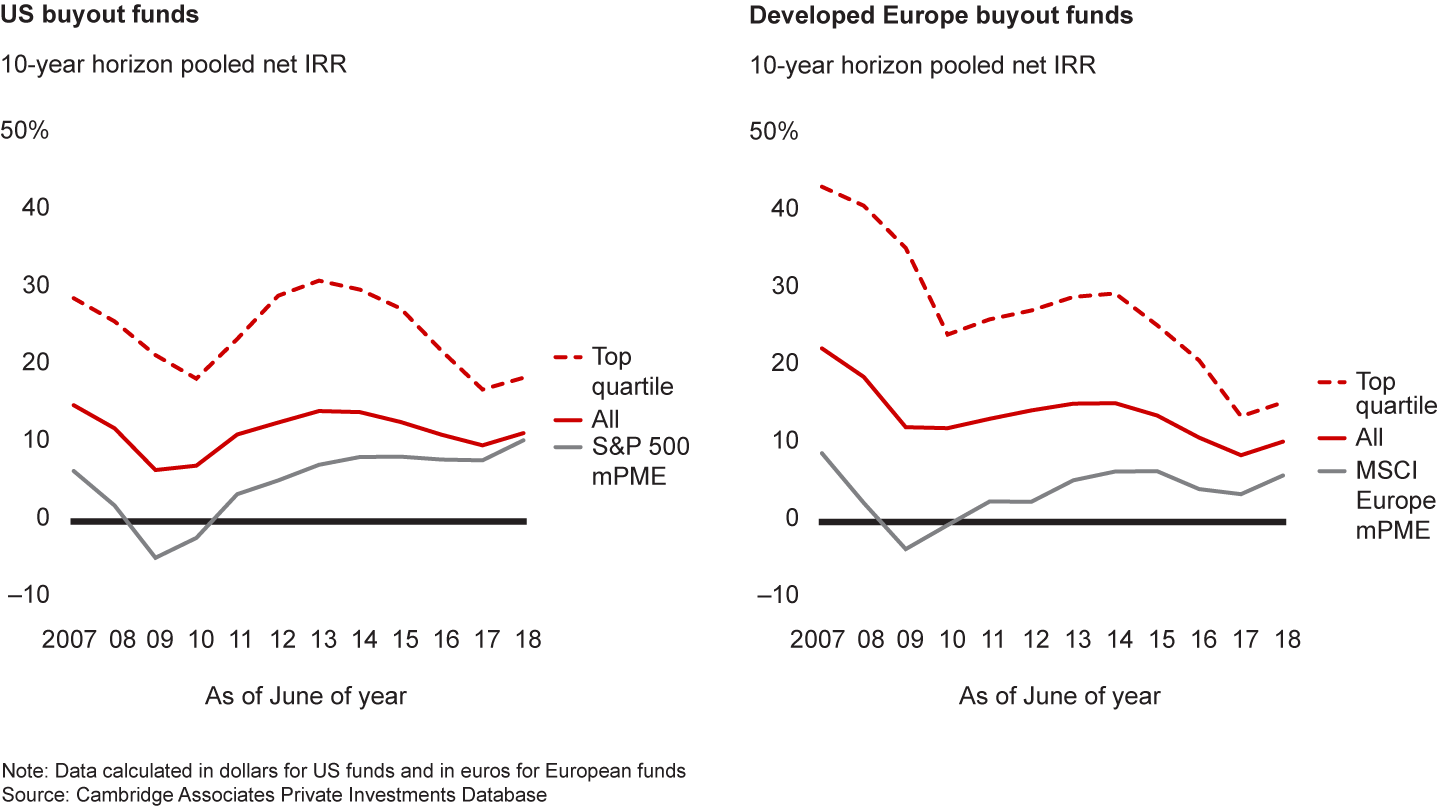
While average industry returns have declined, it is important to recognize that top-performing funds still exceed the average by a relatively wide margin (see Figure 1.29). Moreover, private equity has demonstrated an unusual persistence of performance, as measured by the likelihood of successor funds to deliver the same quartile of performance as their predecessors. LPs can trust that a PE firm that excels with its first fund has a greater chance of replicating that success with the next fund. For GPs that have managed a top-quartile fund, there’s a better than 6-in-10 probability that their successor fund will also be an above-average performer. A case in point is Hellman & Friedman, which since 1995 has had five consecutive funds that rank in the first quartile of IRR performance.
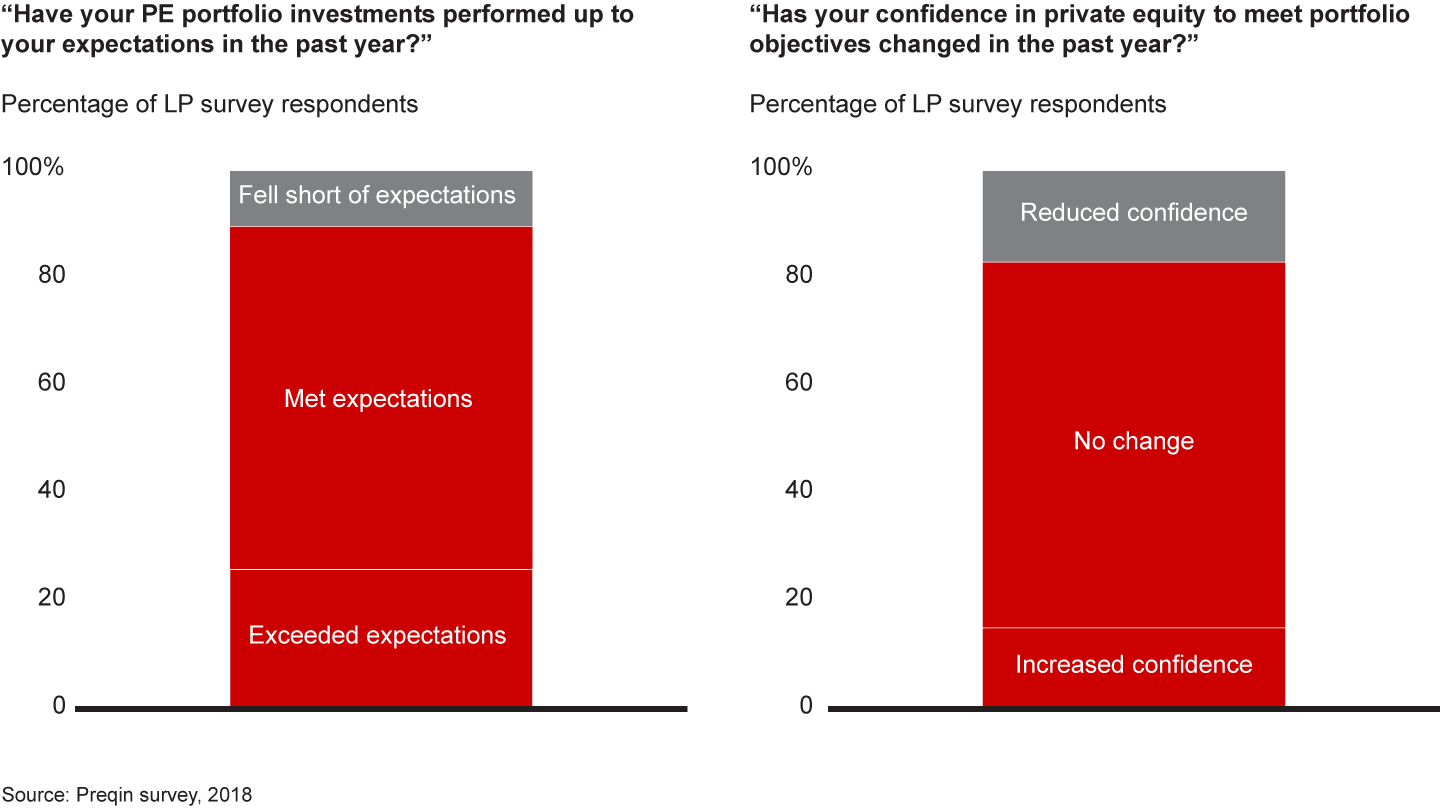
Looking ahead to the likelihood of more volatility in public markets, investors remain focused on the relative outperformance of private equity. In a recent global survey of LPs by Preqin, 90% of respondents said that their PE investments met or exceeded their expectations over the past year. And 83% said that their confidence in fund performance has either not changed or increased (see Figure 1.30). Through economic thick and thin, private equity has delivered remarkably stable returns.


Key takeaways
- PE funds produced another impressive surge in investment value in 2018, capping the strongest five-year stretch in the industry’s history. Fierce competition and rising asset prices continued to constrain deal count—the number of individual transactions dropped by 13%, to 2,936 worldwide—but total buyout value jumped 10% to $582 billion (including add-on deals). The performance owed much to an upswing in public-to-private transactions. Globally, P2P deals reached their highest value since the previous take-private boom in 2006–07.
- Despite the steady pace of investment, PE dry powder has been on the rise since 2012 and hit a record high of $2 trillion at year-end 2018 across all fund types ($695 billion for buyouts alone). The buildup of excess capital is putting pressure on PE firms to find deals, but the good news is that buyout firms hold 67% of their dry powder in funds raised over the last two years. That means the recent deal cycle is clearing out the older capital and replacing it with new.
- The stiff competition and high multiples that made it challenging to find deals in 2018 also made it a great time to exit. With 1,146 transactions valued at $378 billion, exit activity came in a smidgen lower than in 2017, but the total was still a strong contributor to a historic five-year stretch that has produced unprecedented distributions for investors. There was clearly some urgency on the part of GPs to sell assets, as signs of economic weakness pile up. The median holding period for buyouts fell last year to 4.5 years, after edging down slowly from a peak of 5.9 years in 2014.
- PE funds continued to attract an impressive amount of capital in 2018, although the pace fell off from 2017’s record-breaking performance. GPs raised $714 billion from investors during the year—the third-largest amount ever—bringing the total since 2014 to $3.7 trillion. LPs remain committed to what has been their best-performing asset class. A full 90% say they intend to maintain or increase their PE allocations.
- After several years of heavy stock market volatility around the world, buyout funds continued to outperform public equity markets in all major regions, over both short and long time horizons. At the same time, buyout returns in the current cycle have not been as robust as they were in the previous cycle. As the overall PE industry has matured and become more competitive, the outsize returns that GPs could once earn on a large pool of undervalued assets are harder to find. Yet, top-performing funds still exceed the industry average by a relatively wide margin.
This article is part of Bain’s 2019 Global Private Equity Report. Explore the contents of the report here or download the PDF to read the full report.