Report
 }
}
Written in collaboration with
Written in collaboration with

Executive summary
This is the 13th consecutive year we have tracked the shopping behaviors of Chinese consumers. Our continuing research has given us a valuable, long-term view across 106 fast-moving consumer goods (FMCG) categories purchased for home consumption in China.1 As in each of the past 12 years, we analyzed the 26 key categories spanning the four largest consumer goods sectors: packaged food, beverage, personal care, and home care.2 This year, we updated our tracking to include nutrient supplements, coffee, and sanitary pads and eliminated toothbrushes and fabric softener, bringing our tracked categories total to 27, to align more closely with evolving market dynamics.3 This report updates the findings from our China Shopper Report 2023, Vol. 2, Charting a resilient path: Navigating uncertainty and building momentum, and includes Kantar Worldpanel shopper behavior data for 2023 and the first quarter of 2024.
This report recaps FMCG performance in 2023, a period when consumption regained momentum following the lifting of remaining Covid-19 restrictions. We also explore consumer trends shaping the FMCG market during the first quarter of 2024. Building on the analyses presented in China Shopper Report 2018, Vol. 2, and China Shopper Report 2021, Vol. 2, we review the performance of insurgent brands from the Class of 2018 and Class of 2021 and select representative brands to feature in the Class of 2024. The report includes implications for consumer goods companies and retailers.
Reflection on 2023
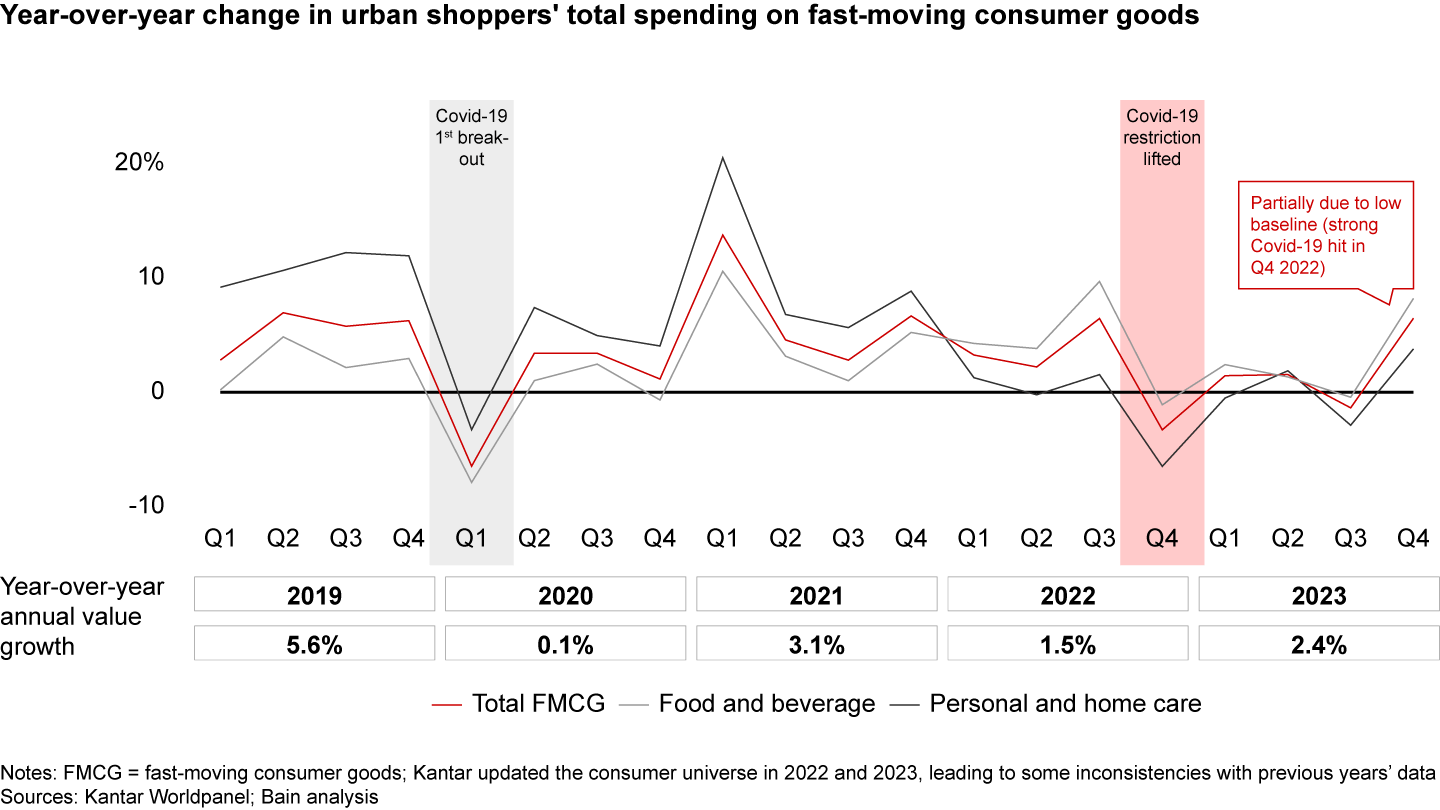
In 2023, China’s fast-moving consumer goods (FMCG) market experienced its first full year of operations following the lifting of Covid-19 restrictions in December 2022. Despite a promising start, the year fell short of consumer confidence and consumption expectations. The FMCG market witnessed a moderate recovery in the first three quarters of 2023 and a notable surge of 6.5% in Q4, resulting in 2.4% annual growth. The strong recovery in Q4 can be partially attributed to the low baseline in the same period of the previous year (Q4 2022). However, the FMCG market’s lagging growth compared to GDP growth (5.2%) and total retail market growth (7.2%, excluding catering) can be partially attributed to increasing out-of-home consumption post-Covid.
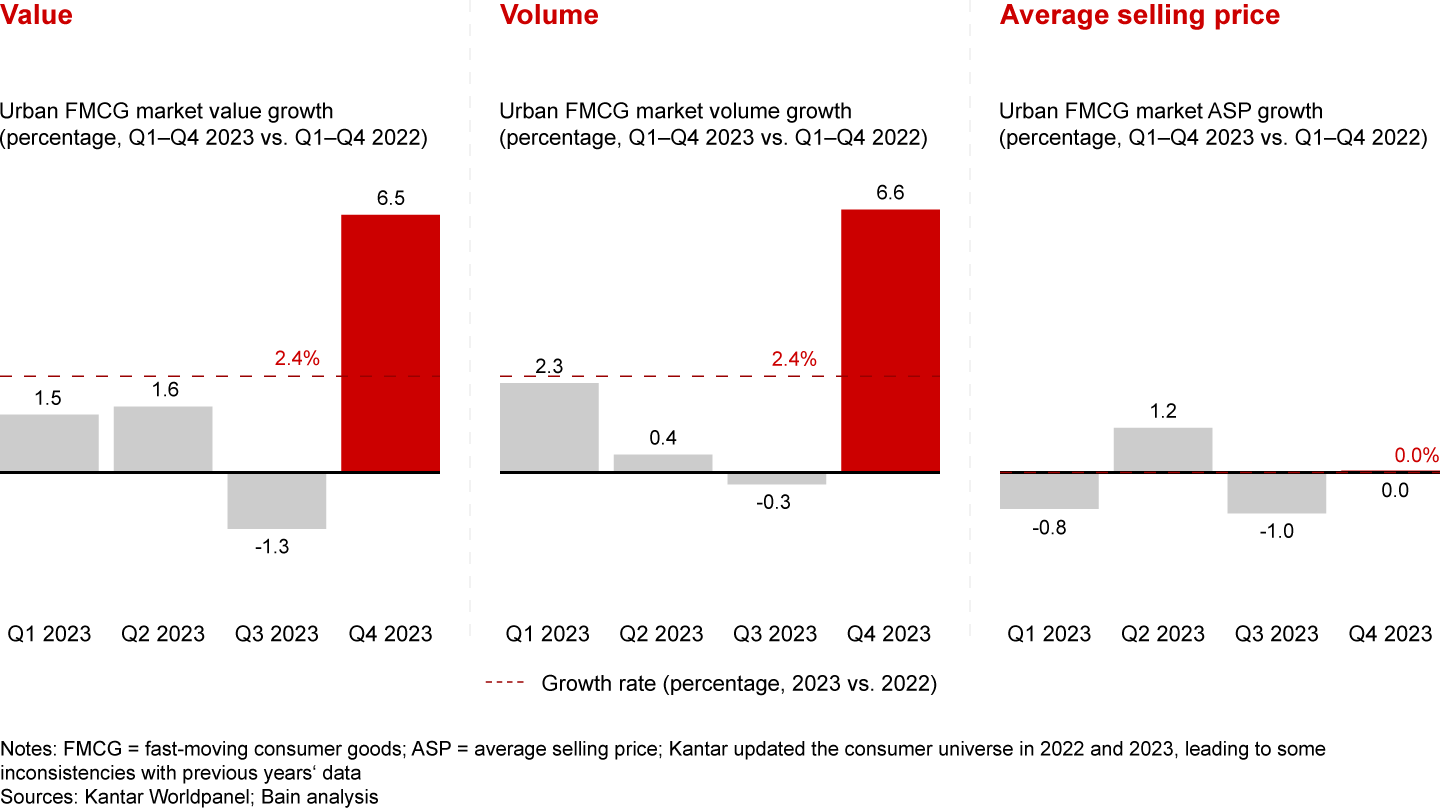
Volume continued to be the main driver of growth, posting an increase of +2.4% for the year. Average selling prices (ASPs) remained relatively stable throughout the year, landing at 0.0%, indicating that price changes had a minimal impact on the market’s overall performance. This pricing trend is positive compared to 2022, which recorded a -2.5% decline in ASP.
Nevertheless, we observed divergent pricing trends across categories due to supply and demand dynamics. Categories such as juice, facial tissue, and toothpaste experienced notable innovation and capitalized on a “trade up” trend, meeting consumers’ increasing demand for health, wellness, and affordability. On the other hand, some categories saw innovation and consumers are moving to better products. However, there is severe price competition, and partial consumers are moving to lower-ASP segments, leading to a “K-shape” trend in these categories, such as fabric detergent. Meanwhile, categories such as skincare and makeup, with limited innovation and intense competition, saw consumers selecting more value-for-money options, representing a “trade down” trend.
Geographically, growth was led by Tier 2 cities across all city tiers, in terms of volume and ASPs.4 These cities have become destinations for population migration and test fields for FMCG brands. Tier 2 cities have received a population influx of 8 million or more in the past four years. For example, Changsha has seen a population increase of 1.2 million (+13%), outgrowing other cities in Hunan. These cities have become the launchpads for the transformation pilots and initiatives of multinational corporations and the birthplace of insurgent FMCG brands.
Category update: Home care led FMCG growth, followed by packaged food and beverage
Within the four major sectors, home care led FMCG market growth (+8.3%), followed by packaged food (+3.4%) and beverage (+3.2%), while personal care saw a narrowed decline (-2.1%, compared to -4.8% in 2022).
Home care delivered healthy market growth of +8.3%, driven by a strong volume rebound of +7.4% and stable ASP at +0.9%, though ASP decelerated in Q1–Q3 and showed deflation in Q4. The rising demand for health and hygiene needs supported this volume growth. Fabric detergent experienced a growth of +5.5%, primarily due to increased engagement in out-of-home activities. Additionally, facial tissue saw significant growth, with volume increasing by +17.2% and ASP by +4.2%, driven by occasion-specific consumption such as baby facial tissue and face towels. Kitchen cleaner also saw a substantial volume growth of +6.6%, driven by specific uses, such as oil remover and dishwasher detergent.
Packaged food delivered robust market growth of +3.4%. Volume dropped (-1.5%), partially due to increasing on-premises consumption post-Covid-19, while the premiumization trend accelerated (+5.0% ASP vs. +3.2% in 2022). Nutrient supplements, a new addition to our tracked categories, led growth with a notable +20.5% increase. This expansion was primarily driven by a strong volume increase of 29.6%, reflecting rising consumer demand for health-related products, though this was offset by a 7% decline in ASP due to the influx of local brands entering the segment. Infant formula was negatively impacted by demographic changes, posting a -15.3% value decline. Other categories generally saw a decline in volume, attributed to increased out-of-home consumption. However, a trend toward premiumization was evident across these categories. Consumers were willing to pay more for healthier and higher-quality food options, such as low-sugar chocolate and candy containing ingredients with beauty benefits.
Beverage experienced +3.2% market growth, driven by strong volume growth (+3.3%) and stable ASP (-0.1%). This sector saw stable consumption in Q1–Q3. However, Q4 witnessed a strong rebound, primarily due to a relatively low base in Q4 2022. The latest trend in beverage is near-water drinks (近水化), with consumers moving from high-sugar drinks (e.g., normal carbonated soft drinks [CSD]) to low-/no-sugar options (e.g., zero-sugar tea). As a result, juice (+24.1%), packaged water (+8.9%), and ready-to-drink (RTD) tea (+14.1%) led market growth. As consumers’ beverage demand shifted toward healthier options, CSD saw a significant decline (-7.3%). Beer prices trended upward (ASP +4.2%) as most leading brands continued their focus on premium product lines. Yogurt, meanwhile, reported a declining value of -8.5%. This year we added coffee to our tracked categories, in recognition of its strong growth and increasing consumer impact over the past 10 years. Coffee saw a value growth of +5.6%, driven by both volume and ASP.
The decline of personal care narrowed (-2.1% vs. -4.8% in 2022). However, we observed recovering volume demand (+1.3%), despite ASP deflation (-3.4%) throughout the year. Some categories experienced growth due to increasing out-of-home activities. For example, makeup (+6.4%), shampoo (+3.2%), and hair conditioner (+4.6%) all showed strong volume rebounds. However, this sector faces significant challenges from domestic brands and a lack of product differentiation, leading to an ASP decline in most categories. For some categories, such as skincare (-3.1%) and personal wash (-2.2%), declining ASP drove overall value down despite stable volume demand. Sanitary pads, a new addition to our tracked categories, experienced a slight decline of -2.3%, primarily driven by a decrease in volume (-4.0%) as consumers shifted toward competing products such as tampons and menstrual cups.
The two-speed phenomenon—split between high-speed and low-speed categories—continued in 2023.
The fastest-growing categories were mainly driven by health and emotional needs. Within these high-speed categories, there was an increased demand for health-related and hygiene products such as functional drinks (+23%) and air fresheners (+22%). Consumers also illustrated a willingness to pay a premium for entertainment and emotion-driven products such as foreign spirits (+29%).
On the other hand, low-speed categories were primarily concentrated in packaged food and beverage sectors, such as cheese (-17%) and yogurt (-8%). These categories were negatively impacted by changing consumption habits, with a marked decrease in at-home consumption and an increase in out-of-home dining.
In contrast, consumers were increasingly willing to trade up in categories related to health and personal hygiene. For instance, the juice sector saw a +9% increase in ASP in 2023, driven by the popularity of healthier options, such as 100% not-from-concentrate (NFC) juice and fresh juice.
Channel update: Offline consumption regained momentum, yet performance diverged across formats
Offline channels: Due to recovering offline consumption post-Covid-19, most offline formats regained momentum. Small-format and near-home stores, including grocery (+6%) and convenience stores (+7%), continued to lead this growth. Many large key accounts have closed hypermarkets while opening super/mini stores, leading to growing super/mini (+4%) and declining hypermarket (-6%) sectors. Within hypermarkets, club warehouses continued to experience substantial growth (42%) due to their unique value propositions.5 The growth of specialist stores (+4%) was driven by discount stores, such as snack discount shops.
O2O (Online-to-Offline):6 O2O growth decelerated to +3% in 2023, compared to +16% in 2022. Food and beverage decelerated significantly (+1%, compared to +21% in 2022) due to increased out-of-home catering. However, this does not mean that O2O purchasing behavior is disappearing, as evidenced by accelerating growth in personal care and home care (+7%, compared to +5% in 2022). Overall, O2O channel behavior was also shaped by major platforms’ growth strategies. The largest community group-buying platforms, Duoduo Maicai (多多买菜) and Meituan Youxuan (美团优选), have slowed their expansion plans and shifted their focus toward seeking profitable growth. This slowdown is offset by accelerating growth in offline retailers, as large key accounts continue to direct purchases to proprietary platforms, such as self-run apps.
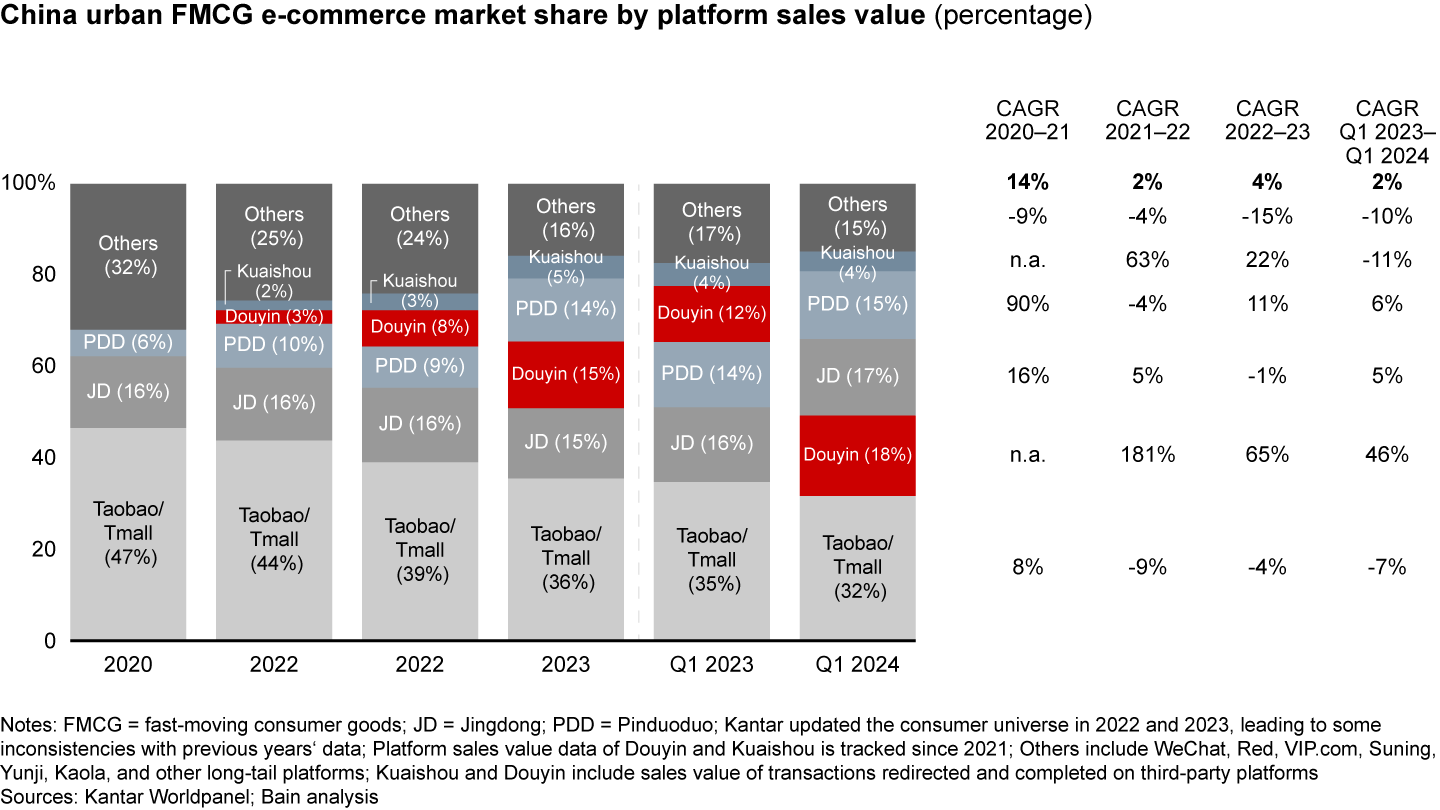
Online channels: Gradual shifts toward online channels continued, with a slight uptick in 2023 (+4% compared to +2% in 2022). Interest e-commerce, and discount e-commerce platforms continued to gain share from traditional e-commerce. Platforms such as Douyin, Kuaishou, and Pinduoduo saw their market share increase to 34%, a 12-point increase from 2022. Total e-commerce penetration increased significantly between 2019 and 2021 due to Covid-19, but it has remained stable since 2021. Food and beverage saw declines in online penetration due to the recovering catering market, while the online penetration of personal care and home care increased slightly.
Brand update: Large brands and foreign brands lost steam
Large brands vs. small brands: Brand competition remained dynamic. In recent years, the Top 5 brands have lost market share, with the exception of 2022, when large brands were boosted by resiliency in their supply chains and finances. In 2023, the trend of the Top 5 brands losing share returned, observed in 16 out of 27 tracked categories. After a challenging 2022, mid-to-small brands started reinvesting on the back of the positive outlook for Chinese consumption. This trend was particularly noticeable in the home care and beverage categories, where smaller brands introduced innovative product offerings targeting niche segments and occasions. For example, in the juice category, if (宜芙) invested in the coconut water segment and achieved rapid growth.
Foreign brands vs. domestic brands: In 2023, domestic brands continued to gain share (+1 point) from foreign brands in aggregated results across the 27 tracked categories. This is consistent with our observations over the past 12 years. Internally, some foreign players strategically reduced investment in certain categories due to a pessimistic category outlook. Moreover, foreign brands encountered heightened competition from domestic brands’ breakthrough product innovations and intensified pricing strategies.
Gaining perspective from the first quarter of 2024
Following a moderate macroeconomic outlook, the China FMCG sector recovered in Q1 2024 with value growth of approximately 2.0%, a half point higher than the 1.5% growth observed in Q1 2023. This indicates a positive sign for the rest of 2024. The Q1 economic recovery was even more evident from GDP growth (+5.3%) and retail sales value growth (+4.9%, excluding auto sales). Social activity indicators also showed positive signs of growth. Subway traffic in 29 major cities reached an average of 2.8 million daily passengers per city, a historic high. Meanwhile, social mobility during the 2024 Chinese New Year travel period reached 8.4 billion, a 70% increase from the 2023 Chinese New Year. Despite these positive trends, China’s consumer confidence index, housing price index, and unemployment rate have not yet recovered to pre-Covid-19 levels.
The market’s 2.0% value growth in Q1 2024 has been propelled by a 3.5% increase in volume, an uptick from the 2.3% volume growth observed in Q1 2023. This volume increase illustrates a continued, strong desire for consumption among consumers. However, the market experienced a deflation of -1.5% in the ASP, marking a more pronounced deflation trend compared to the stable pricing trend observed in 2023.
Category update: Packaged food and beverage continue to lead growth in Q1 2024; home care largely decelerated; personal care continues to decline
Among the four main sectors, packaged food and beverage witnessed stable growth, demonstrating consumers’ strong consumption desire. Packaged food continued its growth trend (+2.7%), driven by volume growth (+2.9%) and a quasi-stable ASP (-0.2%). Beverage showed faster growth (+4.3%), driven by both volume (+2.4%) and ASP (+1.8%). However, personal care declined by -2.8%, while home care’s growth decelerated to +2.2%. Despite robust volume demand for personal care (+5.1%) and home care (+8.5%), both sectors faced severe “trading down” issues, illustrated by their ASPs declining by -7.5% and -5.8%, respectively.
Packaged food: The sector grew by +2.7% in value, driven by a +2.9% increase in volume, despite a slight -0.2% decrease in ASP. Most categories within packaged food experienced volume growth due to recovering social mobility and activities. For instance, Chinese New Year saw a notable surge in gifting demand. However, the ASP declined slightly by -0.2%, contrasting with the premiumization trend observed throughout 2023. This decline is attributed to consumers choosing different price bands for diverse occasions, such as opting for larger packs with lower ASP for gifting.
Beverage: The sector’s value grew by +4.3%, driven by increases in both volume (+2.4%) and ASP (+1.8%). The near-water categories maintained their high growth, with notable increases in juice (+20.8%), RTD tea (+8.6%), and packaged water (+5.6%), while CSD declined by -5.9%. Milk and coffee reversed their growth trends, declining by -2.9% and -5.9%, respectively, likely due to increased out-of-home activities and consumption compared to Q1 2023, when most people stayed home due to Covid-19. Beer experienced growth of 8.4%, driven by more at-home gatherings. Yogurt continued to decline (-8.4%).
Home care: The volume grew by +8.5%, but the ASP dropped by -5.8%. Most home care categories saw strong volume demand driven by leading players’ efforts to promote diverse use occasions, increased social activities, and established focus on hygiene and health post-Covid-19. Consequently, fabric detergent (+5.7%), facial tissue (+7.5%), and kitchen cleaner (+6.0%) saw robust growth driven by volume. However, in contrast with the premiumization of 2023, tracked categories displayed a price deflation in Q1 2024, driven by brands’ price cuts and promotion of larger, bulk-sized products.
Personal care: The sector experienced a volume rebound of +5.1%, offset by a significant drop in ASP (-7.5%). Most categories showed strong volume growth, driven by increased social activities. For example, makeup (volume +13.8%) and toothpaste (volume +6.4%) saw notable increases. However, consumers remained cost-conscious, and most personal care categories faced competition from domestic brands offering more value-for-money products, resulting in a decrease in ASP, particularly in skincare (ASP -8.8%), makeup (ASP -13.2%), and hair conditioner (ASP -6.8%). The diaper category continued its decline due to a decrease in newborns.
Pricing update: FMCG ASP deflated in Q1 2024, a downturn from 2023’s stable pricing trend
Inflation in China has largely moderated following its reopening, with a slight rise of 0.1% in Q1 2024 consumer price index (CPI), maintaining the trend observed since Q2 2023. Unlike the stable pricing trend observed in 2023, FMCG ASP saw a decrease of -1.5% in Q1 2024.
Of our 27 tracked categories, 18 categories witnessed deflation in Q1 2024. This trend was especially pronounced in personal care and home care sectors. Overall, we observed three pricing trend clusters:
Cluster 1: Continuous premiumization
This cluster primarily includes packaged food and beverage categories, such as coffee (Q1 2024 +6.4%, 2023 +2.0%), juice (Q1 2024 +3.2%, 2023 +8.9%), candy (Q1 2024 +1.9%, 2023 +6.2%), and biscuits (Q1 2024 +1.9%, 2023 +3.0%). These categories benefited from consumers’ preference for healthier products such as fresh juice and low-sugar biscuits, due to their increasing focus on wellness. Additionally, brand innovation has enabled consumers to “trade up” to higher quality products, such as coffee capsules and soft candies with beauty benefits.
Cluster 2: Continuous deflation
Most personal care categories fall into this bracket. In a highly competitive market, insurgent brands continue to challenge incumbents by offering lower-priced products, while large incumbents reduce prices during campaigns. This trend is particularly evident in skincare (Q1 2024 -8.8%, 2023 -3.0%) and makeup (Q1 2024 -13.2%, 2023 -5.4%). Some categories saw brands promoting larger pack sizes, leading to continuous ASP declines, e.g., packaged water (Q1 2024 -3.4%, 2023 -0.8%). Diapers (Q1 2024 -7.0%, 2023 -4.7%) and infant formula (Q1 2024 -2.6%, 2023 -3.3%) are also in this cluster due to increased competition caused by demographic changes.
Cluster 3: Premiumization reversed to deflation
This cluster consists mainly of home care categories, including fabric detergent (Q1 2024 -3.0%, 2023 +0.9%), kitchen cleaner (Q1 2024 -1.0%, 2023 +0.8%), and facial tissue (Q1 2024 -0.6%, 2023 +4.2%). It is noteworthy that this deflation does not necessarily indicate a consumer preference for cheaper products. Consumers are still trading up to better products, such as liquid detergent from bar or powder formats. This deflation is primarily supply driven, as brands have proactively promoted larger pack sizes and lowered prices due to lower material costs.
Channel update: Overall trend in line with 2023, with further divergence in offline channel performance
Offline channels: Offline channels grew by +2.4%, slightly higher than the overall FMCG and e-commerce channels, due to recovering offline traffic. Within offline channels, grocery and super/mini formats continued to gain share, growing at +11% and +7%, respectively, in Q1 2024, while hypermarket segments continued to shrink, with a decrease of -6%. However, within the hypermarket sector, club warehouses saw notable growth of +22%, representing 9% share of the total hypermarket channel. Meanwhile, specialist stores declined by -4% (compared to +4% growth in 2023).
O2O (Online-to-Offline): O2O saw a decline of -8% in Q1 2024 due to the full recovery of offline activities. However, there is still growth momentum compared to Q1 2022, indicating that consumers have developed O2O shopping habits. As discussed in the 2023 full-year trend, O2O in non-food and beverage categories continued to grow.
Online channels: E-commerce growth maintained a low single-digit rate of around +2%. Notably, Douyin surpassed JD to become the second-largest e-commerce platform, delivering substantial growth of +46% and achieving an 18% market share in Q1 2024, 6 points higher than Q1 2023. Pinduoduo saw increased traffic driven by its value-for-money proposition, resulting in +6% growth and a 15% market share, 1 point higher than Q1 2023. JD experienced +5% growth as a result of its low-price strategy, reversing from a -1% decline last year. Taobao/Tmall continued to decline at -7%, with their market share landing at 32% (3 points lower than Q1 2023), yet they remain the largest e-commerce platform.
Insurgents: Competitive strengths that navigated through cycles
The Chinese FMCG market has recently witnessed an influx of numerous insurgent brands. By leveraging venture capital and online traffic, these insurgent brands rapidly grabbed market share from incumbents. However, in recent years, as traffic has peaked and costs have risen, their “cash-burning” operational model has become unsustainable. Investors have become more cautious and rational, forcing brands to optimize efficiency. When the facade of traffic fades away, a brand’s true strength or false prosperity becomes evident.
In our previous reports, China Shopper Report 2018, Vol. 2, Local Insurgents Shake Up China’s “Two-Speed” Market, and China Shopper Report 2021, Vol. 2, A Sudden Slowdown in 2021’s FMCG Recovery and the Mixed Fate of China’s Insurgent Brands, we selected representative insurgent brands with “disruptor potential.” We have been tracking the performance of these brands over the years to synthesize key factors behind their degree of success to date.
Class of 2018 brand performance reflection
In 2018, we selected 46 representative insurgent brands based on brand characteristics, scale, and growth performance. In 2021, we reviewed their performance from 2018 to 2020 and categorized them into three groups: “Stand-out” (17 brands, 40%), “Hold-out” (9 brands, 20%), and “Fade-out” (20 brands, 40%). Revisiting their performance in 2024, we found a similar category distribution: Stand-out (18 brands, 40%), Hold-out (9 brands, 20%), and Fade-out (19 brands, 40%).
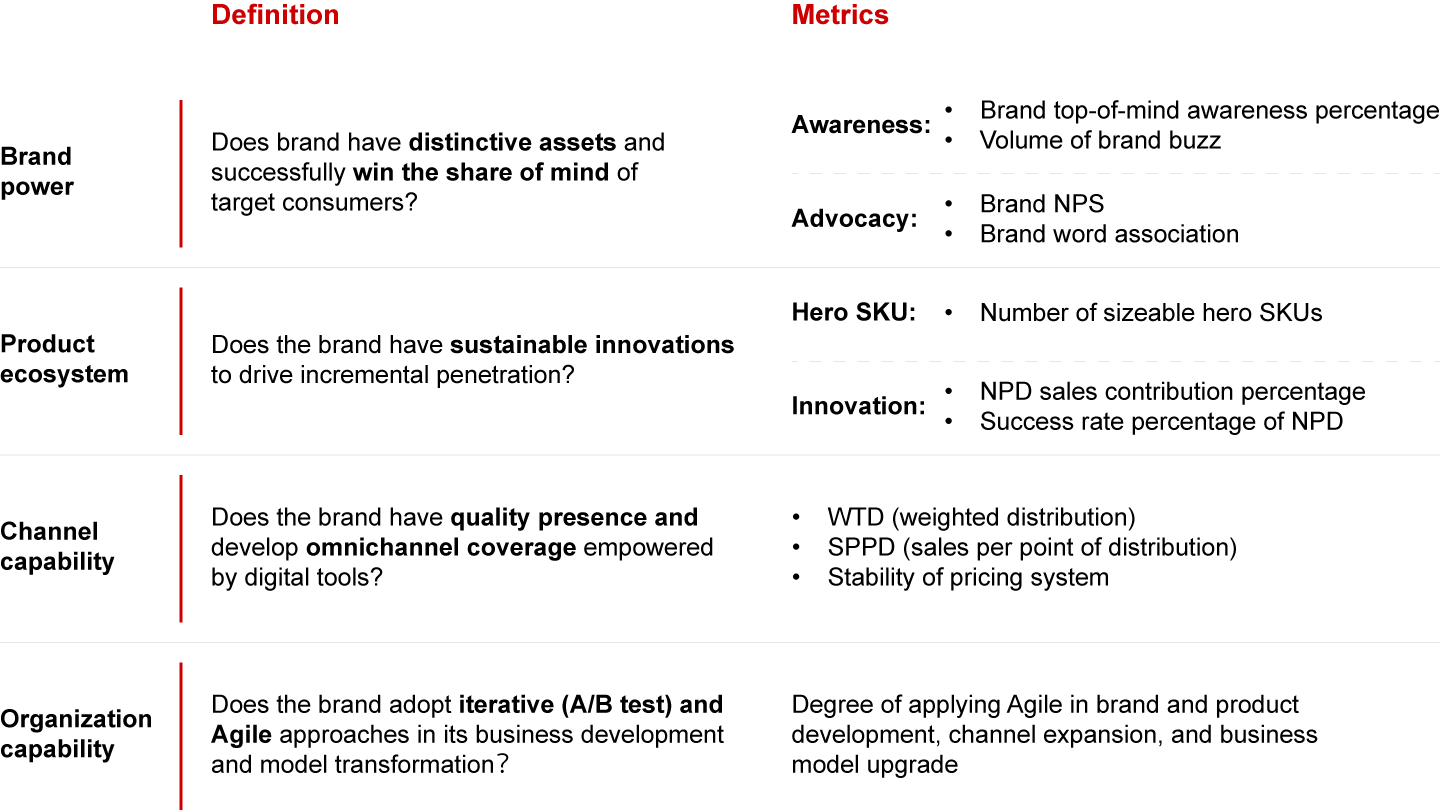
By analyzing the development trajectories of these brands, we identified four key success factors for insurgent brands in 2021: brand power, product ecosystem, channel capability, and organizational agility. When revisiting these brands’ performance from 2021 to 2023, we found that these success factors still held.
Stand-out: The strong get stronger
Many Stand-out brands in 2021 continue to excel. For example, YankershopFood (盐津铺子) strengthened its competitive edge in product innovation and omnichannel operations, achieving a 34% CAGR in retail sales from 2021 to 2023. Meanwhile, some brands categorized as Hold-out or Fade-out in 2021 achieved breakthroughs and became Stand-out by investing in one or more of the four previously identified drivers of success. For instance, Ganten (百岁山) achieved a 34% CAGR in retail sales from 2021 to 2023 and revitalized its brand image through premium brand positioning, focusing deeply on offline channels.
Hold-out and Fade-out: Continued struggles
Most Hold-out and Fade-out brands continue to face growth challenges in a competitive environment. These struggles can be attributed to the loss of established advantages, failure to adapt to channel changes, or lagging product innovation. For example, One Leaf (一叶子) consistently underperformed due to heavy reliance on cosmetics specialty store channels, outdated product upgrades, and failed rebranding efforts.
Class of 2021 brand performance reflection
In 2021, we applied similar criteria to identify 69 insurgent brands. Recently, we conducted a review of their performance between 2021 and 2023. Our analysis revealed a distribution of players akin to the class of 2018, with three main categories: Stand-out (28 brands, 40%), Hold-out (12 brands, 20%), and Fade-out (29 brands, 40%). In addition, the four-lever model mentioned above continues to explain the differences in brand trajectories.
Stand-out: These brands have established remarkable competitive advantages across at least two levers, with no evident shortcomings. For instance, despite declining demographics in the maternal and infant market, Babycare has emerged as a Stand-out in recent years, leveraging full-category strategy and embracing omnichannel acceleration. This approach has led to a retail sales CAGR of 27% from 2021 to 2023.
Hold-out: These brands exhibit notable strengths in one or two dimensions but suffer from identifiable weaknesses. For example, the emergence of the “single economy” phenomenon has spurred the proliferation of packaged food brands. Bibigo (必品阁) was able to capitalize on this trend during the Covid-19 era, with its unique Korean cuisine products and frozen dumplings, but now faces challenges in maintaining market position as normalcy returns.
Fade-out: These brands have erected “false barriers” in certain dimensions, which are swiftly overcome by competitors. For instance, Ramen Talk (拉面说), a quintessential example of an emerging brand adopting fast growth through online traffic, has experienced a precipitous decline following its initial popularity. Their heavy reliance on online traffic and failure to expand their offline presence resulted in a more than 50% drop in retail sales from 2021 to 2023.
In the class of 2021 brands, approximately 20 brands (30%) are affiliated with large corporate parent groups. Backed by such entities, these brands possess a higher likelihood of sustaining their business operations. Leveraging the resources of the parent company enables these brands to strengthen their positions and achieve rapid breakthroughs. However, if they are not prioritized within the parent company’s brand matrix, their performance may still falter despite the inherent advantages of corporate support.
Class of 2024 brands
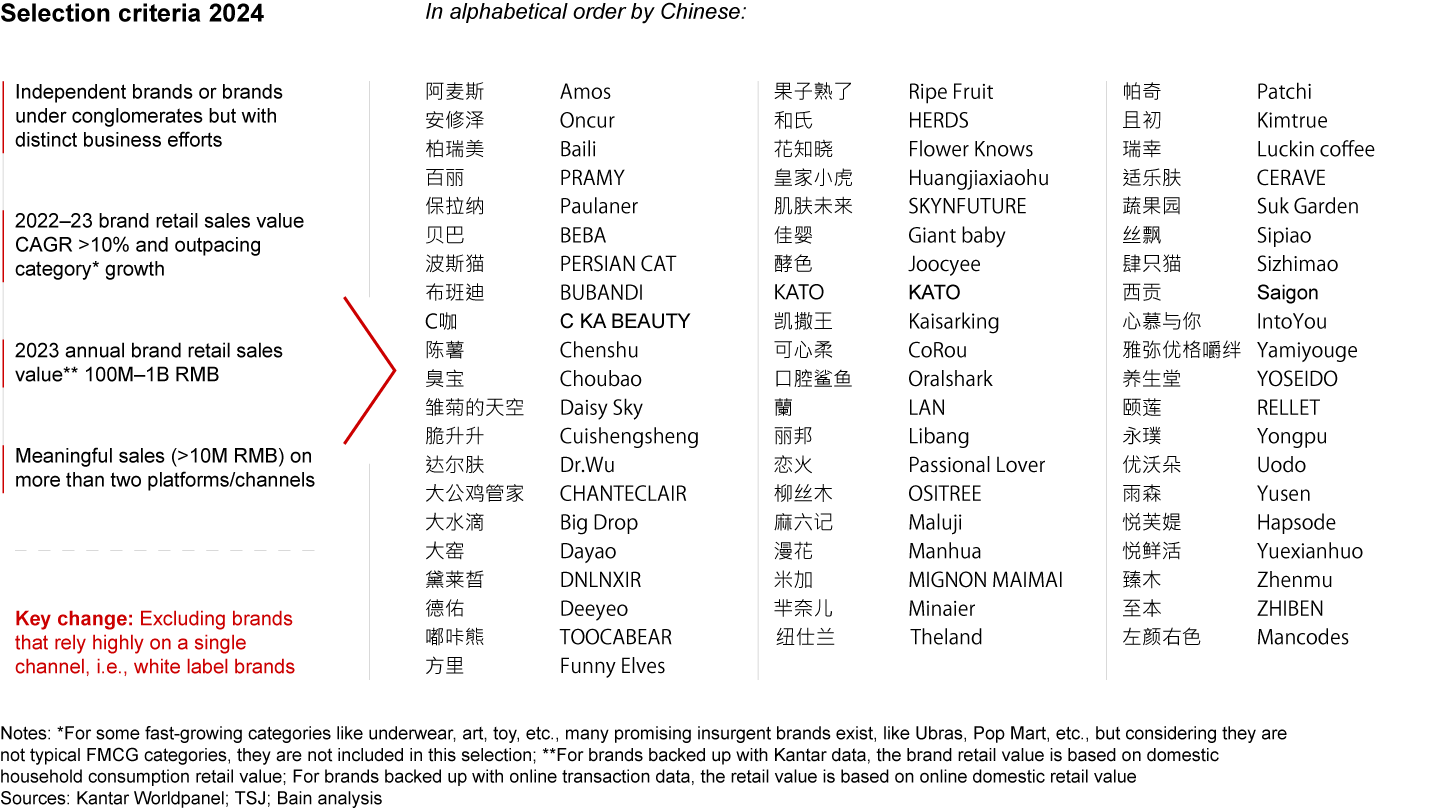
Based on our research experience on China’s emerging brands over many years, we have selected 61 insurgent brands to form the Class of 2024. Most of these brands were born between 2019 and 2021, during the peak period of China’s new consumer brand investment. When we conducted the 2021 selection, they were not yet large enough to enter the list. However, in the past few years, they grew despite adverse market conditions.
We found that the four-lever model, comprising brand power, product ecosystem, channel capability, and organizational agility, continued to be crucial for the success stories of our selected 2024 insurgent brands. However, we also observed evolving requirements on these four levers to successfully adapt to the latest market dynamics.
In channel capability, particularly, there’s an increasing need for insurgent brands to capture emerging channels and develop “Connected Commerce” capabilities instead of being stuck in a siloed channel approach. For example, Yongpu (永璞) transitioned from being an “online influencer brand” to establishing an omnichannel presence by expanding its offline distribution networks. Passional Lover (恋火) achieved accelerated growth on Douyin with a tailored product portfolio, content creation, and operational excellence.
Implications for brands and retailers
In this new environment in which consumer confidence remains subdued, brands should focus on four main priorities:
- Follow consumers’ true needs, as they have evolved significantly since the reopening in Q1 2023.
- Manage costs to remain competitive in this deflationary environment.
- Build integrated routes to market strategies, as shopper journeys involve both online and offline touchpoints indistinctly.
- Rejuvenate out-of-home opportunities in food and beverage categories as out-of-home consumption remains on the rise.
Retailers facing intensified competition and evolving channel dynamics should also focus on three priorities:
- Sharpen shopper value propositions in core shopper segments and establish defensible moats.
- Sweat the assets through revisiting investment plans to align more closely with evolving shopper behavior and unlocking productivity for optimized investments.
- Refocus capability-building with technology and talent, and revitalize organization around an authentic purpose and mission.
The full report
This is the 13th consecutive year that we have tracked the shopping behaviors of Chinese consumers. Our continuing research has given us a valuable, long-term view across 106 fast-moving consumer goods (FMCG) categories purchased for home consumption in China.1 As in each of the past 12 years, we analyzed the 26 key categories spanning the four largest consumer goods sectors: packaged food, beverage, personal care, and home care.2 This year, we updated our tracking to include nutrient supplements, coffee, and sanitary pads and eliminated toothbrushes and fabric softener, bringing our tracked categories total to 27, to align more closely with evolving market dynamics.3 This report updates the findings from our China Shopper Report 2023, Vol. 2, Charting a resilient path: Navigating uncertainty and building momentum, and includes Kantar Worldpanel shopper behavior data for 2023 and the first three months of 2024.
This report recaps FMCG performance in 2023, a period when consumption regained momentum following the lifting of remaining Covid-19 restrictions. We also explore consumer trends from the first quarter of 2024. Building on the analyses presented in China Shopper Report 2018, Vol. 2, and China Shopper Report 2021, Vol. 2, we review the performance of insurgent brands from the Class of 2018 and Class of 2021 and select representative brands to feature in the Class of 2024. The report includes implications for consumer goods companies and retailers.
Reflection on 2023
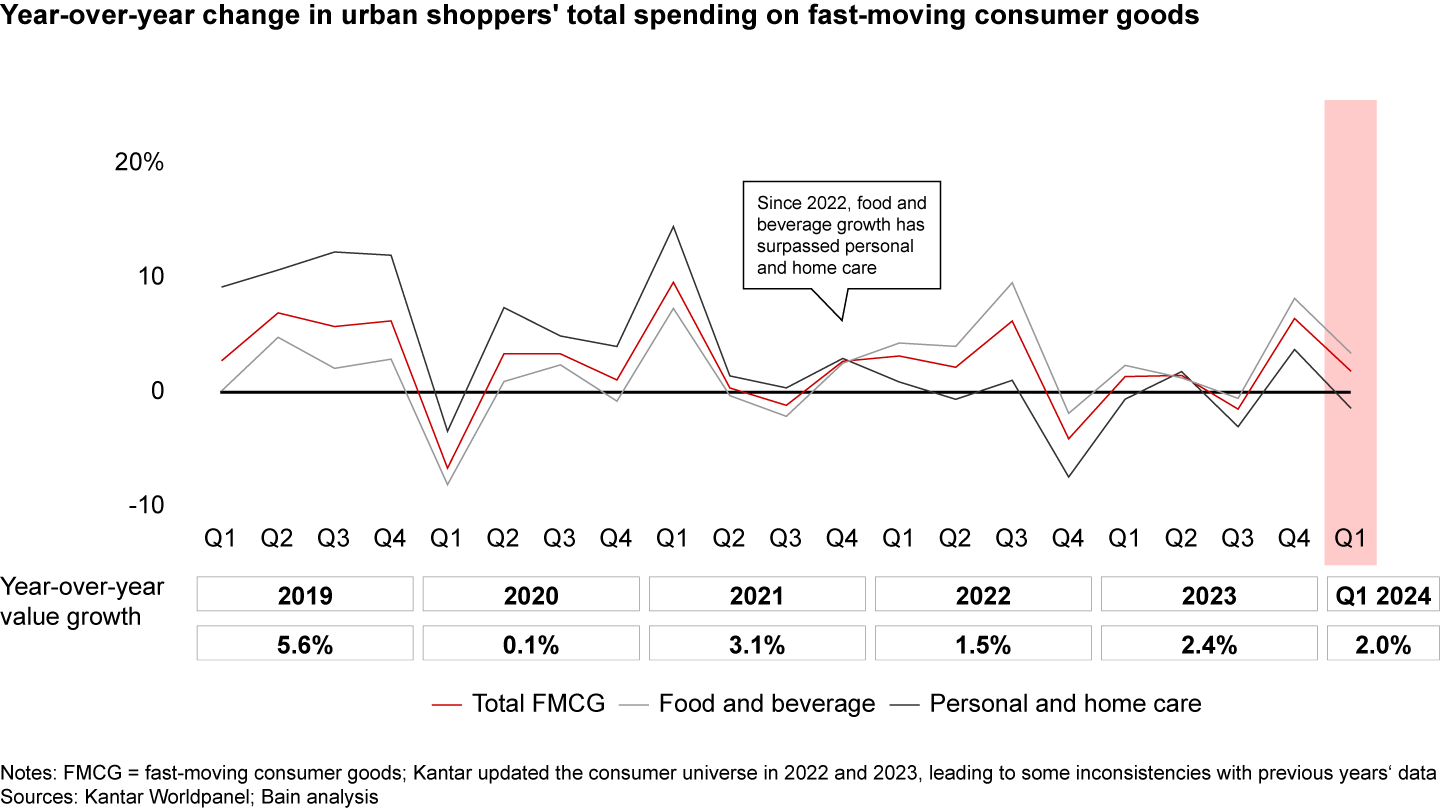
In 2023, China’s FMCG market experienced its first operational year following the lifting of Covid-19 restrictions in December 2022. Despite a promising start, the year fell short of consumer confidence and consumption expectations. The China FMCG market netted 2.4% annual growth (see Figure 1), following a moderate recovery in the first three quarters of 2023 and a notable surge of 6.5% in Q4. The strong recovery in Q4 can be attributed partially to the low baseline in the same period of the previous year (Q4 2022).

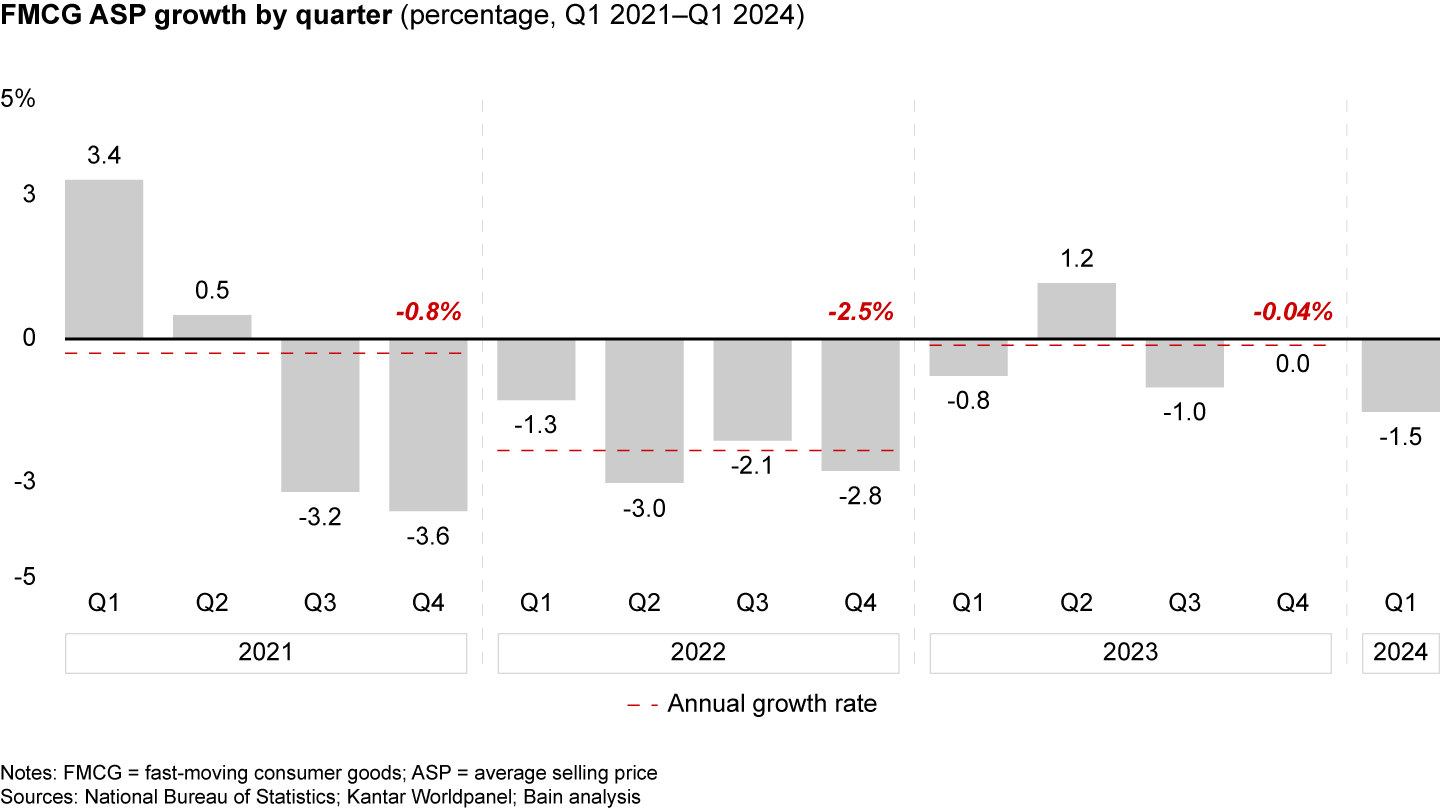
Volume continued to be the main driver of growth, along with stable average selling prices (ASP) throughout the year (see Figure 2). Q1 recorded a robust volume growth of 2.3%, which then slowed to 0.4% in Q2. The volume slightly contracted in Q3 by 0.3%, but like the value growth, it surged significantly in Q4 with a 6.6% increase, leading to an overall volume growth of 2.4% for the year. The ASP of FMCG products saw modest changes throughout the year. Q1 experienced a slight decrease of 0.8%, which was followed by a positive growth of 1.2% in Q2. The subsequent quarters saw minor fluctuations, with a decrease of -1.0% in Q3 and stabilization at 0.0% in Q4. Overall, the ASP growth rate for the year was neutral, indicating that price changes had a minimal impact on the market’s overall performance. This pricing trend is positive compared to 2022, which recorded a -2.5% decline in ASP.

Despite a stable ASP trend, Chinese consumers are still willing to “trade up” in certain categories. This is evident in the divergent pricing trends across categories, which are attributable to supply and demand dynamics. On the demand side, categories that align with rising demands for affordable health and well-being products encourage consumers to trade up. On the supply side, categories offering meaningful innovation without aggressive price competition also contribute to consumer trade-ups. We observed three distinctive clusters of pricing behavior:
Trade-up: These are categories with notable innovations that match rising demand for health and wellness and affordability, such as juice, facial tissue, and toothpaste. For instance, juice categories saw consumer demand for higher quality and rich flavors, such as 100% not-from-concentrate (NFC) juice, blueberry juice, and coconut water. These products are typically affordable, and both incumbents and insurgents to the juice market are investing in their manufacturing capabilities to offer these and other diverse choices. As a result, juice saw an 8.9% ASP growth, driven by a 40% value growth in the premium price band.
K-shape: These are categories with innovations that match consumer needs but face intense price competition, leading to a split in consumer behavior. For example, in fabric detergent, consumers have been trading up from powders and bars to liquid formats, especially “3 in 1” laundry pods that instantly dissolve. However, as raw material costs decreased, some players aggressively promoted lower ASP products, driving some consumers to choose value-for-money options. Fabric detergent experienced a relatively flat ASP growth of 0.9%, with the premium price band growing by 6%, mid-range growing by 0%, and the mass price band growing by 10%.
Trade-down: These categories lack breakthrough innovation and face intense competition due to an influx of new entrants and are likely to experience ASP drop, evidenced by the pricing behavior in skincare and makeup. Despite a strong volume rebound, makeup saw an ASP decline of -5.4%, with the mass price band growing by 13%, outpacing other price bands due to intense competition, especially from domestic brands.
Geographically, Tier 2 cities have emerged as the primary drivers of growth in the FMCG market. In those cities, value growth was up +5.0%, driven by both volume (+3.7%) and a notable rise in ASP (+1.2%) (see Figure 3). In contrast, Tier 1 cities showed moderate growth (+1.5%), with slight declines in ASP (-1.2%). Lower-tier cities faced more challenges in ASP management, though they maintained some growth in value and volume. This strong, urban-based consumer demand recovery post-Covid-19, particularly in Tier 2 cities, is likely the result of increased consumer spending and broader urbanization trends.
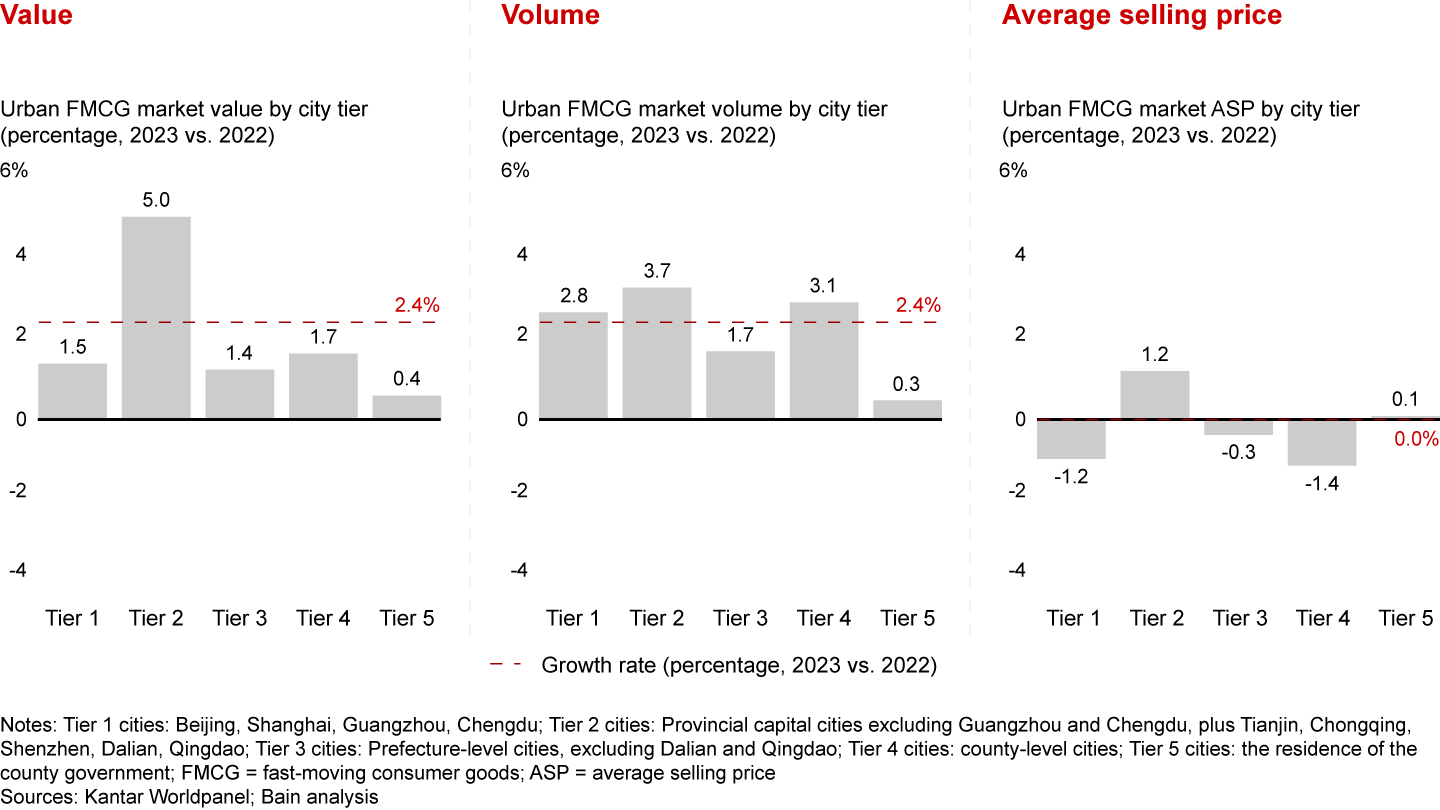

The evolving city tier landscape has turned Tier 2 cities (i.e., cities with a population influx of 8 million or more in the past four years) into destinations for population migration and test fields for FMCG brands. These cities have also become the launchpads for the transformation pilots and initiatives of multinational corporations and the birthplace of insurgent FMCG brands. For example, Changsha—where the population has increased by 1.2 million (+13%, 2018–2023), outgrowing other cities in Hunan—is now the home of new consumer brands Sexy Tea (茶颜悦色) and Saturnbird (三顿半).
Home care led value growth, followed by packaged food and beverage
Within the four major sectors, home care led value growth (+8.3%), followed by packaged food (+3.4%) and beverage (+3.2%), while personal care saw a narrowed decline (-2.1%, compared to -4.8% in 2022) (see Figure 4).
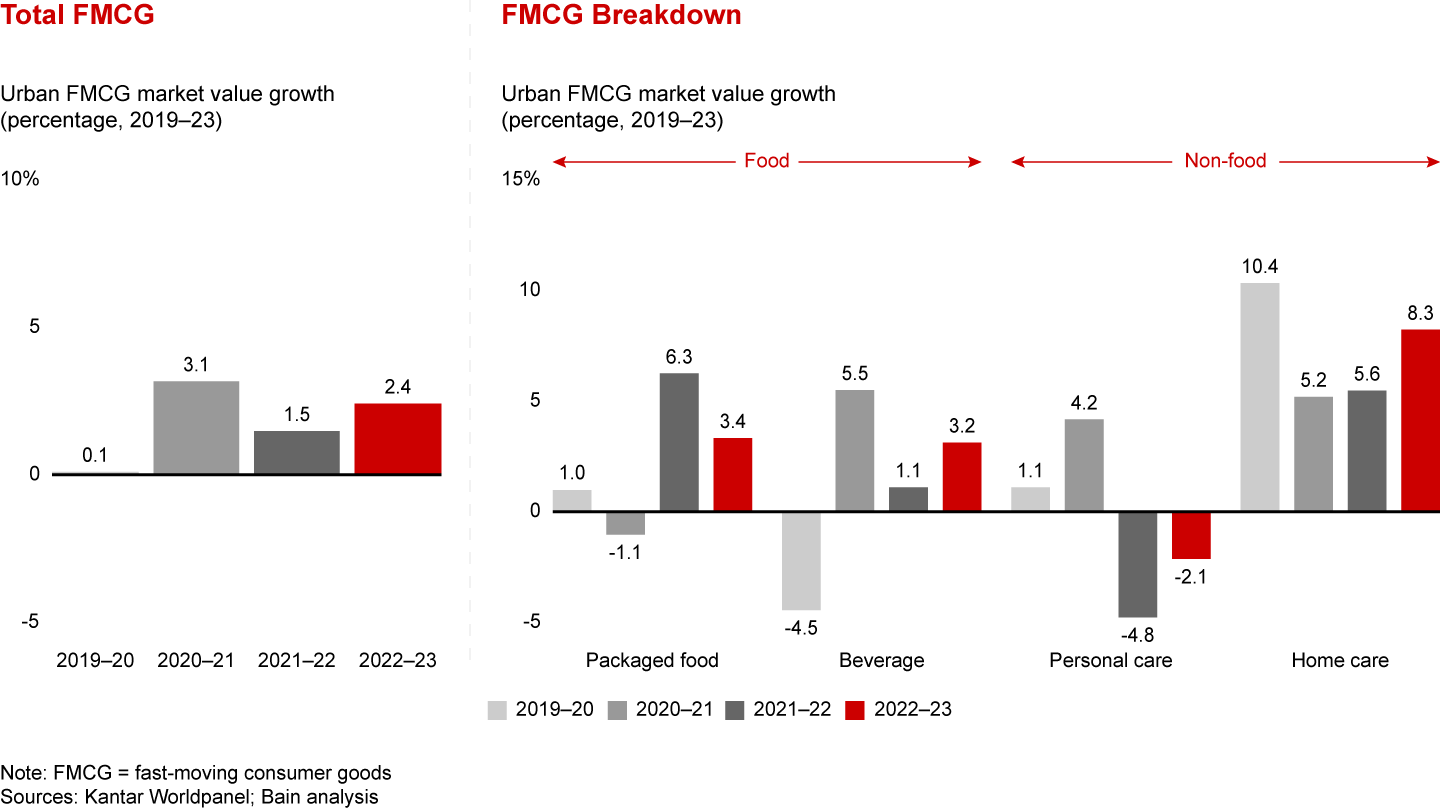

Home care delivered healthy value growth of +8.3%, driven by volume growth of +7.4%. Overall, ASP increased by +0.9%, despite a deflation trend in Q4. Rising demand for personal hygiene and brands’ efforts to encourage consumer trade-ups to diversified, occasion-based usage supported the sector’s growth. Fabric detergent saw value growth of +5.5%, primarily driven by a +4.5% increase in volume due to increased out-of-home activities. Facial tissue experienced significant volume growth (+12.5%) and ASP growth (+4.2%), with major brands continuing to educate consumers on diverse, use-specific products, such as baby facial tissue and face towels. Kitchen cleaner grew by +6.6%, with substantial volume growth of +5.8%, due to diversified products, including oil remover and dishwasher detergent. Toilet tissue sales grew by +2.7 %, primarily driven by a +1.9% increase in ASP and a +0.8% increase in volume.
Packaged food exhibited robust value growth of +3.4%. Volume slightly dropped by -1.5%, attributed in part to increasing on-premises consumption post-Covid-19. This trend was accompanied by an accelerated premiumization trend, with a notable increase in ASP (+5.0% vs. +3.2% last year). Nutrient supplements experienced substantial value growth (+20.5%) mainly driven by volume (+29.6%), suggesting a strong consumer demand for health-related products post-Covid-19. However, the decline in ASP (-7.0%) indicates competitive pricing or increased promotions. Infant formula continued to decline (-15.3%) due to demographic changes. Between 2021 and 2023, 29.3 million newborns were born in China, nearly a 30% decrease from the 41.9 million born between 2018 and 2020, leading to a significant decrease in infant formula volume (-12.4%). ASP (-3.3%) also decreased, due to increased competition. Other categories faced overall volume declines due to increased out-of-home consumption. Despite volume declines, many categories saw positive ASP growth, indicating a trend of trading up. This trend is particularly evident in candy and chocolate. Chocolate showed a significant ASP increase (+10.6%) as incumbents and insurgent brands encouraged consumers to choose healthier options including low-sugar SKUs. However, these ASP gains were offset by a volume drop (-8.9%), resulting in overall chocolate value growth of just +0.8%. Candy showed resilience, growing +5.7% in value, due to at-home occasions and innovations including new product lines with organic or other health-focused ingredients.
Beverage was sluggish in Q1–Q3 due to increasing on-premises consumption. However, Q4 witnessed a strong rebound, primarily due to a relatively low base in Q4 2022. Consumers are increasingly moving from high-sugar drinks (e.g., normal carbonated soft drinks [CSD]) to near-water drinks (近水化) and low-/no-sugar options, including zero-sugar ready-to-drink (RTD) tea. As a result, the sector was characterized by significant growth in juice (+24.1%), packaged water (+8.9%), and RTD tea (+14.1%), primarily driven by volume increases. Conversely, CSD faced a decline of -7.3%, in both volume (-5.7%) and ASP (-1.7%). Reduced consumer interest in CSDs can be attributed to shifts in perceived healthier beverage options and increased on-premises consumption. Milk displayed moderate growth in value (+2.0%), mainly driven by volume (+1.7%), due to increased demand during the Covid-19 period. Yogurt continued to decline in both value (-8.5%) and volume (-8.0%), reflecting competition from milk, which Chinese consumers perceive as offering better nutrition, and from on-premises consumption options, such as milk tea, which challenge yogurt’s consumption occasions. Beer continued to premiumize, with most leading brands focusing on premium product lines, leading to value growth (+4.6%) driven primarily by higher ASP (+4.2%).
Personal care’s decline narrowed, recording a -2.1% value growth compared to -4.8% last year. This was driven by a +1.3% increase in volume, despite ASP deflation of -3.4% throughout the year. Increased out-of-home activities led to notable growth in certain categories driven by volume, including makeup (value +6.4%, volume +12.5%) and shampoo (value +3.2%, volume +4.1%). Some categories such as skincare (value -3.1%, ASP -3.0%) and personal wash (value -2.2%, ASP -1.9%) declined due to declining ASP, despite stable volume demand. Although most categories experienced deflation due to intense insurgent brand competition, some categories saw premiumization. Both toothpaste and hair conditioner experienced +3.8% ASP growth, leading to value growth of +4.4% and +4.6%, respectively. Major brands in these categories are innovating and successfully getting consumers to trade up to efficacy-driven products, such as whitening and gum protection toothpastes. Sanitary pads, newly added to our tracked categories, posted a -2.3% decline, mainly driven by a -4.0% decline in volume as consumers shifted toward competing products such as tampons and menstrual cups. Diapers displayed a similar trend to infant formula, declining by -16.2% due to a decrease in the number of babies being born.
The two-speed growth phenomenon we first identified in China Shopper Report 2016, Vol. 1, Dealing with two-speed China, was still evident (see Figure 5). Consistent with our findings in previous volumes, high-speed growth was largely concentrated in categories benefiting from increased awareness of health, hygiene, and emotional needs, while many nonessential or replaceable categories experienced negative growth. High-speed categories experienced both volume and ASP growth, while most low-speed categories primarily saw volume decline.
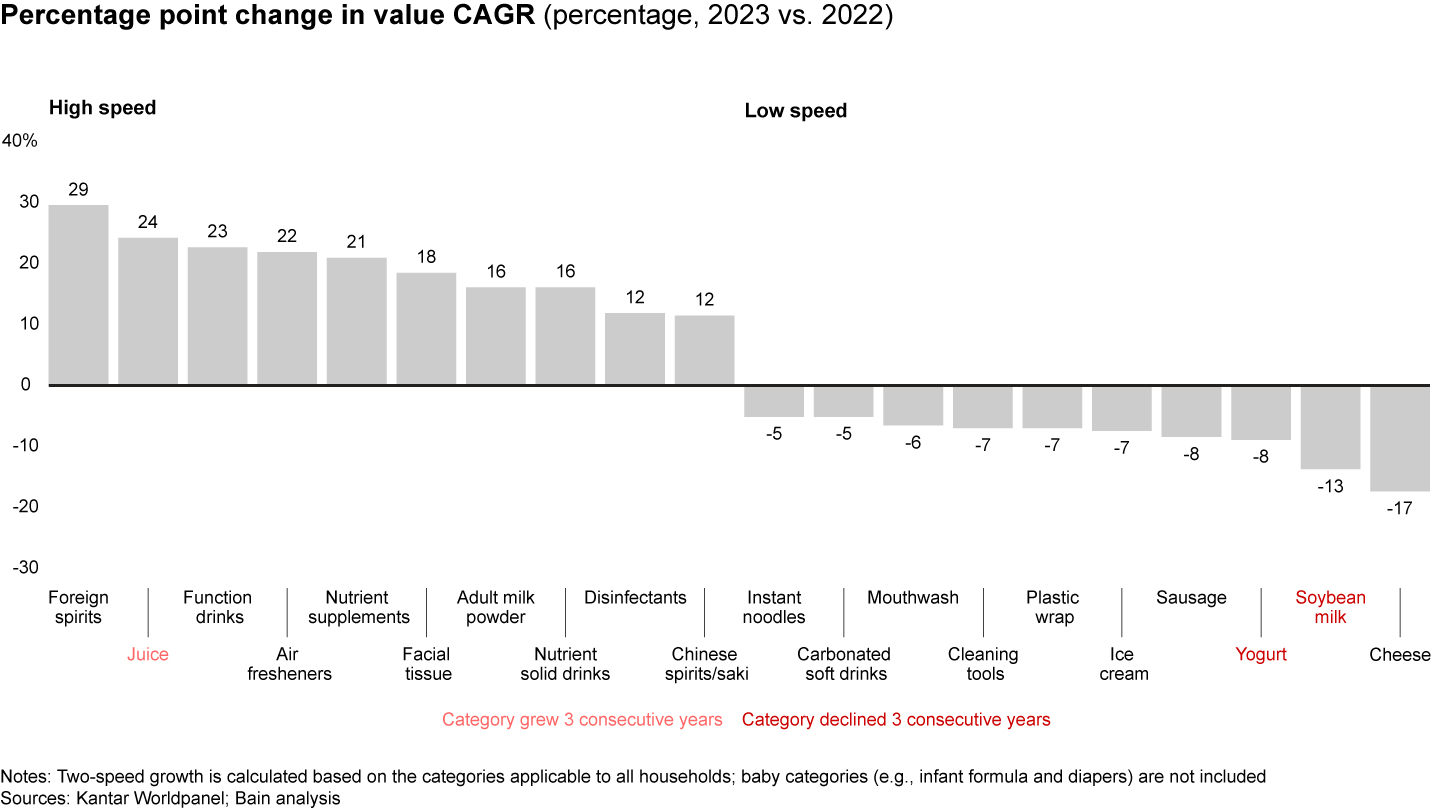

High-speed categories: Within the high-speed categories, there was an increasing demand for health-related and hygiene products, such as functional drinks (+23%) and air fresheners (+22%), and a willingness to pay a premium for entertainment and emotion-driven products such as foreign spirits (+29%). Juice (CAGR +24% from 2022–2023) enjoyed positive value growth for three consecutive years, driven by healthier options, such as 100% NFC and fresh juice.
Low-speed categories: On the other hand, low-speed categories are mainly concentrated in packaged food and beverage sectors, such as cheese (-17%) and yogurt (-8%). These categories are negatively impacted by changing consumption habits, with a marked decrease in at-home consumption and an increase in out-of-home dining. Some categories, such as soybean milk and yogurt, demonstrated a consistent low-speed trend. Chinese consumers’ taste for soybean milk and yogurt has not been fully cultivated, leading to a perception that both are less nutritious than milk when opting for nutrition drinks, and less tasty compared to CSD or milk tea, if catering to taste. As a result, these categories are easily substituted by others.
Consumers are increasingly willing to trade up in categories related to health and personal hygiene. For instance, the juice sector saw a 9% increase in ASP in 2023, driven by the popularity of healthier options, such as 100% NFC juice; enhanced taste profiles, such as juice soda; and diversified flavors, including blueberry prunes. Similarly, the chocolate category experienced an 11% rise in ASP as both incumbents and insurgents invest in imported ingredients (e.g., pure cacao butter), healthier options (e.g., black chocolate), hand-made concepts, and occasion-driven gift sets in an attempt to get consumers to trade up to higher-priced products. These trends highlight a growing consumer preference for premium products in these sectors.
Offline consumption regained momentum, yet performance diverged across formats
Consistent with our findings in China Shopper Report 2023, Vol. 2, gradual shifts toward online channels continued, with a slight uptick in 2023 (see Figure 6). The value CAGR was 4% in 2023, relative to 2% in 2022 and 23% from 2019 to 2021. The relative stagnation of e-commerce was attributed to recovering offline consumption. In contrast, most offline formats regained traction and achieved above-average growth. Though hypermarket is the only offline channel that saw decline, club warehouses within this sector enjoyed rapid growth due to their unique value propositions.
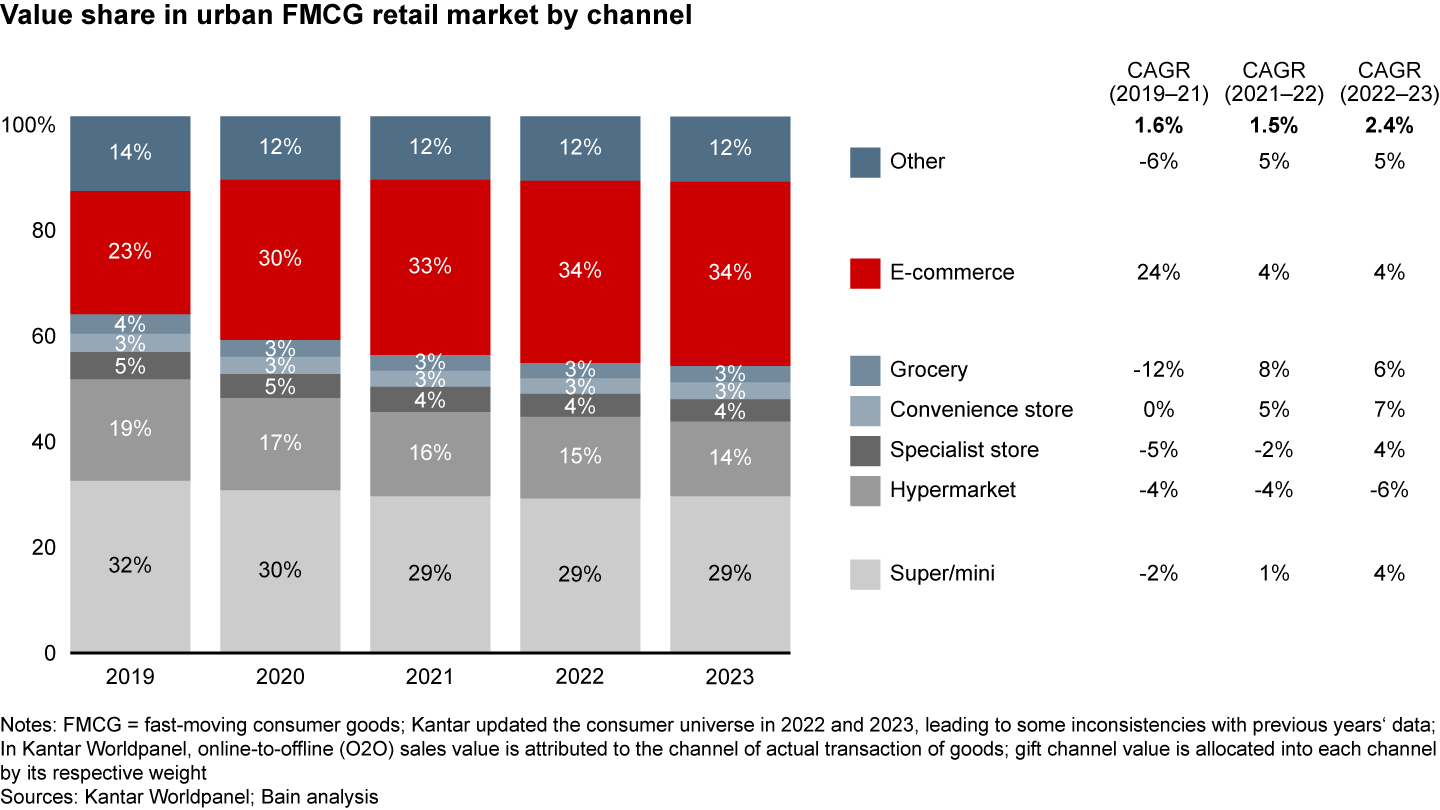

Offline channels: Due to recovering offline consumption post-Covid-19, certain offline formats regained momentum, especially in near-home stores. Small-format stores, including grocery (+6%) and convenience stores (+7%), continued to lead this growth. Large key accounts have closed hypermarkets while opening super/mini stores, leading to growing super/mini (+4%) and declining hypermarket (-6%) sectors. Within hypermarkets, club warehouses saw substantial growth of 42%, growing their share of the total hypermarket sector from 5.4% in 2022 to 8.5% in 2023. This growth is led by the continuous expansion of leading players Sam’s Club and Metro. The growth of specialist stores (+4%) was driven by snack discount stores and other discount-focused players.
O2O (Online-to-Offline): We identified in China Shopper Report 2023, Vol. 1, that O2O was booming in 2022. However, O2O growth slowed to approximately +2.8% in 2023, mainly due to slowdowns in the packaged food and beverage categories (1% in 2023 compared to 21% in 2022). This was driven by changes in customer behavior, such as increased offline catering sales (+20% in 2023) and a shift toward offline food markets. However, this does not mean that O2O purchasing behavior is disappearing, as evidenced by accelerating growth in personal care and home care (+7%, compared to +5% in 2022).
The O2O channel trend is also shaped by major platforms’ operational strategies. The largest community group-buying platforms, Duoduo Maicai (多多买菜) and Meituan Youxuan (美团优选), have slowed their expansion plans and shifted to a profitable growth strategy. Duoduo, for instance, concentrated its operations on 78 self-operation units to minimize operational loss and promote profitability. Meanwhile, these two players continue to expand the category and increase purchase frequency. The inclusion of new categories, such as cosmetics, personal care, home care, and clothing, has driven a 20% increase in purchase frequency. As a result, in 2023, these two platforms demonstrated stable penetration, a notable volume growth, and a decline in ASP due to category mix change.
Within online channels, interest e-commerce and discount e-commerce platforms continued to gain share from traditional e-commerce. Platforms such as Douyin, Kuaishou, and Pinduoduo collectively saw their market share increase to 34%, a 12-point increase from 2022. Notably, Douyin maintained a high growth of +65%, followed by Kuaishou (+22%). Pinduoduo delivered +11% growth, driven by its value-for-money propositions.
Average online penetration of our 27 tracked categories grew from 25% to 38% between 2019 and 2021. However, that growth has slowed since 2021. The analysis of online penetration by category reveals distinct clusters (see Figure 7):
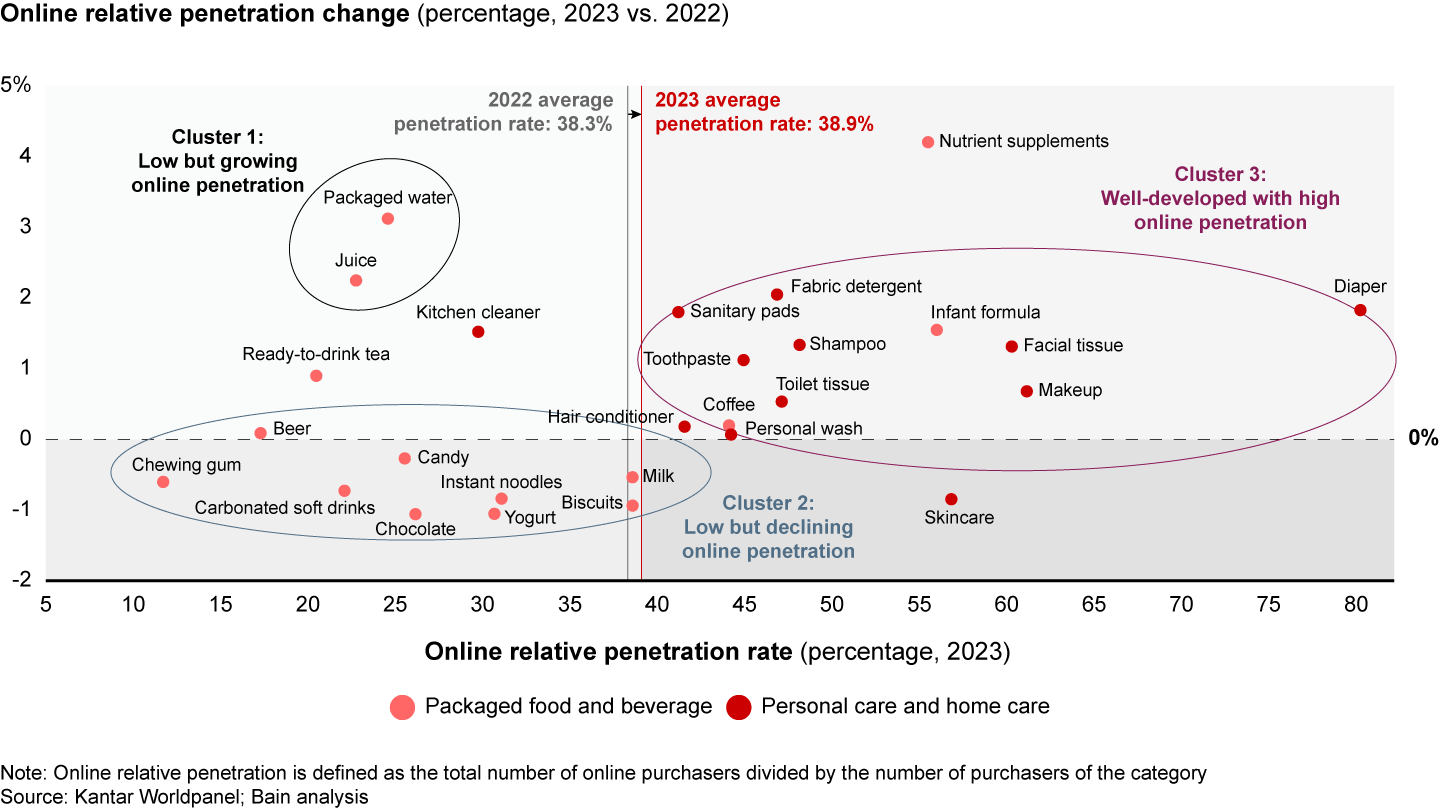

Cluster 1: Well-developed with high online penetration
This cluster mainly consists of personal care and home care categories. These categories have higher online penetration—above 40%—with some (e.g., makeup, skincare) reaching approximately 65%. This growth is driven by continuous online investments from top players and the faster growth of insurgent brands in online channels. Other categories, such as hair conditioner, toothpaste, and shampoo, have lower online penetration rates of 40%–50%, due to larger distributor networks of incumbent players and the heavier nature of these goods. We expect online penetration of these categories to grow at a slight pace of 0–2 points yearly.
Cluster 2: Low but declining online penetration
This cluster primarily consists of packaged food and beverage categories. Food and beverage categories have online penetration rates between 10% and 40%. These categories are often associated with on-trade purchases and higher impulse consumption. As offline consumption recovered, online penetration saw a slight decrease of -1% to 0% in 2023.
Cluster 3: Low but growing online penetration
Notably, packaged water and juice saw online penetration increases of 3.1% and 2.2%, respectively, attributed to decreasing logistics costs for heavy goods.
Major categories showed minor changes in online penetration, typically ranging from -1% to 1%, consistent with historical trends over the past three years. The online FMCG market in China has demonstrated moderate growth in online penetration rates, with particular strength in non-food and beverage categories such as personal care and home care. The market has reached a mature stage for these categories, while certain packaged food and beverage categories continue to grow in online adoption. This continued trend in online penetration across categories underscores consumers’ preference for convenience and variety.
Large brands and foreign brands lost steam
Brand competition remains dynamic, with new brands continuously challenging incumbents and gaining market share. While the Top 5 brands regained share in a few categories during the turbulence of 2022, mid- and long-tail brands regained share in 2023, in patterns more consistent with 2019 to 2021 trends.
Large brands vs. small brands
In China Shopper Report 2023, Vol. 1, we observed that the Top 5 brands gained share in 16 out of the 26 tracked categories in 2022. We attributed this change to the fact that larger brands tend to be more trusted by consumers and have more resilient supply chains, distribution networks, and financial strength during turbulent times.
In contrast, in 2023, smaller brands regained momentum, while the Top 5 brands lost share in 16 out of 27 tracked categories. Following the disruptions of 2022, mid-to-small brands are actively reinvesting and exploring new growth opportunities. Conversely, top brands have shown hesitation in future investments despite their resilient supply chains and financial stability during the Covid-19 years.
Notably, the Top 5 players have increased their market share in categories such as infant formula, diapers, and chewing gum. The shrinking nature of these markets benefits large brands with strong word-of-mouth reputations and fewer new entrants.
In categories with constant innovation, mid-to-small brands have gained market share with novel product offerings. In CSD, local brands like Dayao (大窑) are emerging and gaining share while more established brands are losing momentum. Similarly, local electric toothbrush brands are taking share from incumbents, while in the juice market, brands offering flavored and healthy options are outperforming larger brands.
Foreign brands vs. domestic brands
In 2023, domestic brands grabbed 1 point of market share from foreign brands, when considering aggregate outcomes across all 27 tracked categories (see Figure 8). This result is in line with our observations over the past 12 years. Foreign brands have lost market share in most categories due to internal and external factors. Internally, some foreign players have strategically slowed investments or exited the market. Externally, foreign brands have faced increased competition from insurgent brands offering innovative products and competitive pricing.
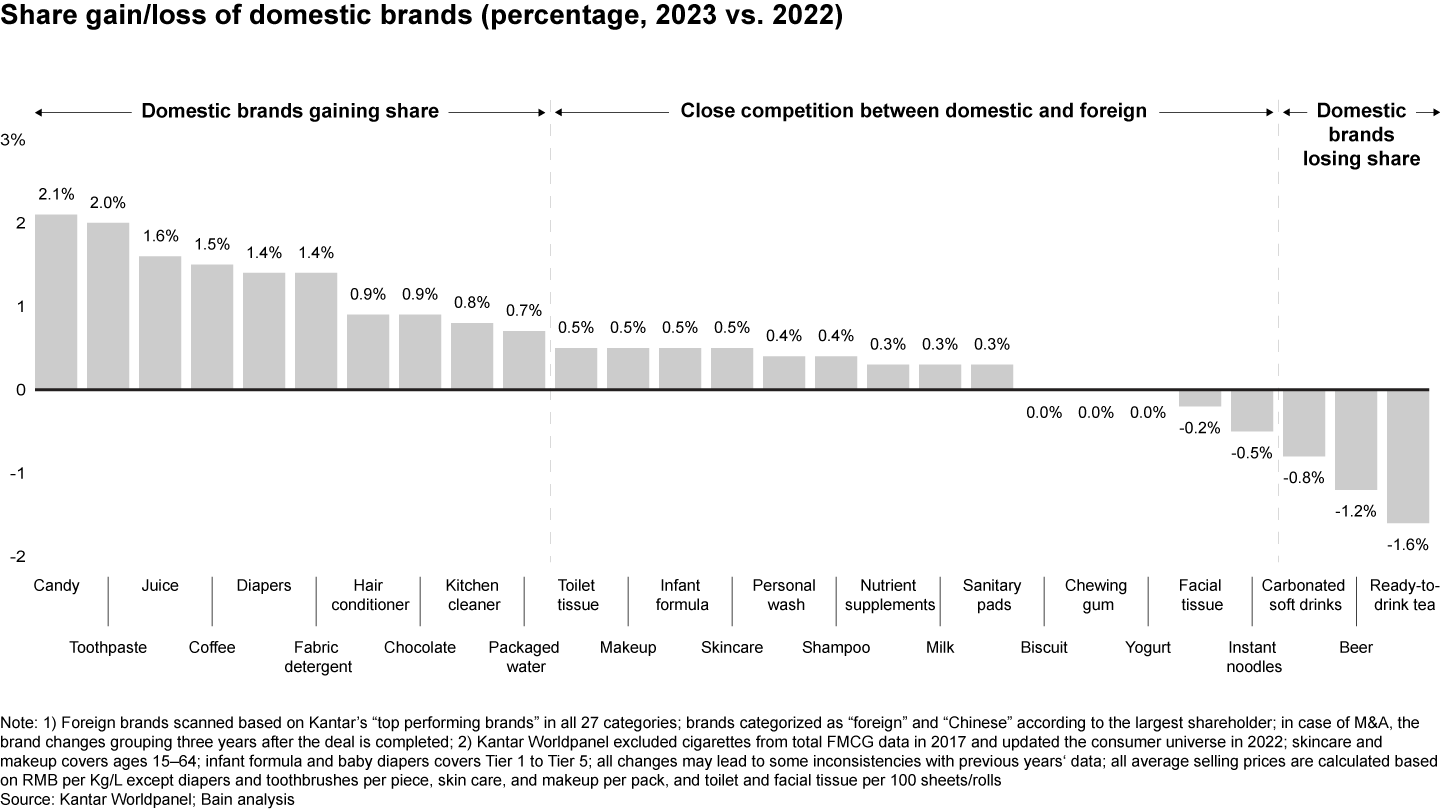

For instance, in diapers, domestic brands such as Babycare and Yiying (宜婴) are gaining market share due to their strong product offerings and effective channel strategies. In contrast, foreign brands, particularly Japanese and Korean brands like Kao (花王) and Goon (大王), are losing share due to channel stagnation and reduced investment in China. Meanwhile, local players, including Feihe (飞鹤) and Yili (伊利), are growing their market share with customized products, competitive pricing, and extensive offline distribution networks (e.g., mother and baby shops), even in shrinking markets like infant formula.
Domestic insurgent brands also pose significant challenges to foreign brands. These local competitors often leverage their deep understanding of the local market, agility in responding to consumer demand, and comparative cost advantages to capture market share. For example, Baixiang (白象) has achieved substantial growth in the instant noodle market over the past few years. It has expanded its offline presence in eastern China and captured online growth opportunities, especially on Tmall and Douyin. This is backed by consumer-centric innovation, as Baixiang continues to reimagine its product lines and introduce new flavors, such as its Tang Hao He (汤好喝) series. Similarly in toothpaste, domestic brands such as Oralshark (口腔鲨鱼) are growing significantly through platforms like Douyin.
Nevertheless, there are still categories where foreign brands have gained share on an aggregated basis. Examples include beer and CSD, largely due to foreign brands’ continuous branding investments and strong offline distribution networks.
Gaining perspective from the first quarter of 2024
In Q1 2024, the Chinese economy maintained its recovery trajectory, displaying encouraging signs of growth. GDP expanded by 5.3%, and retail sales witnessed a 4.9% increase. Domestic consumer traffic rebounded to pre-pandemic levels, reaching a new high in March. Despite these positive indicators, challenges persist. The Consumer Confidence Index has remained low since March 2023, indicating a cautious outlook among consumers.
In the FMCG sector, there was a slow but noticeable recovery in Q1 2024, with a growth rate of +2.0%. This growth was primarily driven by increased volume (+3.5%), although a reemergence of price deflation (-1.5%) posed a challenge to brands (see Figure 9).

Packaged food and beverage continue to lead the growth in Q1 2024; home care largely decelerated; personal care continues to decline
Among the four main sectors, packaged food and beverage witnessed stable growth. Packaged food continued its growth trend (+2.7%), driven by volume growth (+2.9%), which was partially offset by a small drop in ASP (-0.2%). Beverage showed faster growth (+4.3%), driven by both volume (+2.4%) and ASP (+1.8%).
In contrast, personal care declined (-2.8%), while home care’s growth decelerated to +2.2%, despite robust volume demand in both sectors (personal care, +5.1%; home care, +8.5%). This lackluster performance can be attributed to severe trading-down issues, with ASP declining in personal care and home care by -7.5% and -5.8%, respectively (see Figure 10).
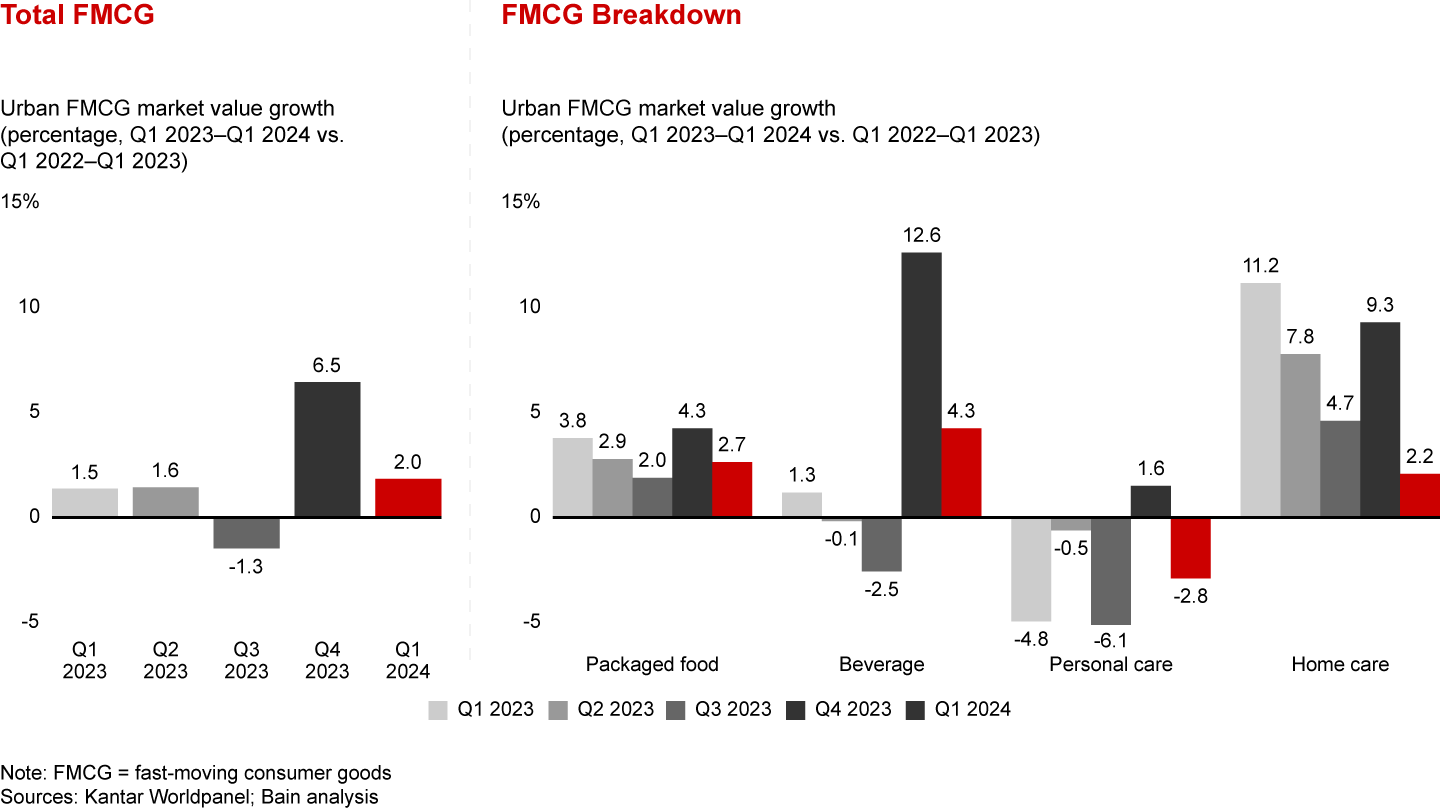

Packaged food: This sector grew by +2.7% in value, driven by a +2.9% increase in volume. However, ASP slightly dropped by -0.2% in Q1 2024—contrasting the premiumization evident throughout 2023. Major categories within packaged food saw volume growth due to the recovery of Chinese New Year gathering and gifting in Q1 2024, evidenced by strong social mobility during the holiday. The sector was negatively impacted by recovering offline catering, which delivered a +11% growth in sales in Q1 2024 compared to Q1 2023. The reversed pricing trend in this sector can be attributed to some price elasticity. Consumers opt for diverse price bands based on occasion. Taking chocolate as an example, in 2023, we observed a trend of consumers trading up for premium brands such as Godiva (ASP ~420), particularly for gifting occasions such as birthdays and Valentine’s Day. In Q1 2024, this trade-up trend persisted. The recovery of celebratory occasions such as Chinese New Year led to a significant increase in gifting opportunities, but brands’ promotion of bulk products resulted in a lower ASP. Brands like Snickers (士力架, ASP ~90) gained market share. Overall, the price of chocolate remained stable compared to Q1 2023.
Beverage: This sector’s value grew by 4.3%, driven by increases in both volume (2.4%) and ASP (1.8%). The near-water trend continued. Juice (+20.8%), packaged water (+5.6%), and RTD tea (+8.6%) maintained high growth, consistent with the trend observed in 2023. Milk and coffee experienced a reversal in their growth trends, declining by -2.9% and -5.9%, respectively. This shift can be attributed to increased out-of-home activities and consumption compared to Q1 of the previous year when most people stayed at home due to Covid-19. Beer experienced growth of 8.4%, driven by more at-home gatherings. Yogurt continued to decline by 8.4%. Outside of our tracked categories, wine and spirits also drove up the sector’s ASP, largely as a result of Chinese New Year gifting.
Personal care: This sector saw a robust volume rebound (+5.1%), countered by a significant drop in ASP (-7.5%), resulting in an overall value decline of -2.8%. Most categories experienced strong volume growth, driven by increased social activities. For instance, makeup (volume +13.8%) and toothpaste (volume +6.4%) witnessed notable increases. However, consumers remained cost-conscious, leading to a decline in ASP across most personal care categories, especially in skincare (ASP -8.8%), makeup (ASP -13.2%), and hair conditioner (ASP -6.8%). This trend can be attributed to intensified competition between domestic and foreign brands, as well as channel shifts. In makeup, for instance, domestic brands known for offering value-for-money alternatives increased their share from 32% in 2023 to 45% in online channels in Q1 2024. Meanwhile, foreign brands resorted to heavy promotions to defend their market share. For example, Estée Lauder’s flagship product, Advanced Night Repair Eye Cream, experienced a -15% ASP decrease during this year’s Women’s Day campaign compared to 2023. This pricing dynamic can also be partially attributed to channel shifts. Douyin, known for generally offering lower ASP products compared to traditional e-commerce platforms, surpassed Taobao/Tmall in the makeup and fragrance sector in Q1 2024 in terms of gross merchandise volume (GMV).
Home care: Volume in this sector experienced significant growth of +8.5%, while the ASP dropped by -5.8%, resulting in a value growth of +2.2%. Much like our observations in the personal care sector, most home care categories witnessed strong volume demand due to enhanced customer awareness regarding diverse use occasions, increased social activities, and a heightened focus on hygiene and health post-Covid-19. Fabric detergent experienced +5.7% value growth driven by volume (+8.9%), primarily attributed to customers shifting from powder and bar products to premium options containing natural ingredients and fragrances. However, the ASP for these products has declined by -3%, driven by the availability of more affordable, larger-package options and the success of domestic brands that align with current trends. Toilet tissue saw a volume decrease of -3.8% as customers had already stocked up during the previous Double 11 shopping festival. The ASP for toilet tissue also dropped by -5.4% due to a decline in the price of paper material and customers’ transition to cheaper alternatives, such as hanging tissue.
FMCG ASP deflationary trend reemerged in Q1 2024, a downturn from 2023’s stable pricing trend
Despite a slight rise of 0.1% in Q1 2024 consumer price index, inflation in China has largely abated, maintaining a trend observed since Q2 2023. In contrast, FMCG ASP saw a decrease of -1.5%, a decline from the stable pricing trends of 2023 (see Figure 11).

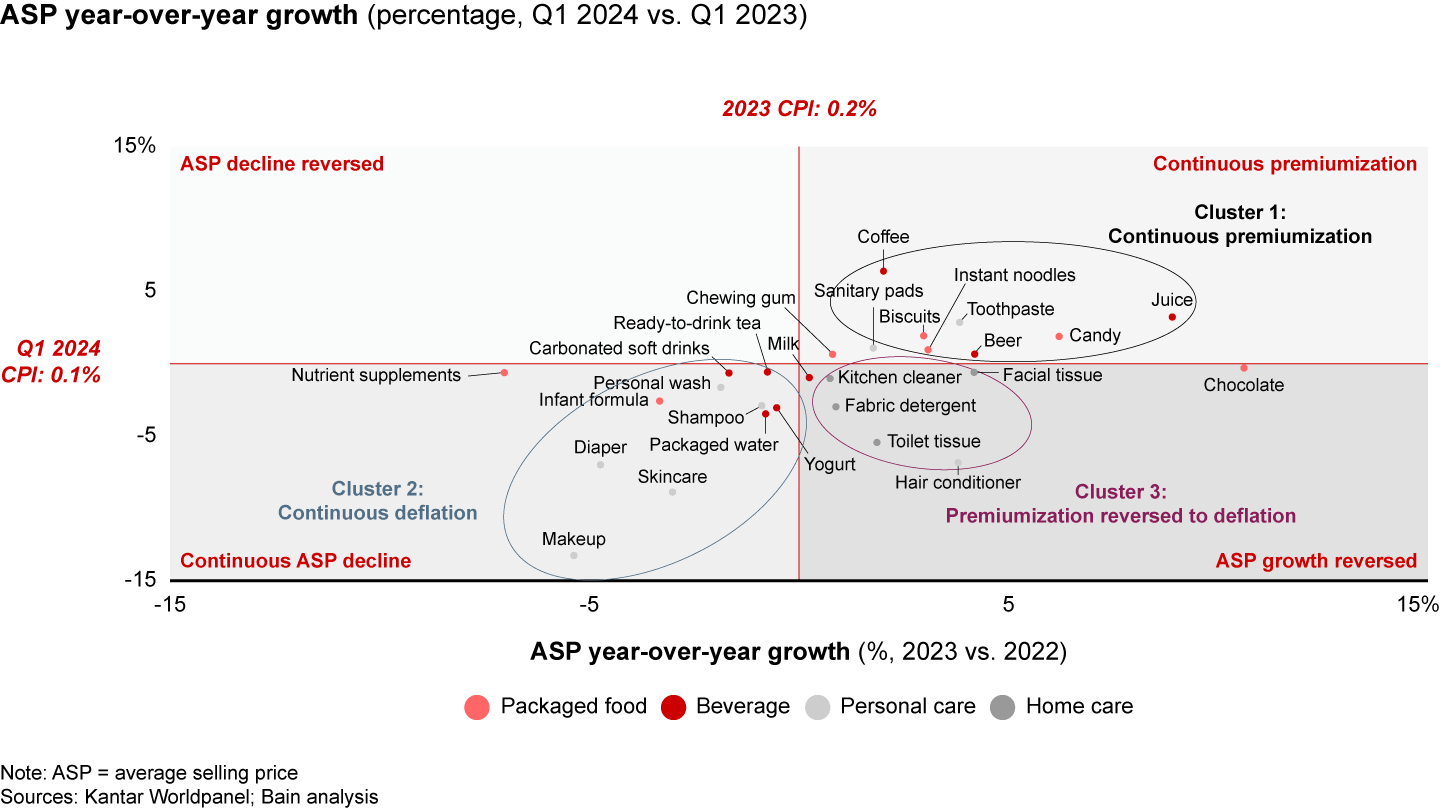
Among the 27 tracked categories, 18 categories experienced ASP deflation in Q1 2024. This trend was especially evident in personal care and home care. In our data, three clear pricing trend clusters emerged (see Figure 12):

Cluster 1: Continuous premiumization
This cluster primarily includes packaged food and beverage categories, such as coffee (Q1 2024 +6.4%, 2023 +2.0%), juice (Q1 2024 +3.2%, 2023 +8.9%), candy (Q1 2024 +1.9%, 2023 +6.2%), and biscuits (Q1 2024 +1.9%, 2023 +3.0%). These categories benefit from consumers’ increasing preference for health-conscious products. For example, in juice, consumers continue to trade up to 100% NFC and fresh juice options. Additionally, these brands also led premiumization, with better quality and innovative products, such as craft beer and coffee capsules.
Cluster 2: Continuous deflation
Most personal care categories fall into this bracket. In a highly competitive market, insurgent brands continue to challenge incumbents by offering lower-priced products, while large incumbents reduce prices during campaigns. This trend is particularly evident in skincare (Q1 2024 -8.8%, 2023 -3.0%) and makeup (Q1 2024 -13.2%, 2023 -5.4%). In skincare, domestic brands such as KANS (韩束), Proya (珀莱雅), and Grain Rain (谷雨) are gaining market share from other brands by capturing efficacy trends and offering products priced below 300 RMB. In response to these lower-priced products, larger brands lower prices for their bundled products during sales events like the Women’s Day campaign. The effort to cut prices can be partially attributed to the price decrease in raw materials, such as urea (-20%) and silicone (-10%), which created favorable conditions for price competition. Some products saw brands promoting larger pack sizes, which also led to ASP declines in categories such as packaged water (Q1 2024 -3.4%, 2023 -0.8%). Diapers (Q1 2024 -7.0%, 2023 -4.7%) and infant formula (Q1 2024 -2.6%, 2023 -3.3%) are also in this cluster due to increased competition resulting from demographic changes.
Cluster 3: Premiumization reversed to deflation
This cluster consists mainly of home care categories, including fabric detergent (Q1 2024 -3.0%, 2023 +0.9%), kitchen cleaner (Q1 2024 -1.0%, 2023 +0.8%), and facial tissue (Q1 2024 -0.6%, 2023 +4.2%). The deflation evident in this cluster does not necessarily indicate a consumer preference for cheaper products. Consumers are still trading up for better products in this sector, such as liquid detergents over bar or powder formats. This deflation is primarily supply driven, as brands have proactively promoted larger pack sizes and lowered prices due to lower raw material costs.
Overall channel trend is in line with 2023, though performance in offline channels continues to diverge
Channel dynamics in the market have continued to evolve and remain dynamic, consistent with our overall findings in 2023 (see Figure 13).
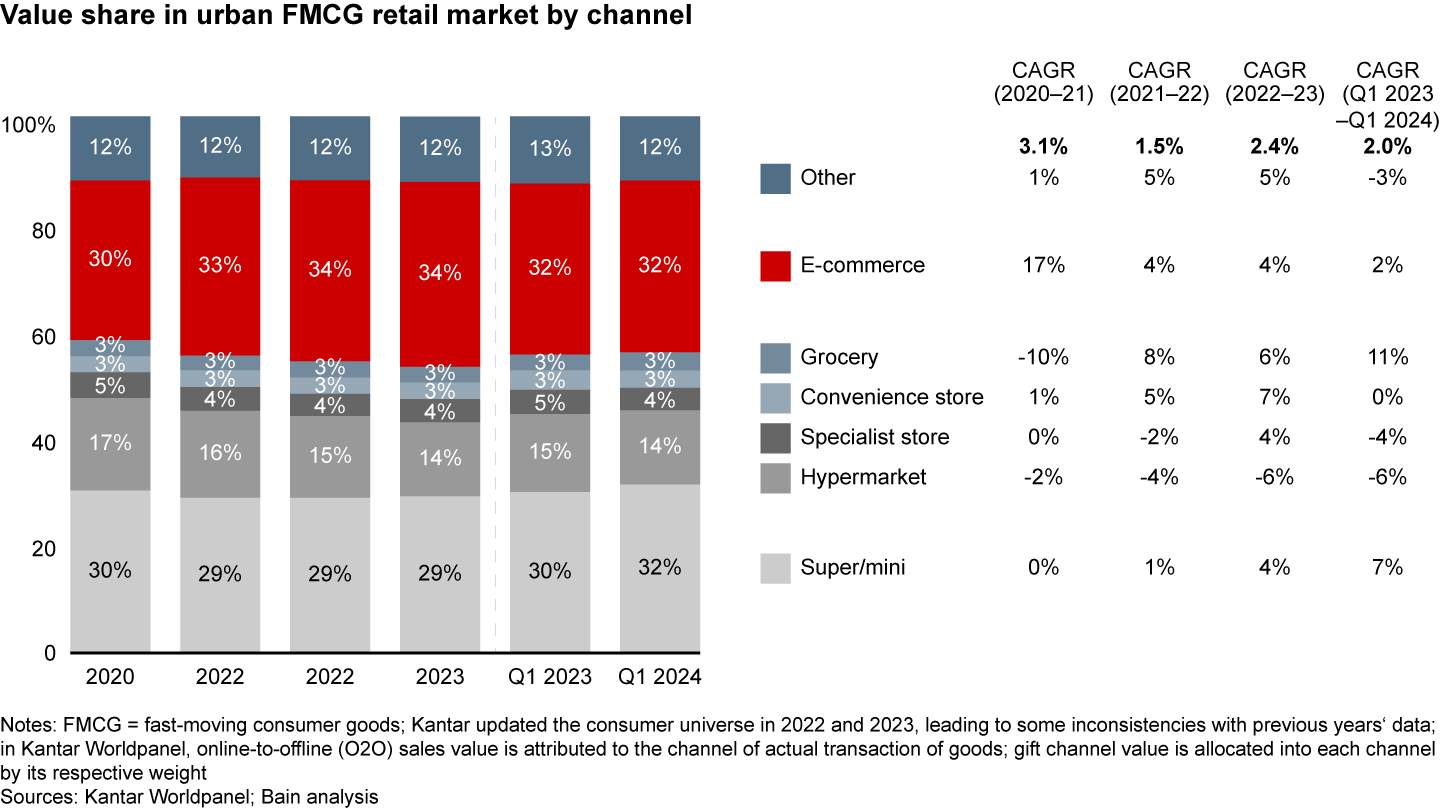

Offline channels: In Q1 2024, offline channels experienced a moderate growth of +2.4% overall. Grocery and super/mini formats emerged as the standout performers, achieving growth rates of +11% and +7%, respectively. These channels capitalized on increasing frequency and penetration, benefiting from the recovery of offline traffic. Retailers within these formats continued to refine their store offerings, providing differentiated value propositions such as discounts, enhanced services, and private-label products. Some regional key accounts and local key accounts, such as Jiajiayue (家家悦) and Hongqi Chain (红旗连锁), emerged as top growth contributors in the super/mini channel. In contrast, the hypermarket sector continued to shrink, with a CAGR of -6%. This decline can be attributed to both a decrease in volume and purchase frequency, with around a -5% decrease observed in each. Major retailers such as Carrefour closed stores, further contributing to this trend. However, the club warehouse component of the hypermarket sector performed well, experiencing a growth of +22% and capturing a 9% share within the overall hypermarket segment. Specialist stores faced a decline of -4% in Q1 2024, in contrast to the +4% growth observed in 2023. Despite a +15% increase in overall volume, the ASP declined by -17% due to intense competition from discount stores, which saw increased penetration, reaching 5.9% in Q1 2024. For example, snack discount retailers Lingshi Hen Mang (零食很忙) and Zhaoyiming (赵一鸣零食) merged and expanded, collectively operating 7,500 stores.
O2O (Online-to-Offline): Q1 2024 O2O saw a value decline of -8% compared to Q1 2023 due to the full recovery of offline activities. However, there is still growth of +5.5% compared to Q1 2022, indicating that consumers have developed O2O shopping habits. As discussed in the 2023 full-year trend, consumers continue to use O2O in non-food and beverage categories. Community group buying has decreased by -15% in Q1 2024, mainly due to key players Duoduo Maicai (多多买菜) and Meituan Youxuan (美团优选) focusing on profitability improvement instead of GMV since last year. Horizontal marketplaces saw a drop of -9%, as these channels were negatively impacted by recovering offline consumption. Offline retailers demonstrated a slight growth of +1%, driven by offline key accounts’ efforts to direct offline traffic to online.
Online channels: The e-commerce landscape in China’s FMCG market is evolving, with moderate overall growth of +2% in Q1 2024 and significant shifts in platform dynamics (see Figure 14). Notably, Douyin surpassed JD to become the second-largest e-commerce platform, delivering substantial growth of +46% and achieving an 18% market share in Q1 2024, up 6 points from Q1 2023. Brands are increasingly prioritizing Douyin for their operations and investments, thereby positioning Douyin to capture market share from traditional e-commerce platforms. The platform’s unique combination of short videos and live streaming has proven effective in driving impulse purchases, particularly in categories with a short customer journey and less emphasis on brand loyalty. Pinduoduo’s success (+6% growth and a 15% market share, up from 14% in Q1 2023) highlights the continued importance of value-for-money propositions in attracting and retaining consumers. JD experienced +5% growth, leveraging its low-price strategy to reverse its -1% decline from 2023.
Taobao/Tmall remains China’s largest e-commerce platform, but they continued to decline at -7%, with their market share landing at 32% (3 points lower than Q1 2023).

Insurgents: Competitive strengths that navigated through cycles
The Chinese FMCG market has recently experienced an influx of numerous insurgent brands. These insurgent brands rapidly grabbed market share from incumbents by leveraging venture capital and investing in online traffic. However, in recent years, as traffic has peaked and costs have risen, their “cash-burning” operational model has become unsustainable. Investors have become more cautious and rational, forcing brands to optimize efficiency. When the facade of traffic fades away, a brand’s true strength or false prosperity becomes evident.
In our previous reports, China Shopper Report 2018, Vol. 2, Local Insurgents Shake Up China’s “Two-Speed” Market, and China Shopper Report 2021, Vol. 2, A Sudden Slowdown in 2021’s FMCG Recovery and the Mixed Fate of China’s Insurgent Brands, we selected representative insurgent brands with “disruptor potential.” We have been tracking these brands’ performance over the years to synthesize key factors behind their degree of success to date.
Class of 2018 brand performance reflection
In 2018, we selected 46 representative insurgent brands based on brand characteristics, scale, and growth performance. In 2021, we reviewed their performance from 2018 to 2020 and categorized them into three groups: “Stand-out” (17 brands, 40%), “Hold-out” (9 brands, 20%), and “Fade-out” (20 brands, 40%). Revisiting their performance in 2024, we found a similar category distribution: Stand-out (18 brands, 40%), Hold-out (9 brands, 20%), and Fade-out (19 brands, 40%).
By analyzing these brands’ development trajectories, we identified four key success factors driving insurgent brand growth in 2021: brand power, product ecosystem, channel capability, and organizational agility (see Figure 15). When revisiting these brands’ performance from 2020 to 2023, we found that these success factors still held.

Stand-out: The strong get stronger
Many Stand-out brands in 2021 continue to excel. For example, YankershopFood (盐津铺子) innovated its products to closely follow trends, launching healthy meal replacement snacks in vegetarian, tripe, and quail egg flavor varieties. Meanwhile, it deeply integrated with snack chain stores such as Lingshi Hen Mang (零食很忙) and Hao Xiang Lai (好想来) to provide sufficient profit space for its channels, enabling high-speed growth of 34% CAGR from 2021 to 2023.
Additionally, some brands previously categorized as Hold-out or Fade-out in 2021 achieved breakthroughs and became Stand-outs in 2024 by investing in key areas. For instance, Ganten (百岁山) regained growth and become one of the top players in the packaged water market through brand revitalization. By rebranding itself as “Noble in Water,” Ganten successfully attracted consumers at a price point between 3-5 RMB/L, 40% to 55% higher than mass brands. The company also went deeper into offline channels, leveraging a well-developed distributor network along with various offline marketing initiatives. These moves further consolidated Ganten’s channel dominance and grew the company’s penetration and frequency. Consequently, Ganten achieved a sales CAGR of 34% between 2021 and 2023.
Hold-out and Fade-out: Continued struggles
Most Hold-out and Fade-out brands continued to face growth challenges in a competitive environment. These struggles can be attributed to the loss of established advantages, failure to adapt to channel shift, or lagging product innovation. For example, One Leaf (一叶子) consistently underperformed due to heavy reliance on cosmetics specialty store channels, outdated product upgrades, and failed rebranding efforts. In the past, One Leaf had successfully relied on the cosmetics specialty store as a key sales funnel, but the recent, rapid growth of online channels and the fading of cosmetics specialty store dividends stifled the company’s growth. What’s more, One Leaf heavily relied on face mask products with a single point of hydration, while competitors turned to upgrades like advanced ingredients and efficacy-driven benefits. As the parent company reprioritized marketing investment amongst its brand portfolio, One Leaf was no longer able to sustain its brand power as a “clean beauty” hero.
Class of 2021 brand performance reflection
In 2021, we applied similar criteria to identify 69 insurgent brands, and we reviewed their operational performance between 2021 and 2023. Our analysis revealed a distribution of players akin to the Class of 2018, with three main categories: Stand-out (28 brands, 40%), Hold-out (12 brands, 20%), and Fade-out (29 brands, 40%). Key differences among the Class of 2021’s brand trajectory can still be adeptly explained by the four-lever model of insurgent brand success used in earlier analyses and described in Figure 15.
Stand-out: These brands have established remarkable competitive advantages across at least two levers, with no evident shortcomings. For instance, despite the declining demographic dividend in the maternal and infant market, Babycare has emerged in recent years, leveraging a full-category strategy and embracing omnichannel acceleration. This approach has led to a sales CAGR of 27% from 2021 to 2023. Babycare offers more than 5,000 SKUs to create a one-stop shopping experience for consumers. They use big data to gain insights into consumer needs and to innovate in mainstream categories, such as “Flower Pants” and airpro diapers. These innovations are supported by a large product insights and development team, with 600+ designers integrated into the company’s original design manufacturer (ODM) supply chain. Meanwhile, Babycare continues to establish an omnichannel presence. In the early years, Babycare gained sales on Tmall by occupying the whitespace price bands and leveraging traffic tools. It has ranked as the top brand in Tmall’s maternal and baby sector for four consecutive years. Starting in 2021, as Tmall’s traffic peaked, Babycare doubled down on investments in JD and Douyin, recognizing the importance of an omnichannel strategy for future success. Today, the contribution from Tmall has decreased from over 90% to less than half. Additionally, Babycare actively expanded offline channels, with over 100 directly operated stores and tens of thousands of distribution outlets, increasing the offline sales contribution to 30%.
Hold-out: These brands exhibit notable strengths in one or two dimensions but also suffer from identifiable weaknesses. For instance, the rise of the “single economy” phenomenon has led to a surge in the number of packaged food brands. Bibigo (必品阁) leveraged its distinctive Korean cuisine offerings, particularly frozen dumplings, to initially thrive during the Covid-19 era. However, as out-of-home dining recovered, Bibigo encountered challenges in maintaining its market position. Their heavy reliance on traditional e-commerce platforms such as Tmall and JD, coupled with delayed response to emerging interest e-commerce (Douyin) and O2O opportunities, has caused Bibigo to lag behind its competitors.
Fade-out: Typically, these brands have not been able to sustain their growth against new market and competitive trends. For instance, Ramen Talk (拉面说), a quintessential example of an emergent brand that found early growth through online traffic, experienced steep decline following its initial, rapid rise in popularity. During the Covid-19 pandemic, Ramen Talk achieved fast growth by adopting a “heavy traffic buy” approach and capitalizing on consumption trade-up trends and the growing demand for dining at home. By heavily investing in Douyin, Ramen Talk even surpassed the entire ramen category in online search visibility. However, Ramen Talk faced challenges in transitioning offline. Despite successful cooperation with Carrefour, it encountered setbacks expanding to other key accounts due to an unclear single-store model. As a result, Ramen Talk saw a CAGR of approximately -30% in retail sales from 2021 to 2023.
In the class of 2021 brands, approximately 20 brands (30%) are affiliated with large corporate parent groups.7 Supported by these entities, these brands have a greater likelihood of enhancing their business operations. By leveraging the resources of the parent company, these brands can strengthen their positions and achieve rapid breakthroughs. However, if they are not prioritized within the parent company’s brand matrix, their performance may still suffer despite the inherent advantages of corporate support.
SuperX (勇闯天涯), a sub-brand of Snow Beer (雪花啤酒), experienced a sales CAGR of 15% from 2021 to 2023, leveraging the resources of its parent company, China Resources (华润集团). Snow Beer strategically positioned SuperX to capture market share among the younger generation by signing top celebrities such as Wang Yibo as brand ambassadors and conducting multiple marketing campaigns on social media platforms. SuperX also gained traction across various channels by leveraging the robust distribution capabilities of Snow Beer.
In contrast, Perfect Diary (完美日记), a makeup brand owned by Yatsen Global (逸仙电商), saw a CAGR of approximately -46% from 2021 to 2023. Perfect Diary initially heavily invested in traffic acquisition and rapidly gained market share. However, Yatsen Global shifted its focus to skin care as its growth engine in recent years, acquiring skin care brands such as Galénic and Dr. Wu. Consequently, the resources allocated to Perfect Diary declined significantly.
Class of 2024 brands
Based on our research experience on China’s insurgent brands over many years, we once again conducted extensive research on representative insurgent brands in more than 40 categories this year. This year we have selected 61 insurgent brands to form the Class of 2024 (see Figure 16). Most of these brands were born between 2019 and 2021, during the peak period of China’s new consumer brand investment. When we conducted the 2021 selection, they were not yet large enough to enter the list. However, in the past few years, many of them grew despite adverse market conditions during the Covid-19 years.

When looking into the 2024 insurgent brands, we found that the four-lever model comprised of brand power, product ecosystem, channel capability, and organizational agility continued to be crucial for their success story. However, we also observed evolving requirements on these four levers based on the latest market dynamics (see Figure 17).
- Brand power: From “Pure traffic buy” to “Branding-performance re-balance”
- Product ecosystem: From “Undifferentiated substitution” to “WOW experience”
- Channel capability: From “Single-channel dominance” to “Connected commerce”
- Organization capability: From “Speed and agility” to “Agility, capability, and efficiency”
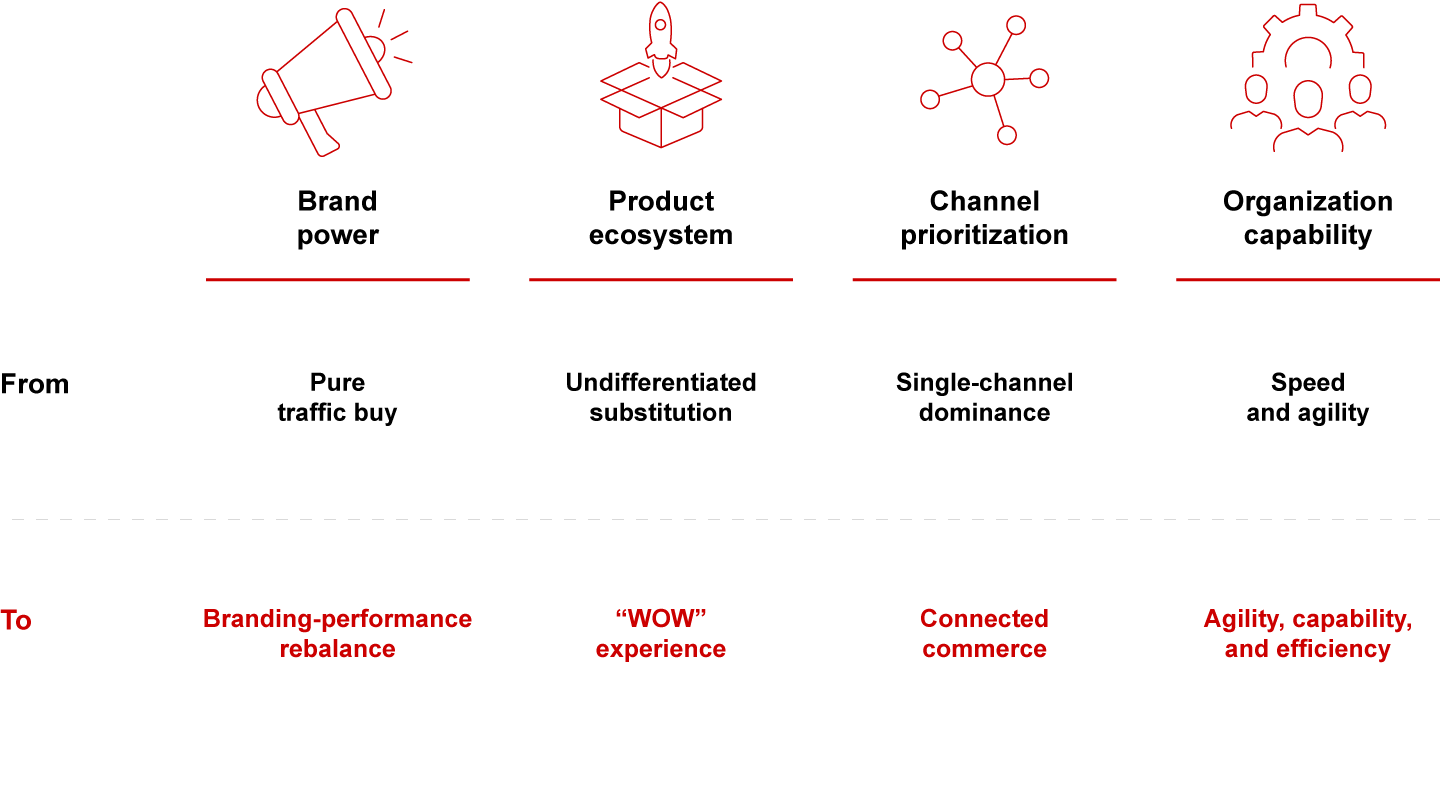

In channel prioritization, notably, there’s an increasing need for insurgent brands to capture emerging channels and develop “Connected Commerce” capabilities instead of being siloed in a specific channel. For example, Yongpu (永璞) is transitioning from being an “online influencer brand” to establishing an omnichannel presence by expanding its offline distribution networks. It has established a comprehensive portfolio strategy, promoting key products with large package sizes on Tmall, launching new products on Douyin, and offering small-to-medium-sized packages offline. Internally, Yongpu has focused on talent development and optimized its supply chain to support product innovation. Additionally, it has invested in digital capabilities for proprietary customer relationship management (CRM) programs. These efforts have propelled its outstanding growth in the coffee segment, where it achieved a sales CAGR of approximately 50% from 2021 to 2023.
Passional Lover (恋火) has fully leveraged Douyin to realize its accelerated growth through a tailored product portfolio, customized content creation, and operational excellence. In terms of product strategy, it focuses on foundational products within the masstige price band of 150-300 RMB, aligning with the trade-down trend in makeup and appealing to customers seeking value-for-money options. Key selling points such as “invisible” and “long-lasting” are emphasized in marketing efforts, and effectively communicated to customers. The brand excels in eye-catching content creation on Douyin with posts that skillfully capture product selling points and react swiftly to trends. Passional Lover’s operational excellence is further evident in its refined online platform operations, including a comprehensive live-streaming matrix and network of influencers featuring top KOLs, which trigger a halo effect and drive sales conversion efficiently.
In the end, what truly matters to consumers are brands that can deliver against these four key levers, whether they be insurgents or incumbents. Both types of companies will continue to co-exist in China’s FMCG market and contribute in their unique ways. The most successful companies will learn from each other and thrive in symbiosis. This cross-fertilization between incumbents and insurgents will drive the flourishing of the China FMCG market, bringing forth a multitude of possibilities and excitement for Chinese consumers.
What’s next: Implications for brands and retailers
China’s recovery from its reopening has indeed led to the anticipated rebound in economic activities, evident in yearly GDP growth and retail sales. However, macroeconomic challenges persist, including high youth unemployment, a mixed recovery in the property sector, and overcapacity in industry.
Consumption remains pivotal to economic growth, supported by a gradual recovery in consumer confidence. Stimulus policies aimed at boosting consumption have been implemented by the government, with more anticipated. Nonetheless, consumers exhibit continued price sensitivity, contributing to a persistent deflationary environment in the FMCG sector.
Despite these challenges, the FMCG industry exhibits resilience, with consumers, brands, and retailers adapting to evolving circumstances. The FMCG recovery is expected to continue in the coming months, reflecting trends observed in the first quarter of the year.
To position themselves for success in 2024 and beyond, brands should focus on several key strategies:
Follow consumers’ true needs: Post-pandemic, consumer needs and preferences have shifted significantly. Brands must closely monitor these evolving demands and seize growth opportunities in new segments, geographies, occasions, channels, and touchpoints. Understanding consumer behavior and competitor moves is crucial for unlocking potential growth opportunities.
Manage costs: Persistent deflationary trends in the FMCG sector necessitate cost management. Brands should prioritize investments in areas that truly matter to consumers, such as product formulation, raw materials, and packaging. Savings achieved in these areas can be reinvested in marketing and pricing strategies to address ongoing price sensitivity.
Build integrated route-to-market strategies: The distinction between online and offline channels is increasingly blurred, as shopper journeys involve both online and offline touchpoints. Brands must break strategic planning silos and develop integrated strategies that follow multiple consumer touchpoints in the era of connected commerce. This includes collaboration models that effectively leverage both online and offline channels.
Rejuvenate out-of-home opportunities: With the resurgence of out-of-home consumption, particularly in social settings and food service-related channels, food and beverage brands should strategically reinvest in out-of-home opportunities. Given the fragmentation of the out-of-home channels, brands need to be selective in the channels they target and develop unique value propositions to win in these targeted channels.
Retailers facing intensified competition and evolving channel dynamics should also focus on:
Sharpen shopper value propositions: In a landscape of diverse retail formats, retailers should focus on clearly defined core shopper segments and tailor value propositions accordingly. Re-orienting to shopper lifetime value, retailers should establish defendable moats through differentiated merchandising, pricing, promotion, and shopper engagements.
Sweat the assets: Retailers need to undertake a future-back reset of physical infrastructure requirements and revisit inflight investments plans to align more closely with evolving consumer touchpoints, journey, and behavior. This allows retailers to unlock productivity and manage ammunition for investments.
Refocus capability-building with technology and talent: Retailers should leverage data, automation, and leapfrog technologies like generative AI to unlock productivity gains in assortment, availability, pricing, promotions, and digital marketing. This requires upskilling existing workforce and revitalizing the organization around an authentic purpose and mission.

Worldpanel—Decoding shopper behavior to shape your brand future
Worldpanel provides brands and retailers with a unique, 360-degree understanding of consumer behaviour across the globe. We are shopper-centric, continuously monitoring the purchase and usage behaviour through the largest omnipanel in the world to shape the brands of tomorrow by better understanding people everywhere. With unparalleled datasets, pioneering technology and expert analysts, we partner with brands and retailers of all sizes, empowering them to reimagine what’s possible, and change the landscape to create a better, healthier, more sustainable and inclusive world. In the China market, Worldpanel is one of the services in CTR, covering over 100 FMCG categories, 50,000+ brands, and 100+ retailers, among many others. www.kantarworldpanel.com/cn-en
Anmerkungen
- The scope of the FMCG market in this report doesn’t include 12 new categories tracked by Kantar Worldpanel since 2022, therefore there might be some data discrepancies between this report and other Kantar publications. Kantar Worldpanel has excluded cigarettes from total FMCG data in 2017 and adjusted the online channel weight factor upper threshold for paper products to better reflect market realities in 2020. Skincare and makeup data are collected from the Kantar Worldpanel beauty panel, covering consumers ages 15–64 in Tier 1–5 cities; infant formula and diaper data are collected from the Kantar Worldpanel baby panel, covering households with babies 0–36 months old in Tier 1–5 cities. All average selling prices are calculated based on RMB per Kg/L, except for diapers and toothbrushes, which are calculated based on RMB per piece; skincare and makeup, which are calculated based on RMB per pack; and toilet and facial tissue, which are calculated based on RMB per 100 sheets/rolls.
- The 26 categories were (a) packaged food: biscuits, chocolate, instant noodles, candy, chewing gum, and infant formula; (b) beverage: milk, yogurt, juice, beer, ready-to-drink tea, carbonated soft drinks, and packaged water; (c) personal care: skincare, shampoo, personal wash, toothpaste, makeup, hair conditioner, diapers, and toothbrushes; and (d) home care: toilet tissue, fabric detergent, facial tissue, kitchen cleaner, and fabric softener.
- Three categories were added: nutrient supplements (packaged food), coffee (beverage), sanitary pads (personal care); two categories were eliminated: toothbrush (personal care), fabric softener (home care).
- The definition of city tiers is based on Kantar’s classification. Tier 1 cities include Beijing, Shanghai, Guangzhou, Chengdu; Tier 2 cities include provincial capital cities excluding Guangzhou and Chengdu, and Tianjin, Chongqing, Shenzhen, Dalian, and Qingdao; Tier 3 cities include prefecture-level cities, excluding Dalian and Qingdao; Tier 4 cities include county-level cities; Tier 5 cities include all other town-level cities.
- Club warehouse is categorized as membership-based hypermarket in the Kantar Worldpanel and includes Sam’s Club, Metro, Freshippo membership store, Costco, etc.
- In Kantar Worldpanel, O2O sales value is categorized in channels where the transactions happen: sales of O2O vertical grocery e-commerce and community group buy are accounted for in e-commerce; O2O offline retailers’ sales are categorized according to the retailers’ main formats (e.g., Walmart O2O sales are categorized in hyper); O2O horizontal marketplaces’ sales are calculated based on the end shopping entities (e.g., if consumers orders from 7-Eleven through Meituan/Ele, the value will be calculated in convenience store).
- A large corporate parent group is defined as a group company with brand matrix. The company is either listed or among 2023 Fortune China 500 ranking.